Transcription
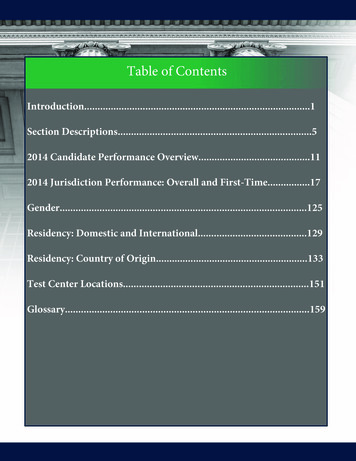
Table of ContentsIntroduction.1Section Descriptions.52014 Candidate Performance Overview.112014 Jurisdiction Performance: Overall and First-Time.17Gender.125Residency: Domestic and International.129Residency: Country of Origin.133Test Center Locations.151Glossary.159
INTRODUCTIONThe National Association of State Boards of Accountancy (NASBA) began gathering data on CPAexamination candidates in 1982 and has published reports on performance and selected characteristicssince 1985. This edition of the book covers candidate performance for the Uniform CPA Examinationfor all four testing windows in the calendar year 2014. NASBA offers these reports through thevoluntary participation of candidates and their individual Boards of Accountancy, which provide data,and the cooperation of the American Institute of Certified Public Accountants (AICPA), which preparesand scores the Examination for the 55 U.S. jurisdictions.BACKGROUND DATAThe background data is obtained directly from State Boards of Accountancy, when they submitinformation about eligible candidates to NASBA’s Gateway System. The Gateway System is a WebInterface which provides state boards a means to enter, review, and manage candidate information.The process of entering candidate information using the Web Interface results in the eventualscheduling of an Examination by the candidate. Candidate information is transmitted through theGateway System and stored in the National Candidate Database (NCD) where all CPA candidateinformation and Examination history data is maintained.NOTE ABOUT THIS EDITIONThe users of this and other reports related to university performance on the CPA examination need tobe aware of several factors affecting its usability as a comparative tool across institutions.1. Many/most students are classified as bachelor’s students though they are in graduateprograms. For example, if a student applies to take the CPA exam while in a Master’s program,the student may list only a bachelor’s degree for completed degrees. Consequently, theAdvanced degree results represent a subset of students with Advanced degrees.2. Because of 1, the Institution results may be the best indication of university performance3. Custom analysis using university-provided graduation lists yield the most accurate informationabout program performance.4. In the first-time within one year results, the degree date was missing for XX percent of thecandidates.5. Because of space considerations, we provide summary pass rate information for individualschools. However, school and program reports with content area results (similar to the OverallPerformance report on pages 13 and 14) are available to universities as part of a customanalysis. Information on custom analysis and pricing can be found at nasbareport.com.6. The school results should be interpreted cautiously because school missions and studentdemographics differ.1
WHAT’S NEW WITH THE REPORTINGIn 2016 the data will be presented in two books. The Jurisdiction Edition, designed specifically with theState Boards in mind, will provide a broad view of the CPA Exam trends from around the world. TheUniversity Edition focuses on university and accreditation reports, including international, regional,national and state. University rankings based upon examination data will also be a prominent featurein this edition.Content Area PerformanceIn addition to the four primary sections (AUD, BEC, FAR, REG), the new publication will includeperformance metrics by cohort for each of the 23 content areas and four skills areas. The content areaperformance metric represents the percentage of students who received a comparable or strongerscore for that area.Cohort TrackingAll candidates who begin the examination process in the same calendar year are members of thecohort. Presenting the data in this way allows for a more accurate analysis of trends in the accountingpipeline.Pipeline ReportingThis section of the reporting provides in-depth analysis of a candidate’s path through the examinationprocess, whether they pass all four parts or choose to drop out. In 2014 there were 25,614 candidateswho passed their 4th part of the exam, 19,704 candidates dropped out of the exam, and 60,273remained active in the examination process at the end of calendar year.DEMOGRAPHICSThe reader should note that demographic data is not reported completely for all jurisdictions. This gapin data is often due to the fact that the reported information may not be critical to a given jurisdiction’sapplication process and thus not collected. NASBA will continue to work with several of thejurisdictions to close many of the data collection gaps.SECTION DESCRIPTIONSIn an effort to present the data in a clear-cut manner, section descriptions for each individualcomponent of the report have been built into this edition. Please do not hesitate to contact us atCPB@nasba.org with additional questions.2
FEEDBACKThe changes and improvements in this book are a direct result of the feedback received from the manyend users of this product. Although this edition has made significant strides over previous editions, weacknowledge that there is additional room for improvement. To get there, we need your feedback,both positive and negative. Please send any questions, comments and (most importantly) suggestionsto CPB@nasba.org.GENERAL DISCLAIMERS / LIMITED LIABILITYNotwithstanding any language to the contrary, nothing contained herein constitutes nor is intended toconstitute a promise of any kind. While reasonable efforts are made to ensure accurate and up-to-dateinformation in this Jurisdiction Performance Book, the data contained herein is for informationalpurposes only and is not represented to be error free. The National Association of State Boards ofAccountancy (NASBA) does not warrant that the information and materials in this handbook areadequate, accurate, current or complete, and, to the fullest extent permitted by applicable laws,expressly disclaims liability for any errors or omissions in the information and materials. No warrantyof any kind, implied, express or statutory, including fitness for a particular purpose, is given inconjunction with the information and materials contained within the Jurisdiction Performance Book. Inno event will NASBA or its directors, officers, agents, representatives, employees, or volunteers beliable for any damage to you or any other party for any losses or damage including, without limitation,incidental, exemplary or consequential damage arising from the use or inability to use the datacontained within the Jurisdiction Performance Book.NOTE ABOUT CONTRIBUTING EDITORSGreg Gaynor, PhD, CPA, is an assistant professor of accounting at the University of Baltimore. He earned a BA inEconomics at Dartmouth College and a PhD in Accounting at Florida State University. Consistent with his priorexperience in the securities industry, Professor Gaynor’s research interests include the capital markets andfinancial accounting as well as the CPA examination and licensure process. The University of Baltimore iscommitted to student success in the field of accounting and offers the following degrees: B.S.B.A. in Accounting,M.S. in Accounting and Business Advisory Services, M.S. in Taxation, and Graduate Certificates in AccountingFundamentals and Forensic Accounting.Professor Gaynor and the University of Baltimore wish to thank NASBA for generously supporting researchconcerning the CPA exam. By supplying data and analysis regarding candidate performance, NASBA helps bothschools and the accounting profession by assisting in the development of successful accounting graduates andfuture CPAs.Mark M. Ulrich, CPA teaches principles of financial and managerial accounting and serves as theDirector of the Center for Accounting Research and Technology for the Peter J. Tobin College ofBusiness at St. John’s University. His current research includes analyzing CPA exam pass rate data andaccounting education pedagogy. Professor Ulrich has three years of public accounting experience, and mostrecently served as the Director of Budgets and Compliance for the Tobin College of Business.3
Prior to joining St. John’s University, he was employed as a senior audit associate for KPMG.Professor Ulrich also serves on the state-wide Board of Directors of the New York State Society ofCertified Public Accountants (NYSSCPA), and is a past president of the Queens/Brooklyn Chapter of theNYSSCPA.The Department of Accounting and Taxation at the Peter J. Tobin College of Business, St. John’sUniversity offers undergraduate and graduate degrees in accounting, taxation, and enterprise risk management.St. John’s is dedicated to student success on the CPA exam and students are encouraged to finish the exam priorto graduating from the master’s program.St. John’s has benefitted greatly from the excellent work of NASBA, especially through the custom pass ratereports, which allow a university to look at pass rates in much greater detail than what is published in thecandidate performance books. St. John’s has also participated in data collaboration sessions with NASBA andother universities and hosted a data collaboration session as its Manhattan campus in July 2014. St. John’s andNASBA, along with Notre Dame University and the AACSB, also participated in a joint presentation regarding CPAexam data and using pass rate results to support assurance of learning for accreditation purposes at the AACSBannual accreditation conference inSeptember 2014.H. Fred Mittelstaedt, PhD, CPA, Deloitte Foundation Professor of Accountancy, Mendoza College of Business,University of Notre Dame; BS 1979, MS 1982, Illinois State University; Ph.D. 1987, University of IllinoisFred Mittelstaedt joined the University of Notre Dame faculty in 1992. He has served as the Department ofAccountancy chairman since 2007. Prior to coming to Notre Dame, he held a faculty appointment at ArizonaState University.Professor Mittelstaedt has taught financial reporting courses to undergraduates, masters in accountancystudents, MBAs, and Executive MBAs. While at Notre Dame, he has received the Kaneb Undergraduate TeachingAward and the Arnie Ludwig Executive MBA Outstanding Teacher Award. He is a coauthor on Financial Reporting& Analysis (6th Edition), a textbook used in graduate and undergraduate courses at numerous universities.His research focuses on financial reporting and retirement benefit issues and has been published in the Journalof Accounting and Economics, The Accounting Review, Review of Accounting Studies, and several otheraccounting and finance journals. He is a reviewer for numerous academic journals, and he has served on theEditorial Advisory and Review Board for The Accounting Review. In addition, he has testified on retiree healthbenefit issues before the U.S. House of Representatives Committee on Education and the Workforce.Professor Mittelstaedt is a past president of the Federation of Schools of Accountancy and currently serves onthe AACSB Accounting Accreditation Committee. He is a member of the American Accounting Association andthe American Institute of Certified Public Accountants. Prior to joining academia, he was an auditor with PriceWaterhouse & Co. and received an Elijah Watt Sells Award for exceptional performance on the Uniform CPAExam.4
Section DescriptionsThis section contains in-depth descriptions of the data in thispublication.5
shadanaverageageof29.0yearsatthe SeconDescrip on6
erinformaonwasavailablefor95.5%ofcandidatessi ntryofresidence.Tesngperformanceandpa rocess,represen ofseconsa scohortsonexaminaonseconsa ate.AgeatTimeofExaminaonThissecona ars,performanceontheexaminaondeclinedwithage(and mesincegraduaon)withthelargestdropoccurringa erthe2223yearagegroup.7SeconDescrip on
esngwindowof2014butfailedtopassall4seconsora ilethisisnotanabsolutedefinion,thegeneralassump doutsideofaJurisdicon’srequired conDescrip on8
AemptedThisarealooksatperformancebasedon mesincethefirstseconthatacandidatesa a ��rsta emptedseconwillbeaggregatedinthe eirfirstsecon.In2014approximately20%ofthea ocessmorethan2yearsbefore.Thesea nofthereportlooksatperformancebasedonlengthof onbetween12and18monthsa 13.9percentagepoints.9SeconDescrip on
entAccountsforthepre2012cohorts.Auding&A estaonFinancialAccoun ng&ReporngBusinessEnvironment&ConceptsSeconDescrip onRegulaon10
11
2014 Candidate Performance OverviewThis section contains summary data related to the overall 2014examination year.12
Jurisdiction Summary Statistics: All Testing WindowsSummary of examination data for each Jurisdiction with more than 5 .331.7District of 1853.9%73.330.4New Hampshire4,21510,1755,6574,51842.3%68.530.9New Jersey2,7866,8443,4573,38741.6%69.428.6New Mexico4331,10662847845.1%71.032.7New York10,12225,23614,21611,02049.0%71.727.5North ionAlabama13
Jurisdiction Summary Statistics: All Testing WindowsSummary of examination data for each Jurisdiction with more than 5 eScoreAverageAgeNorth ,42049.3%72.127.1Puerto Rico8651,95599795834.1%65.627.7Rhode Island15335022512544.9%70.427.6South Carolina5501,46691155557.0%74.228.4South .1%71.731.3West 929.9OhioPennsylvania14
Overall Performance2014 CPA .4%% PassAvg Score71.972.670.872.473.870.171.3Avg nce2014201320122011Cohort Year44,128FAR49,515BEC39,010AUD41,819Cohort Size TrendRE42,752Exam SectionFT41,066Exam TypeOverall20102009Age at Time of ExaminationMaleU.S.A.Int'l201420132012Other 2222-2324-2526-2728-2930-3435 421,24013,43410,28015,81516,674Sections 109,391 111,851 211,788Candidates .7%Avg 1.170.970.468.4Avg 929.032.242.1% PassPipeline: Cohort Activity, Attempts, Passing 4Cohort: Activity & Lost Credit2014201320126,82511,6713,5723,580Active 5367,6688,500Lost Cd08762,1892,317Pass 4InactiveFrom 1st Section: AttemptedFrom 1st Section: Pass 4 PartsSecs% Tot% PassScore 6 49,878107,45145.8%55.3%72.8 6 12 25,20439,26816.7%53.4%73.1 12 18 16,78626,27711.2%47.4%71.8 2413,3235.7%40.6%70.2 24 20,14048,12120.5%37.0%69.2Total c/Cd% Tot% Pass1,2985,3345,52723,7844.115.1%97.3%4.3021.5% 187,08493.0%35,1024.9627.6% .9%37.4%Total 25,648 24167,7036.54100%61.2%Cohort Performance: Section, Content Area, Skills Secs%PScoreCandSecs%PScoreOverall ,19747.6%70.146,44557,96149.4%71.32014 ,00053.2%70.920,56123,14454.3%72.12013 DUn EngUn EntPro EviEvl RptInfo SyStr PlaOp 53.9%FARFrm StdFin StaSpc TrnGov'tNFPSimREGEth Leg Bus LawFed TxTx ProTx IndTx 6.0%56.4%49.4%54.7%44.4%41.4%Acc Rev Pro ResBECSim15Crp Gov Eco Con Fin Mgt
Overall Performance2014 CPA Examination: First-Time ,81855.0%55.0%-49.8%65.1%52.5%53.1%Avg Score72.672.6-72.775.670.671.7Avg Age28.028.0-27.927.928.028.0% PassGender*FemaleResidence2014201320122011Cohort Year44,128FAR49,515BEC39,010AUD41,819Cohort Size TrendRE42,752Exam SectionFT41,066Exam TypeOverall20102009Age at Time of ExaminationMaleU.S.A.Int'l201420132012Other 2222-2324-2526-2728-2930-3435 Candidates 19,86515,2258,7156,49510,26410,665Sections .7%48.5%43.2%Avg 1.171.070.368.0Avg 929.032.242.0% PassPipeline: Cohort Activity, Attempts, Passing 4Cohort: Activity & Lost Credit201420132012OtherPass 4----Active----From 1st Section: AttemptedCandFrom 1st Section: Pass 4 PartsSecs% Tot% PassScore 6 47,96396,75671.0%56.3%72.8 6 12 16,53220,85615.3%59.5%74.2 12CandSecsSec/Cd% Tot% 00.0%Inactive---- 188,0389,3186.8%51.6%72.3 183,50214,0084.0033.8%100.0%Drop---- 242,6853,0282.2%38.9%68.4 241,1694,6764.0011.3%100.0%Lost Cd---- 245,198 24253Total 67,8496,3214.6%33.2%66.3136,279100%55.0%72.6Total t Performance: Section, Content Area, Skills Secs%PScoreCandSecs%PScoreOverall ,65752.5%70.632,81832,81853.1%71.72014 .71,3911,39131.8%66.1AUDUn EngUn EntPro EviEvl RptInfo SyStr PlaOp 9.9%66.2%66.8%75.8%Acc Rev Pro ResBECSimCrp Gov Eco Con Fin ther50.5%53.6%44.4%59.0%42.2%48.7%49.8%FARFrm StdFin StaSpc TrnGov'tNFPSimREGEth Leg Bus LawFed TxTx ProTx IndTx 4.8%55.1%42.1%48.3%39.5%37.3%16
17
2014 Jurisdiction Performance:Overall and First-Time SectionsThis section contains data of candidate performance for eachjurisdiction. The jurisdictions independently provide data toNASBA, which may occasionally result in incompleteinformation.18
Alabama2014 CPA Examination: All Test 50.5%% PassAvg Score70.770.371.172.070.868.571.5Avg ctionsResidence2014201320122011Cohort Year256FAR262BEC169AUD167Cohort Size TrendRE140Exam SectionFT142Exam TypeOverall20102009Age at Time of ExaminationFemaleMaleU.S.A.Int'l201420132012Other 2222-2324-2526-2728-2930-3435 %44.1%45.6%0.0%52.3%41.0%49.2%58.3%45.9%41.7%Avg .173.870.169.5Avg 28.932.343.5% PassPipeline: Cohort Activity, Attempts, Passing 4Cohort: Activity & Lost Credit201420132012From 1st Section: AttemptedOtherCandSecs% Tot% PassFrom 1st Section: Pass 4 PartsScoreCandSecsSec/Cd% Tot% PassPass 415401916 617736447.8%45.6%69.5 63124.003.3%100.0%Active118452261 128414222.7%53.5%73.8 1212554.5813.3%87.3%Inactive930728 18588915.7%49.4%72.5 18261315.0428.9%79.4%Drop0123143 2431428.4%38.1%73.0 2414866.1415.6%65.1%Lost Cd021217 2411725131.6%45.4%69.6 l906437.14100%56.0%Cohort Performance: Section, Content Area, Skills %69.2444857.6%72.7AUDUn EngUn EntPro EviEvl RptInfo SyStr PlaOp 63.4%FARFrm StdFin StaSpc TrnGov'tNFPSimREGEth Leg Bus LawFed TxTx ProTx IndTx 2.1%61.8%54.5%73.6%54.7%60.0%Acc Rev Pro ResBECSim19Crp Gov Eco Con Fin Mgt
Alabama2014 CPA Examination: First-Time 478-11812712311047.9%47.9%-44.9%50.4%47.2%49.1%Avg Score70.370.3-71.471.467.770.7Avg Age30.630.6-31.030.230.630.7% PassGe
In 2016 the data will be presented in two books. The Jurisdiction Edition, designed specifically with the State Boards in mind, will provide a broad view of the CPA Exam trends from around the world. The University Edition focuses on university and accreditation report

