Transcription
J. Biol. Chem. Chron. 2019, 5(1), 76-84ISSN (Print): 2454 – 7468ISSN (Online): 2454 - 7476www.eresearchco.com/jbcc/Development of a High Performance Liquid Chromatography Method forthe Determination of Related Substances in a Liposomal Nano Pharmaceutical Using Quality by Design ApproachS. N. Deshpande1, M. Farooqui2, G. Sanap1 and D. D. Kayande1*12S. B. E. S. College of Science, Aurangabad, Maharashtra - 431001, INDIADr. Rafiq Zakaria College for Women, Aurangabad, Maharashtra - 431004, INDIA*Correspondence: E-mail: drkayande@gmail.comDOI: ceived 16 Feb, 2019; Accepted 01 Apr, 2019; Published 11 Apr, 2019)ABSTRACT: This study presents the development of gradient reverse phase high performance liquid chromatographic method for the determination of Doxorubicin hydrochloride and its five impurities following Quality byDesign (QbD) approach and also to identify the conditions where adequate separation quality in minimal analysisduration could be achieved within a robust region that guarantees the stability of method performance. The relationship between critical process parameters and critical quality attributes is created applying Design of Experiments methodology. The defined mathematical models and central composite design are used to evaluate the risk ofuncertainty in models prediction and concerns in adjusting the process parameters and to identify the design space.Moreover, Box-Behnkan design is applied for experimental robustness testing and method is partially validated toverify the adequacy of selected optimal conditions. The analytical column Waters X-bridge C18 (250 mm x 4.6 mm,5µm particle size); mobile phase A consisted of buffer (100 mM Sodium dodecyl sulphate and 22mM of Orthophosphoric acid , pH adjusted to 2.5 with 1 M sodium hydroxide solution), acetonitrile and methanol (60:30:10)v/v/v; mobile phase B consisted of Buffer, acetonitrile and methanol (30:60:10),column temperature 40ºC, mobilephase flow rate 1 mL min-1, wavelength of detection 254 nm.Keywords: Quality by Design; Design space; Doxorubicin related substances and RP-HPLC.INTRODUCTION: Recently trends in pharmaceutical industry and numerous regulatory documents inthe pharmaceutical fields like (Food and Drug Administration’s (FDA) Good Manufacturing Practice for21st Century,1 International Conference of Harmonization (ICH) Q8 (R2), strongly suggest the implementation of Quality by Design (QbD) concept in pharmaceutical product development and consequently, inanalytical method development. QbD is defined as “asystematic approach to development that begins withpredefined objectives and emphasizes product andprocess understanding and process control, based onsound science and quality risk management”.2 Chemometrical tools such as Design of experiments(DoE) methodology are closely related to QbD andmany basic concepts are very similar.3 &4 ThereforeDoE methodology combined with methodologies foridentification of design space provides deep understanding of analytical systems and enable the identification of experimental region where the quality willbe assured. Since gradient reverse phase liquid chro-matography (RP-LC) is the most commonly appliedseparation technique in pharmaceutical industry forimpurities determination, the QbD concept is studiedin LC systems by groups of authors such as Hubert atal.,3- 6Molnar at al.,7-8 Orlandini at al.,4, 9-10 However,the literature examination revealed that there are veryless papers dealing with risk management and designspace in analytical method development in recentyears.11QbD is a dynamic approach that has gainedoutstanding importance in various pharmaceuticalfields.12-13 As mentioned in the International Conference of Harmonization (ICH) Guidelines Q8 (R2) forpharmaceutical development ‘It is important to recognize that quality cannot be tested into the products; i.e.quality should be built in by design’. Designing theproduct with infusion of quality helps the product topride over all odds during its lifecycle. As QbD is auniversal approach, it has been successfully extendedfor the development of analytical method and can betermed as Analytical QbD (AQbD).14-17One of the keyelements of QbD is DoE. DoE is a structured, orga-J. Biol. Chem. Chron. 2019, 5(1), 76-8476
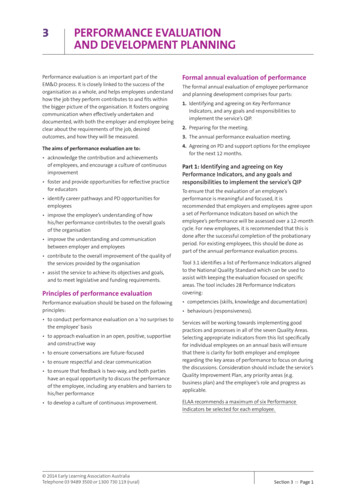
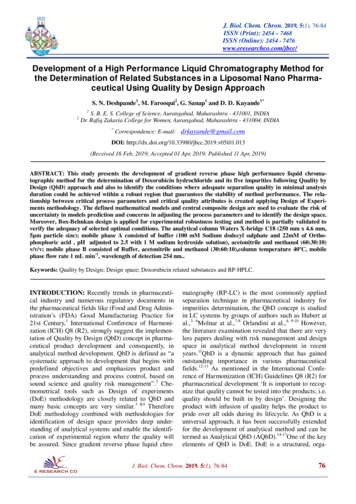
[Development of a High Performance Liquid Chromatography Method for the Determination of Rela ]nized method for determining the relationship between factors affecting a process and the output of thatprocess. DoE is superior to OFAT (one factor at atime) owing to its ability to predict interactive effectsof parameters on performance of the method. Thereare many benefits to developing analytical methods inan AQbD (Analytical quality by design) framework.Methods will be built upon the understanding of themeasurement and performance requirements. Theresultant method development knowledge, methodrobustness and transferability will result in more robust methods with fewer method failures and transferissues The AQbD work flow starts with understandingthe method needs specified in the Analytical TargetProfile (ATP), followed by selection of the initialchromatographic parameters and refinement of theseconditions, risk assessments to identify and DoEs tomitigate experimental risk factors18.The end result isthe robust analytical method with a well understooddesign space and method optima. Ideally, for selectionof the initial chromatographic parameters, screeningdesigns should be employed. The knowledge obtainedfrom this development data was utilized to fix some ofthe factors at certain level and to identify the criticalfactors for further evaluation through DoE As mentioned earlier, DoE is of unconditional importance inQbD. Designs are available for screening variables oroptimization of variables. Response surface methodology is widely used for optimization purpose. Theresponses obtained from the DoE experiments arestatistically analyzed to provide the model relationshipbetween the responses and the independent variables.Based on this model, the best operating conditions aredetermined as a part of the design space. Further,NOR (normal operating range) is identified to establish the robustness of the method. Often, Monte Carlosimulations are used as a powerful tool to deriveand/or improve process capability by moving into aregion of the design space which is more robust toprocess input variables 19-22.Since certain number of drugs and their impurities arepolar, RP-HPLC chromatography can represent a valuable for their chromatographic separation and determination. In X-bridge columns stable chromatographic sorbent is available and are sustainable at high temperature and pH. Consequently, retention behavior andthe selectivity of the chosen analytics on the selectedcolumn are very often under strong influence of thefactors related to the mobile phase composition.Therefore, this fact can be considered an advantagewhen the aim of the research is the optimization ofchromatographic separation of the analytical mixture.The incorporation of QbD strategy in related sub-stance method development is very important therefore the aim of this study was to present the QbD method development of related substance method for thedetermination of mixture consisted of Doxorubicinand its related known and unknown impurities. USPmonograph of Doxorubicin suggests gradient UPLCmethod for the quantification of Doxorubicin and itsrelated compounds in pharmaceutical dosage forms 23.Analytical methods are not available in literature forthe determination of related substances and degradation products of Doxorubicin (fig. 1), to the best ofour knowledge there is no published method for related substances Therefore, to analyze the liposomalnano pharmaceutical formulation product an analyticalmethod needs to be developed. These methods werepracticed during routine experimentation of the development laboratory batches of liposomal Nano pharmaceutical.Figure 1: Structure of Doxorubicin.MATERIALS AND METHODS: All the relatedimpurities and Doxorubicin hydrochloride drug substance is gifted by the precise chromatography privatelimited. Sodium dodecyl sulphate was purchased fromSIGMA-ALDRICH. Acetonitrile and Methanol werepurchased from Merck. Purified water was obtainedfrom Milli-Q water system (Millipore Corp). Sodiumhydroxide and 36% Hydrochloric acid was purchasedfrom Merck. Hydrogen peroxide (30%) was purchased from Merck. All chemicals were used as suchand provided by manufacturer, no further purificationhas been done. All the other chemicals were of analytical grade. Magnetic stirrer, cyclomixer, micro centrifuge bought from Eppendorf Equipment’s Pvt. Ltd.was used. HPLC from Waters, used in the analysis ofdrug. A bath sonicator from PCI Analytics brand wasused.Chromatographic system and condition: The HPLCsystem consists of a waters 2696 model, includingquaternary pump, auto-sampler with thermostat, column oven, coupled with a multiple wavelength ordiode array UV detector. Waters X-bridge C18(4.6mm 250mm, 5µm) column for method development. The Empower chromatographic Software wasJ. Biol. Chem. Chron. 2019, 5(1), 76-8477
[Development of a High Performance Liquid Chromatography Method for the Determination of Rela ]used for data acquisition and processing. Throughoutthe whole experimental procedure the following instrumental chromatographic conditions were maintained: flow rate of the mobile phase 1 mL min-1, column temperature 40 C, UV detection at 254 nm andinjection volume 20µL.orubicin and spiked with related substances in concentration of 4μg mL–1. Real samples testing was performed using Lipodox diluted in methanol to obtainthe working solutions theoretically containing 400 μgmL–1 of Doxorubicin. This procedure was repeated sixtimes.Buffer, Mobile phase and solvent mixture: Mobilephase consisted of acetonitrile, methanol and waterphase (with added sodium dodecyl sulphate and orthophosphoric acid) where the amount of organic solvent,sodium dodecyl sulphate concentration in the aqueousphase and pH of the aqueous phase were varied according to the experimental plan. Mobile phase underoptimal chromatographic conditions was as follows,Control Sample solution preparation: Transfer content of vial in a dry test tube. Pipette out 2 mL ofDoxorubicin Hydrochloride liposomal sample (2mg/mL) into a clean and dry 10 mL volumetric flask,added 4 mL of methanol and sonicate for 3 minutes,further dilute to the mark with methanol.The mobile phase A having pH of 2.5 adjusted with 1M sodium hydroxide solution, prepared by dissolving100mM Sodium dodecyl sulphate and 22mM Ophosphoric acid in water, acetonitrile, methanol addedin the ratio of (60:30:10) v/v/v. Similarly mobilephase B consist of buffer, acetonitrile and methanol inthe ratio of (30:60:10) v/v/v.Binary solvent gradient was applied at flow rate of 1.0mL min-1 and programmed as follows: 100% mobilephase A and 0% mobile phase B at 0 min, progressinglinearly at 90 % mobile phase A and 10 % mobilephase B at 20 min, followed by the decrease in themobile phase A to 40% and rise in mobile phase B to60 % at 40 min. Subsequently, the gradient was keptconstant till 45 min, finally returning to the initialgradient and flow at 50 min and maintained at thiscomposition and flow for 5 min in the total time of 55min of analysis.Standard solution mixture: Stock solutions for themethod optimization and robustness testing contained400 μg mL-1 of doxorubicin, and 4μg mL-1 of all therelated impurities in the methanol. Place mixture forselectivity estimation was prepared in a concentrationratio corresponding to the content in the liposomalNano pharmaceutical. A standard solution, containing400 μg mL–1 of Doxorubicin and 4μg mL–1 of eachrelated substances was utilized to prove the selectivity.Seven solutions containing Doxorubicin (100–800 μgmL–1) and its related compounds (0.5–8.0μg mL–1)were prepared in the methanol for linearity estimation.The accuracy estimation is performed using threeseries of three solutions containing placebo, Doxorubicin in concentrations 400 μg mL–1 and its relatedsubstances in concentrations 2.0μg mL–1, 4.0μg mL–1and 6.0μg mL–1. The precision estimation was performed on real samples using commercially availableLipodox containing 2 mg of Doxorubicin per mL. Thesample was diluted to contain 400 μg mL–1 of Dox-Spike Sample solution preparation: Transfer content of vial in a dry test tube. Pipette out 2 mL ofDoxorubicin HCl liposomal sample (2 mg/mL) into aclean and dry 10 mL volumetric flask, added 4 mL ofmethanol and sonicate for 3 minutes, further addedeach known impurity to the flask to obtain4μg mL–1ofimpurity solution in the same flask and dilute to themark with methanol.Analytical target profile, critical quality attributes,risk identification, risk evaluation and statisticaldata analysis: First objective of this work was thethorough investigation of chromatographic behaviorof analyzed substances. Selectivity is the chief motivein this case and hence the first set of CQAs on retention factor and resolution between the peaks. Thesecond objective of the study was the development ofmethod for the determination of Doxorubicin and itsimpurities where the maximal separation of substances in minimal analysis duration will be achieved.Moreover, in accordance with QbD principles, theoptimal conditions should be surrounded with designspace in order to provide adequate robustness of themethod. As given in the USP Stimuli article the concept of an ATP parallels the concept of Quality TargetProduct Profile described and defined in ICH Q8. TheATP defines the objective of the analytical methodand the quality requirements 24. On the basis of scientific rationale and the development data, the factorsthat act maximum risk to resolution were consideredas critical during risk identification. Thus, temperatureof column, mobile phase organic composition (to varythe gradient slope) and buffer pH were selected ascritical Variables/factors. The risk was evaluatedthrough statistically designed experiments generatedthrough Design expert 9.0.6.2 software (Stat EaseInc., Minneapolis, USA). Initially, a full factorialdesign was employed, but due to the presence of curvature the design was boost to central composite design(CCD) to better understand the surface. Graphicaltools such as half-normal probability plot, pareto chartJ. Biol. Chem. Chron. 2019, 5(1), 76-8478
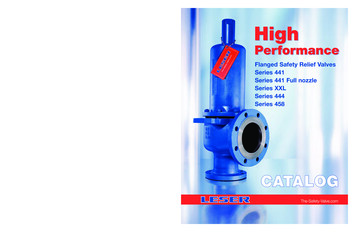
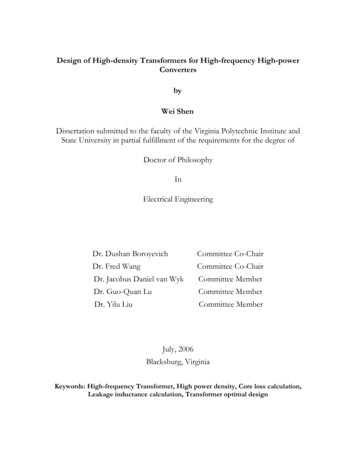
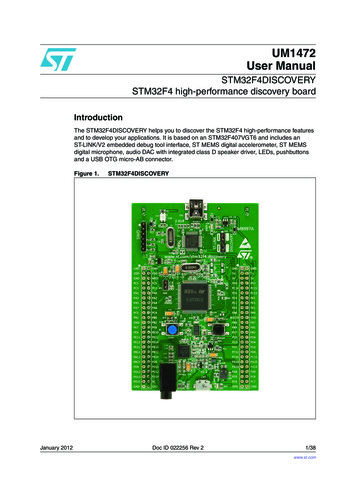
[Development of a High Performance Liquid Chromatography Method for the Determination of Rela ]etc. were used to help assess which factor is highlyimportant and which is comparatively unimportant.Diagnostic tools such as normal plots, residual versespredicted plots were used to evaluate the data. Theright graphs, plots or visual displays of a dataset canuncover anomalies or provide insights that go beyondwhat most quantitative techniques are capable of discovering. Further, the relationship between the variables and the responses was estimated through regression. Analysis of variance (ANOVA) was used toassess the importance of one or more factors by comparing the response variable means at the differentfactor levels. The model, F-value, p-value, Lack of Fit(LoF), the R- squared values etc. revealed significanceand predictability of the established model. Modelgraphs were used to understand the interaction between the factors and their relationship with the responses.Design space and optimum condition establishment: Design space has been established by overlaying contours of all responses each having a predefinedacceptance criterion. The objective of design space isto present a region where the method will be fit forpurpose. However, since the design space is based onprediction, experimental verification was performed atrandom conditions within the design space to provethe agreement between the predicted and observedvalues. The optimum condition for each factor withinthe design space was identified and with the help ofMonte Carlo Simulation and process capability thenormal operating range was established.Sensitivity of analysis and robustness study: Evenafter the establishment of design space it is necessaryto demonstrate the robustness of the method given thepossibility of variation in the method parametersabout their standard deviation. The robustness at theoptimum condition was demonstrated here by generating large amount of data with the help of Monte Carlesimulation and deriving the measure of capabilityanalysis i.e. Cpk values for responses. The analyticalmethod robustness is strongly dependent on the sensitivity of method parameters. Hence, to find the mostsensitive parameter per response, sensitivity analysiswas performed using Monte Carlo simulation and thesensitivity plots were drawn using Devize software(Minitab, USA). Also, as the Cpk values are largelydependent on the standard deviation of the methodvariables, special attention was given to the most sensitive method variables.The capability analysis provides a better understanding of how much variability in the output can be expected at the normal operating conditions. Finally, theoptimum values and corresponding standard deviations of the factors producing data with acceptableCpk values were utilized for the establishment of thenormal operating range.RESULTS AND DISCUSSION: This study presented the usefulness of QbD approach implementation in analytical method for related substance, theimportance of this strategy in modern pharmaceuticalanalysis is emphasized and each step of QbD processis described in details. The definition of critical quality attributes and critical process parameters is explained. Special attention is devoted to DoE methodology application for creation of reliable mathematical models for knowledge space examination. Theverification of the design space, multivariate experimental robustness testing and validation confirmedthat systematic building of quality leads to the creation of highly reliable chromatographic methods.A single, selective, and robust analytical method forthe determination of related impurities in a complexliposomal Nano pharmaceutical drug product has beendeveloped using QbD principles. About all known andunknown peaks are well separated by this methodobserved in force degraded samples. DoE was used toestablish the relationship between the critical responseand method variables. It also helped to create the design space where the global optima exist. pH plays themost critical role on the retention time of unknownimpurity observed at RRT 0.96 and the resolutionbetween two known impurity observed at RRT about1.06. Methanol was added and gradient program wasintroduced to resolve the pH sensitivity issue. To establish the normal operating range, the application ofMonte Carlo simulation for propagation of modeluncertainty is used for creation of design space androbustness was evaluated within the normal operatingrange and at the edge of the design space. Finally, thismethod as reduced analysis time, resources, and solvent consumption in comparison also this method iscost effective compare to other related substance methods of analysis.Identification of critical attributes and variables:The drug matrix was chromatographed on RP-HPLCsystem by adopting the tentative method developedthrough OFAT approach. The resulting chromatogramshown in (fig. 2), exhibits one API peaks, five relatedimpurities amongst which reproducible and good resolution is desired and chromatogram shown in(fig.3),exhibit placebo peak.The attributes from analytical target profile identifiedas critical are given below (fig. 4):J. Biol. Chem. Chron. 2019, 5(1), 76-8479
[Development of a High Performance Liquid Chromatography Method for the Determination of Rela ]1. Retention time of the unknown impurities observed at relative retention time about 0.88.2. Retention time of the related impurities observed atrelative retention time about 1.19.3. Resolution between two known impurities observed at relative retention time about 1.04.4. Resolution between closely eluting impurities observed at the fronting of main peak Doxorubicinabout relative retention time 0.96.5. Retention time of the unknown impurity observedat relative retention time about 2.09.Figure 4: Trial Chromatogram before decidinganalytical target profile.Hence, the QbD approach was adopted with an intentionof solving these issues and attaining a robust methodwith the help of DoE. Next, the listing of criticalattributes was followed by identification of the variablesusing Fishbone diagram (fig. 5) as a risk assessment tool.Figure 2: Chromatogram obtained though tentative method.Figure 5: Fishbone Diagram for DOE trial.Figure 3: Chromatogram of placebo.Of these 5 attributes, two were highly critical, the firstwas the retention time for unknown impurities and thesecond was the resolution between known impurity theretention time was found to be unstable, during randomOFAT trials this impurity was observed to be co-elutingwith the Doxorubicin main peak and one of the knownimpurity observed at RRT 0.96 and 1.08 respectively. Itcauses interference in the determination of the knownimpurity. Both the above mentioned criticalities wereunresolved during the development of the methodthrough conventional approach.Since, it is not feasible to experimentally investigateeach variable; the inspection of the critical variables isessential which demands rigorous brain storming. Thus,on the basis of the development data paired with scientific rationale and previous experience, the incidental factors were neglected and the factors posing maximum risk(temperature, mobile phase composition, and buffer pH)were chosen as critical. The high and low levels for thecritical factors were finalized for experimentation.Design of Experiment: A 23 full factorial design wasadopted to evaluate the three independent variablesbuffer pH, MP composition (for varying the gradientslope) and temperature. Each variable was investigated at two levels: low and high along with the centerpoints as given in (Table 1).J. Biol. Chem. Chron. 2019, 5(1), 76-8480
[Development of a High Performance Liquid Chromatography Method for the Determination of Rela ]Table 1: Critical factors identified and their rangesfor DOE run.Critical FactorsBuffer pHTemperature( C)Low2.025Centre2.540High3.060Mobile phasecomposition (%)51020Total eleven experiments were performed includingeight factorial and three center points. The centerpoint experiments illustrate curvature if present, andreplicates serve in demonstrating system suitability.The runs were randomized to avoid systematic error25.Factorial design points and the resulting datasetgives the Supplementary data. Responses were analyzed statistically by using Design expert software.The multivariate analysis proves that all the threevariables studied through DoE are significant and theregression analysis provides evidence for their contribution in variation in the responses. From the maineffects plots as well as from the information given in(Table 2), it can be realized that most of the responsesdisplays curvature effects, i.e. the Centre point data isnot in line with the high and the low values, hintingthe existence of a non-linear relationship between thefactors and the response.Table 2: Normal operating range within the designspace for robust chromatographic separation.FactorpHColumn TemperatureMethanol OrganiccompositionAcetonitrile organiccompositionOptimum2.5(40 )Low2.0(35 )High3.0(45 )10%9%11%10%27%33%The data indicate that pH is the most important factorin maximum number of cases followed by temperature and mobile phase composition, curvature contribution is as high as 50% in a couple of cases[Resolution between an unknown impurity andDoxorubicin peak observed at RRT 0.96 and resolution between two known Impurities observed at RRT1.08]. Though the full factorial design offered somevaluable information, incorporation of a responsesurface design was necessary to model the designspace adequately. To serve the purpose additionalaxial points were studied through CCD (α 1.47),with wider range of responses to get more informationalong with two additional Centre points. The completeCCD design (factorial, Centre and axial points) alongwith the responses is gives the Supplementary data.Establishment of design space: As mentioned in theICH guideline Q8 (R2) for Pharmaceutical Development, design space is the multidimensional combination and interaction of input variables. Any set pointwithin the (regulatory approved) design space willproduce acceptable product and changes within thedesign space are (regulatory) acceptable. The designspace is the integral and conclusive part of any studythrough the QbD approach. But, due to the completelydistant pH requirements for the two responses discussed earlier (retention time for unknown impurityabout RRT 0.96 and resolution between two knownimpurities at RRT about 1.06) establishment of designspace is challenging. An alternative approach wasadopted to establish the design space by ignoringthese two pH dependent responses one at a time. Exhibit the design space neglecting the retention time ofunknown impurity at about RRT 0.96 and the designspace neglecting the resolution two known impuritiesat RRT about 1.06, respectively. However, to authenticate the predictions, it’s important to verify the designspaces experimentally. For the design space verification, experimentation was performed at one point ineach of the design spaces. The mobile phase composition was fixed to an optimum percentage. For verification of the design space obtained by excluding resolution between two known impurities; the pH value atthe Centre i.e. 2.5 was selected. Similarly, for the verification of the design space obtained by excludingretention time for unknown peak the Centre pH valuei.e.2.5 was chosen. In both the conditions the columnoven temperature was set at the temperature (35 2 C). Thus, the two experimental conditions were i)pH: 2.0, Temperature: 35 C, % organic in mobilephase B: 30 and ii) pH: 3.0, Temperature: 35 C, %organic in mobile phase B: 30. The results indicatethat all the responses are within the prediction interval(PI) and close to the 95% confidence interval (CI).The small difference between the predicted and observed values can be attributed to the fact that duringthe DoE experimentation, the critical factors e.g. pHwere not strictly controlled and were allowed to bewithin their natural variability. But, during the robustness study it was observed that few responses wereimpacted by the small change within the natural variation of the factors. Therefore, it is quite possible thatminor variations in the sensitive factors during DoEhave most likely contributed to this variation. Oncethe method is optimized, stringent controls on variables are required as a control strategy.CONCLUSION:Final optimization of chromatographic condition:From the above discussion it is clearly evident that itJ. Biol. Chem. Chron. 2019, 5(1), 76-8481
[Development of a High Performance Liquid Chromatography Method for the Determination of Rela ]was not possible to achieve both the responses withinthe specified acceptance criteria on the same methodusing a single buffer pH. To resolve this issue thegradient program was modified by changing the mobile phase B and gradient from buffer, acetonitrile tobuffer pH 2.5,acetonitrile and methanol, thus the mobile phase is now comprised of three mobile phasecomponents viz. buffer pH 2.5,Acetonitrile and methanol. The gradient was reconstructed to introducemethanol at the middle so that it governed the retention of unknown peak. After a few minutes, the gradient was linear to control the resolution betweenknown peaks observed at RRT 1.08. This finalizedgradient was experimentally evaluated and slightchanges were made in the factors for the better separation of the minor peaks. These changes were withinthe boundary of the design space. The modificationsgiven in (Table 3) consisted of revision of optimumtemperature to 40 C the modified gradient program isthe optimized analytical methodology is finalized byperforming validation parameters as per ICH guideline26 mentioned in (Table 4).Table 3: Final gradient program for the analysisof impurity 01.0% Mobilephase A100.0100.090.040.040.0100.0100.0how robust is the output response due to method inputvariables, pH, temperature, and mobile phase composition Even with the best controls in place, it becomesimportant to study the effect of process input variations on the output. It was observed that the probability of failure for retention time of unknown peak at theedge of the design space, under the experimental conditions pH 2.0, temperature 35 C, and organic composition in mobile phase B 10% is 61% and for difference in retention time of two known peak at RRTabout 1.08 at pH 3.0, Temperature 35 C, and organiccomposition in mobile phase B 10%is 50% Thismakes it clear that at the edge of the design space theassurance of quality, for the retention time of unknown peak observed at RRT 0.96 and the differencein retention time of two known impurities is only 39%and 50%, respectively. Thus, robustness study and theidentification of the robust region called as normaloperating range within the design space becomes crucial to gain assurance in quality within the randomvariation of the method parameters. To assess thisrobustness, Monte Carlosimulation was performed atthe optimum condition. Based on the sensitivity analysis the retention time of Doxorubicin impurity wasfound to be highly pH sensitive (fig. 6).% Mobilephase B0.00.010.060.060.00.00.0Table 4: Summary of partial validation and Systemsuitability parameters.Parameter (Units)Linearity range(µg/ml)Observed CorrelationcoefficientLOD (μg/ml)LOQ (μg/ml)Range of Recovery(%)System Precision(% RSD)Method Precision(% RSD)RobustnessResolutionDoxorub
[Development of a High Performance Liquid Chromatography Method for the Determination of Rela ] J. Biol. Chem. Chron. 2019, 5(1), 76-84 77 nized method for determining the relations