Transcription
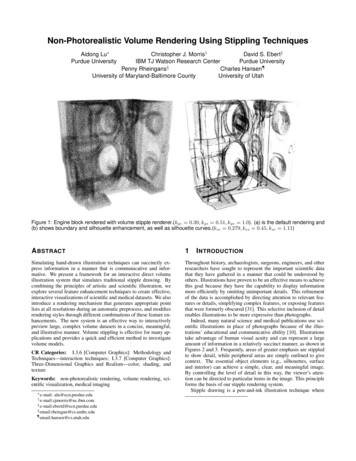
Non-Photorealistic Volume Rendering Using Stippling TechniquesAidong Lu Purdue UniversityChristopher J. Morris†David S. Ebert‡IBM TJ Watson Research CenterPurdue UniversityPenny Rheingans§Charles Hansen¶University of Maryland-Baltimore CountyUniversity of UtahFigure 1: Engine block rendered with volume stipple renderer.(kgc 0.39, kgs 0.51, kge 1.0). (a) is the default rendering and(b) shows boundary and silhouette enhancement, as well as silhouette curves.(ksc 0.279, kss 0.45, kse 1.11)A BSTRACT1Simulating hand-drawn illustration techniques can succinctly express information in a manner that is communicative and informative. We present a framework for an interactive direct volumeillustration system that simulates traditional stipple drawing. Bycombining the principles of artistic and scientific illustration, weexplore several feature enhancement techniques to create effective,interactive visualizations of scientific and medical datasets. We alsointroduce a rendering mechanism that generates appropriate pointlists at all resolutions during an automatic preprocess, and modifiesrendering styles through different combinations of these feature enhancements. The new system is an effective way to interactivelypreview large, complex volume datasets in a concise, meaningful,and illustrative manner. Volume stippling is effective for many applications and provides a quick and efficient method to investigatevolume models.Throughout history, archaeologists, surgeons, engineers, and otherresearchers have sought to represent the important scientific datathat they have gathered in a manner that could be understood byothers. Illustrations have proven to be an effective means to achievethis goal because they have the capability to display informationmore efficiently by omitting unimportant details. This refinementof the data is accomplished by directing attention to relevant features or details, simplifying complex features, or exposing featuresthat were formerly obscured [31]. This selective inclusion of detailenables illustrations to be more expressive than photographs.Indeed, many natural science and medical publications use scientific illustrations in place of photographs because of the illustrations’ educational and communicative ability [10]. Illustrationstake advantage of human visual acuity and can represent a largeamount of information in a relatively succinct manner, as shown inFigures 2 and 3. Frequently, areas of greater emphasis are stippledto show detail, while peripheral areas are simply outlined to givecontext. The essential object elements (e.g., silhouettes, surfaceand interior) can achieve a simple, clear, and meaningful image.By controlling the level of detail in this way, the viewer’s attention can be directed to particular items in the image. This principleforms the basis of our stipple rendering system.Stipple drawing is a pen-and-ink illustration technique whereCR Categories: I.3.6 [Computer Graphics]: Methodology andTechniques—interaction techniques; I.3.7 [Computer Graphics]:Three-Dimensional Graphics and Realism—color, shading, andtextureKeywords: non-photorealistic rendering, volume rendering, scientific visualization, medical imaging e-mail:alu@ecn.purdue.edu† e-mail:cjmorris@us.ibm.com‡ e-mail:ebertd@ecn.purdue.edu§ email:rheingan@cs.umbc.edu¶ email:hansen@cs.utah.eduI NTRODUCTION
Figure 3: Cicadidae stipple drawing by Gerald P. Hodge [10].Figure 2: Idol stipple drawing by George Robert Lewis [10].dots are deliberately placed on a surface of contrasting color to obtain subtle shifts in value. Traditional stipple drawing is a timeconsuming technique. However, points have many attractive features in computer-generated images. Points are the minimum element of all objects and have connatural features that make themsuitable for various rendering situations, no matter whether surface or volume, concrete or implicit. Furthermore, points are thesimplest and quickest element to render. By mimicking traditionalstipple drawing, we can interactively visualize modestly sized simulations. When initially exploring an unknown volume dataset, thissystem provides an effective means to preview this data and highlight areas of interest in an illustrative fashion. The system createsartistic rendering effects and enhances the general understandingof complex structures. Once these structures are identified, the usermay choose another volume rendering technique to generate a moredetailed image of these structures. It is the use of non-photorealisticrendering (NPR) techniques that provides the stipple volume renderer with its interactivity and illustrative expressiveness. We referto this type of NPR technique as illustrative rendering.NPR is a powerful tool for making comprehensible, yet simple images of complicated objects. Over the past decade, thefield of NPR has developed numerous techniques to incorporateartistic effects into the rendering process [8, 27]. Various approaches have been used, including pen-and-ink illustration, silhouette edges, and stroke textures. Most of the research in thefield of non-photorealistic illustration has concentrated on strokes,crosshatching, and pen and ink techniques [9, 14, 26] and most ofthe current research still concentrates on surface renderings, whichrequires surface geometry. We chose to directly render volumedatasets without any additional analysis of object or structure relationships within the volume. Volume stippling not only maintainsall the advantages of NPR, but it also makes interactive renderingand illustration feasible on useful-sized datasets because of two attributes of points: fast rendering speed and innate simplicity.In our system, the volume resolution is initially adjusted for optimum stipple pattern rendering, and point lists are generated corresponding to the gradient magnitude and direction. Next, a rendering mechanism is introduced that incorporates several feature enhancements for scientific illustration. These enhancements includea new method for silhouette curve generation, varying point sizes,and stipple resolution adjustments based on distance, transparency,and lighting effects. By combining these feature enhancements,datasets can be rendered in different illustration styles.2R ELATED W ORKNon-photorealistic rendering has been an active area of research,with most of the work concentrating on generating images in various traditional styles. The most common techniques are sketching [30], pen-and-ink illustration [6, 23, 24, 31],silhouette rendering [14, 19, 21, 25], and painterly rendering [1, 4]. Pen-and-ink rendering uses combinations of strokes (i.e. eyelashing and crosshatching) to create textures and shading within the image.Lines, curves, and strokes are the most popular among existingNPR techniques. Praun et al. [20] presented a real-time system forrendering of hatching strokes over arbitrary surfaces by buildinga lapped texture parameterization where the overlapping patchesalign to a curvature-based direction field. Ostromoukhov [17] illustrated some basic techniques for digital facial engraving by aset of black/white and color engravings, showing different featuresimitating traditional copperplate engraving. Hertzmann et al. [9]presented a method for creating an image with a hand painted appearance from a photograph and an approach to designing stylesof illustration. They demonstrated a technique for painting withlong, curved brush strokes, aligned to the normals of image gradients, to explore the expressive quality of complex brush stokes.Winkenbach and Salesin [32] presented algorithms and techniquesfor rendering parametric free-form surfaces in pen and ink.Deussen et al. [5] used points for computer generated pen-andink illustrations in simulating the traditional stipple drawing style.Their method is to first render polygonal models into a continuoustone image and then convert these target images into a stipple representation. They can illustrate complex surfaces very vividly, buttheir method is for surface rendering, not volumes, and is too slowfor interactive rendering.NPR techniques have only recently been applied to the visualization of three-dimensional (volume) data. Interrante developeda technique for using three-dimensional line integral convolution(LIC) using principal direction and curvature to effectively illustratesurfaces within a volume model [12]. Treavett and Chen also used
illustration techniques to render surfaces within volumes [28, 29].In both cases the results were compelling, but the techniques aresurface-based visualization techniques, rather than direct volumerendering techniques that can show not only surfaces, but also important details of the entire volume.Several NPR techniques have recently been applied to volumerendering. Ebert et al. [7] showed the power of illustrative rendering techniques for volume data; however, the renderer was basedon ray-casting and too slow for interactivity or quick explorationof the data. Our current work builds upon enhancement conceptsfrom that work yet. Furthermore, interactive volume rendering hasgarnered a significant amount of attention [15] and NPR methods have been applied to obtain interactive performance while producing effective volume renderings [2, 3]. Treavett et al. [29]implemented artistic procedures in various stages of the volumerendering pipeline. Techniques such as brush strokes, control volumes, paint splatting, and others were integrated into their rendering system to produce a variety of artistic effects to convey tone,texture and shape.However, tone, texture, and shape can be effectively conveyedby simply controlling the placement and density of points. Thoughnot a primary focus in illustrative rendering systems until recently,points have been used as rendering primitives before. Levoy andWhitted [13] first demonstrated that points could be used as a display primitive and that a discrete array of points arbitrarily displaced in space, using a tabular array of perturbations, could berendered as a continuous three-dimensional surface. Furthermore,they established that a wide class of geometrically defined objects,including both flat and curved surfaces, could be converted intopoints. The use of points as surface elements or “surfels” can produce premium quality images, which consist of highly complexshape and shade attributes, at interactive rates [18, 34].The main difference between previous stipple and point rendering research and ours is that our system interactively renders volumes with points instead of just surfaces with points. Within volume rendering, the closest related technique is splatting [33, 22],which traditionally does not incorporate the effectiveness of illustration techniques. In the remainder of this paper, we showthe effectiveness of a simple point-based interactive volume stippling system and describe how a number of illustrative enhancement techniques can be utilized to quickly convey important volume characteristics for rapid previewing and investigation of volume models.3T HE S TIPPLE VOLUME R ENDERER4P REPROCESSINGBefore interactive rendering begins, the preprocessor automaticallygenerates an appropriate number of stipple points for each volumebased on volume characteristics, including gradient properties andbasic resolution requirements. This preprocessing stage handles anumber of calculations that do not depend on viewpoint or enhancement parameters, including the calculation of volume gradient direction and magnitude, the initial estimation of stipple density fromvolume resolution, and the generation of an initial point distribution. Furthermore, the voxel values and gradients are all normalized.4.1 Gradient ProcessingGradient magnitude and direction are essential in feature enhancement techniques, especially when rendering CT data [11]. Somefeature enhancements are significantly affected by the accuracy ofthe gradient direction, especially our light enhancement. Noisyvolume data can create problems in generating correct gradient directions. Additionally, first and second derivative discontinuity invoxel gradients can affect the accuracy of feature enhancements.Initially, we tried a traditional central difference gradient method.However, Neumann et al. [16] have presented an improved gradient estimation method for volume data. Their method approximates the density function in a local neighborhood with a threedimensional regression hyperplane whose four-dimensional errorfunction is minimized to get the smoothed dataset and estimatedgradient at the same time. We have implemented their method forbetter gradient estimation.4.2 Initial Resolution AdjustmentWhen viewing an entire volume dataset, as the volumes’ size increases, each voxel’s screen projection is reduced. Even if we assign at most one point per voxel, areas with high gradient magnitudestill appear too dark. We use a simple box-filter to initially adjustthe volume resolution, so that the average projection of a voxel onthe screen is at least 5x5 pixels. This adjustment improves the stippling pattern in the resulting images.We define Nmax as the maximum number of stipples that eachvoxel can contain during the rendering process. After reading thedataset, we approximately calculate the maximum projection of avoxel on the screen and set the maximum number of points in thevoxel to be equal to the number of pixels in the voxel projection.This reduces redundant point generation and increases the performance of the system. The following formula is used:Nmax kmax Avol /(Xres Yres Zres )2/3The clarity and smoothness displayed by stippling, coupled with thespeed of hardware point rendering, makes volume stippling an effective tool for illustrative rendering of volume data. As with all scientific and technical illustration, this system must perform two keytasks. First, it must determine what to show, primarily by identifying features of interest. Second, the system must carry out a methodfor how to show identified features. The stipple renderer consistsof a point-based system architecture that behaves as a volume renderer and visually extracts various features of the data by selectiveenhancement of certain regions. Volume gradients are used to provide structure and feature information. With this gradient information, other features can be extracted such as the boundary regionsof the structure. We can illustrate these volumes using stipplingtechniques with a particular set of features in mind. To effectivelygenerate renderings of volume datasets at interactive rates, the system has two main components: a preprocessor and an interactivepoint renderer with feature enhancement.(1)where Avol is the rendered area, kmax is a scaling factor, and thevolume has resolution Xres Yres Zres . This is a heuristicformula because the scale of the X, Y and Z axes are not ordinarilythe same. Figure 4 shows several resolutions of a dataset. In eachcase, most of the details of the dataset are preserved.4.3 Initial Point GenerationIn several illustrative applications, units (such as points, particles orstrokes) are distributed evenly after random initialization. Due toconstantly changing scenes, these individual units are redistributedin every frame. This process is very time-consuming and leads toproblems with frame-to-frame coherence. To alleviate this problem, we approximate a Poisson disc distribution to initially position a maximum number of stipples. According to the statistics ofthe gradient magnitude distribution, we generate stipples near the
gradient plane for the voxels whose gradient magnitude is above auser specified threshold. We place stipples randomly, around thecenter of the voxel, between two planes, p1 and p2, that are parallel to the tangent plane, p0, and are separated by a distance chosenby the user. Next, we adjust the point locations in this subvolumeso that they are relatively equally spaced, approximating the evendistribution of points in a stipple drawing. After this preprocessing step is performed and the stipple positions are determined, anyprocessing that is subsequently performed (i.e. feature enhancements, motion), simply adjusts either the number of stipples thatare drawn within each voxel or their respective size. We alwaysselect the stipples that will be drawn from a pre-generated list ofstipples for each voxel, therefore, maintaining frame-to-frame coherence for the points.5F EATURE E NHANCEMENTSScientific illustration produces images that are not only decorative,but also serve science [10]. Therefore, the rendering system mustproduce images accurately and with appropriately directed emphasis. To meet this requirement, we have explored several featureenhancements in an attempt to simulate traditional stipple illustrations. These feature enhancements are based on specific characteristics of a particular voxel: whether it is part of a boundary or silhouette, its spatial position in relation to both the entire volume andthe entire scene, and its level of illumination due to a light source.In particular, silhouette curves (common in stipple drawings) arevery useful for producing outlines of boundary regions and significant lines along interior boundaries and features.To enable the use of all of our feature enhancements, each voxelhas the following information stored in a data structure:where Smax is a user specified maximum point size. Voxels withlarger gradient magnitude contain larger points, achieving the effectof smooth point size changes within the volume. The point size foreach voxel is calculated in a manner similar to Equation 2.5.1 Boundaries and SilhouettesIn traditional stipple drawings, boundaries are usually representedby a high concentration of stipples that cluster on surfaces. Ina scalar volume, the gradient of a voxel is a good indication ofwhether the voxel represents a boundary region. Boundary andsilhouette enhancements are determined using volume illustrationtechniques [7] . The boundary enhancement factor Tb for a voxelat location Pi is determined from the original voxel scalar value, viand the voxel value gradient magnitude k V i k using the followingformula:Tb vi (kgc kgs (k V i kkge ))where kgc controls the direct influence of the voxel value, kgs indicates the maximum boundary enhancement, and kge controls thesharpness of the boundary enhancement. By making the stippleplacement denser in voxels of high gradient, boundary features areselectively enhanced. This feature extraction can be further improved with silhouette enhancement techniques.In manual stipple drawings, the highest concentration of stipplesis usually in areas oriented orthogonally to the view plane, forming the silhouette edge. The silhouette enhancement factor Ts isconstructed in a manner similar to the boundary enhancement factor. The parameters ksc , kss , and kse are controlled by the user toadjust each part’s contribution, as shown in the following formula: kse )Ts vi (ksc kss (1 ( V i · E )) number of points gradient voxel scalar data value point size point list containing the x, y, z location of each pointOur feature enhancements, calculated on a per frame basis, determine a point scaling factor according to the following sequence:boundary, silhouette, resolution, light, distance, and interior. Fordifferent datasets, we select a different combination of feature enhancements to achieve the best effect.The basic formula for the point count per voxel, Ni , is the following:Ni Nmax T(2)where Nmax is the maximum number of points a voxel can contain, calculated according to Equation 1 from the volume’s projected screen resolution, andT Tb Ts Tr Td Tt Tl(3)Tb , Ts , Tr , Td , Tt , and Tl are the boundary, silhouette, resolution,distance, interior transparency, and lighting factors, respectively,described in the following sections. Each factor is normalized inthe range of zero to one. If some feature enhancements are not selected, the corresponding factors will not be included in Equation(3).Besides the point count of a voxel, the point size is also an important factor to increase visualization quality. The basic point sizeof a voxel is calculated by the following equation:Si k V i k Smax(4)(5)(6) is the eye vector.where EUsing the boundary and silhouette enhancement factors, we caneffectively render the outline of the features in the volume. Therefore, points are dense on the outline of the objects, while sparseon other boundaries and in the interior. We render more points onand inside the volume boundaries and can, consequently, incorporate light and transparency information to more effectively enhancethe rendering. Figure 1(b) shows the engine block volume renderedwith stipples. Boundary areas, particularly those in silhouette, areenhanced, showing these features clearly.5.2 ResolutionTraditionally, the number of stipples used to shade a given featuredepends on the viewed resolution of that feature. By using a resolution factor, we can prevent stipple points from being too denseor sparse. The resolution factor adjusts the number of points ineach voxel and produces the effect that the features become largerand clearer when the volume moves closer to the viewpoint. It alsohelps increase rendering performance by eliminating unnecessaryrendering of distant points. In order to implement resolution enhancement, we use the following formula:Tr [(Dnear di ) kre](Dnear d0 )(7)where Dnear is the location of the near plane, di is the distancefrom the current location of the volume to the near plane, d0 is thedistance from the initial location of the volume to the near plane(we use this position as the reference point), and kre controls therate of change of this resolution enhancement. When kre equals 0,there is no enhancement. The bigger the value, the more obviousthe effect. The point size also varies with the change in resolution
so that point sizes are small when the resolution is low and largewhen resolution is high. In Figure 4, the same model is viewedat three different distances, but the resulting stipple density is thesame for each.Figure 5: Distance attenuation of the engine block volume.(kde 1.5)Figure 4: Resolution enhancement of the leg volume dataset.(kre 1.1)5.3 DistanceIn resolution enhancement, we use the location of the whole volume in the scene. The location of different volume elements withinthe overall volume presents a different challenge. Distance is animportant factor that helps us understand the relationship betweenelements within the volume. As in traditional illustration, we canenhance depth perception by using the position of a voxel within thevolume box to generate a factor that modifies both the point countand the size of the points. We use a linear equation with differentpowers kde to express the function of the distance attenuation togenerate this factor via the following equation:zTd 1 ( )kdea(8)Where ( a, a) is the original distance range in the volume, z is thedepth of the current voxel, and kde controls the contribution of thedistance attenuation for each voxel. kde may change from negativeto positive to enhance different parts in the volume. Figure 5 showsan example of distance attenuation. Comparing this image to that inFigure 1(b), it is clear that more distant parts of the volume containfewer and smaller points. This is most apparent in the back, rightsection of the engine block.5.4 InteriorPoint rendering is transparent in nature, allowing background objects to show through foreground objects. By doing explicit interior enhancement, we exaggerate this effect, allowing us to observemore details inside the volume. Generally speaking, the point countof the outer volume elements should be smaller than that of the interior to allow the viewing of interior features. In our system, thenumber of points varies based on the gradient magnitude of a voxelto the center of the volume, thus achieving a better transparencyeffect:Tt k V i kkte(9)kte controls the falloff of the transparency enhancement. With thisequation, the voxels with lower gradient magnitude become moretransparent. In addition, point sizes are adjusted by the transparencyfactor. In Figure 6, the density of the leaves changes from sparse todense when the gradient magnitude changes from low to high. Thestructure of the tree is more evident with interior enhancement.5.5 LightingAchieving compelling lighting effects within the stipple rendererpresents several challenges. First, when using noisy volumes, thegradients are not adequate for expressing the shadings of somestructures correctly. Second, because structures often overlap inthe volume, it can still be difficult to identify to which structure apoint belongs in complex scenes. Finally, the problem of capturing both the inner and outer surfaces at the same time, while theirgradient directions are opposite, must be correctly handled. Theseissues can all significantly reduce the quality of the lighting effects.Therefore, when lighting the volume, only the front oriented voxels(where the gradient direction is within ninety degrees of the eye direction) are rendered. The following equation is used to generate afactor to modify the point count of the voxels: · V i )kleTl 1 ( L(10) is the light direction and kle controls the contribution ofwhere Lthe light.In Figure 7, light is projected from the upper right corner in theimage and smaller vessels have been removed with parameter settings to better highlight the shading of the main features. The mainstructures and their orientation are much clearer with the application of lighting effects.5.6 Silhouette CurvesManual stipple drawings frequently contain outlines and othercurves which supplement the shading cues provided by the stipples. These silhouette curves are generally drawn at two places: theoutline of the objects and obvious interior curves. Searching forpotential silhouette curves in the vicinity of each voxel could easilycreate a performance bottleneck by requiring a search in, at least,
(without interior enhancement)(with interior enhancement)Figure 6: Stipple rendering of bonsai tree volume.(kte 0.5)To “sketch” silhouette curves, the voxels that satisfy the aboveconditions have a line segment drawn through the center of the Silhouette curves can be renvoxel in the direction of V i E.dered at 20 to 30 frames per second and significantly improve image quality. Figure 8 shows the effectiveness of silhouette curves inhighlighting structures, especially the bones of the foot dataset.6(without lighting)(with lighting)Figure 7: Stipple rendering of the aneurysm volume.(kle 2.7)the 3x3x3 subspace around each voxel. We have implemented thismore exhaustive search, as well as an alternative technique usingthe Laplacian of Gaussian operator (LOG) as a volumetric edge detection technique.This (LOG) edge detection technique provides virtually identicalresults and simplifies the boundary computation, so it is much fasterto calculate per frame. In a preprocess, we compute the LOG valuefor each voxel, then during rendering, we determine the silhouettevoxels using the following criteria:1. Vi LOG(Vi ) T hLOG · V i ) T heye2. (E3. k V i k T hgrad is the eye (or view) vector, and T hLOG , T heye , andwhere ET hgrad are user controllable threshold values.P ERFORMANCEWe are able to interactively render reasonably-sized volumedatasets using illustrative enhancement with our system on modern PCs. The total number of point primitives in a typical data setranges from 5,000 to 2,000,000, and the silhouette curves rangefrom 1,000 to 300,000. Performance results of our stipple systemare presented in Table 1. These running times were gathered from adual processor Intel Xeon 2.00 GHz computer with a Geforce 3 Ti500 display card. The preprocessing time varies from seconds to aminute. The frame rates can be improved by further reducing cacheexchange and floating point operations. Nonetheless, the measuredframe rate does provide the user with a level of interactivity necessary for exploring and illustrating various regions of interest withinthe volume datasets. Through the use of sliders, the user is able toquickly adjust the parameters to select the desired feature enhancement and its appropriate level. The user is able to rotate, translate, and zoom in or out of the volume while maintaining consistentshading. The system has very good temporal rendering coherencewith only very subtle temporal aliasing occurring during rotationnear silhouette edges and illuminated boundaries as new points areadded based on the silhouette and illumination enhancement factor.We have implemented a simple partial opacity point rendering tofade the points which alleviates this 12.13.9Table 1: Running times (frames per second) for separate renderingtechniques.
(without silhouette curves)(with silhouette curves)Figure 8: Stipple rendering of the foot volume.(T heye 0.0, T hgrad 0.2, T hLOG 0.12)Figure 9: Head volume with silhouette, boundary, and distance enhancement and silhouette curves.(kgc 0.4, kgs 0.0, kge 10.0, ksc 0.5, kss 5.0, kse 1.0; T heye 0.9, T hgrad 0.2, T hLOG 0.22)7C ONCLUSIONS AND F UTURE W ORKWe have developed an interactive volumetric stippling system thatcombines the advantages of point based rendering with the expressiveness of the stippling illustration style into an effective interactive volume illustration system, as can be seen above in Figure 9.This system utilizes techniques from both hand drawn illustration and volume rendering to create a powerful new environmentin which to visualize and interact with volume data. Our systemdemonstrates
Winkenbach and Salesin [32] presented algorithms and techniques for rendering parametric free-form surfaces in pen and ink. Deussen et al. [5] used points for computer generated pen-and-ink illustrations in simulating the traditional stipple drawing style. Their me