Transcription
Estimating Total Cost of Bridge Construction usingAccelerated Bridge Construction (ABC) andConventional Methods of ConstructionPROGRESS REPORTPeriod Ending June, 2016Submitted byMohammed Hadi, Ph.D., PEWallied Orabi, Ph.D.Yan Xiao, Ph.D., PEJianmin Jia, Ph.D. CandidateDepartment of Civil and Environmental EngineeringFlorida International University, Miami, FloridaSubmitted toAtorod AzizinaminiDirector, ABC-UTCSeptember 2016
A. DESCRIPTION OF RESEARCH PROJECTAccording to the U.S. Department of Transportation status report of 2013, 25.9% of the totalbridges in the United States are either considered structurally deficient or functionally obsolete.There is therefore a pressing need for significant bridge repair and replacement efforts (DOT 2013).These bridge projects create a challenge to State Transportation Agencies (STAs) across thecountry in order to minimize the associated traffic disruptions in a safe way, while preserving thequality of the work and fulfilling budget constraints. In an effort to combat this challenge, theFederal Highway Administration (FHWA) is adopting and promoting the implementation ofaccelerated bridge construction techniques (ABC) through the “Every Day Counts” initiative toexpedite project delivery and minimize their impacts on the transportation network (FHWA 2012).Accordingly, a number of STAs are implementing ABC techniques and experienced positiveoutcomes in a significant number of bridge replacement and/or rehabilitation projects. However,ABC techniques are often associated with high initial costs, which deters many STAs from a widerimplementation of these techniques (TRB 2013). In addition, the impact of adopting theseaccelerated techniques to current bridge design and construction processes is not fully understood,which adds to the complexity of choosing ABC over conventional methods in bridge projects.Therefore, there is a pressing need to provide decision makers with a comprehensive tool forestimating the total cost of ABC projects including: construction, indirect, agency cost, and usercosts. This tool will facilitate comparing the total cost of bridge repair and replacement work underboth ABC and conventional methods.A.1. Problem StatementAccelerated Bridge Construction (ABC) methods have been successfully used by many STAs forboth planned and emergency bridge projects. However, the total cost of ABC projects are notcompletely understood let alone being included in the decision making process for such projects.This total cost include: construction, indirect, agency, and user costs. These costs need to beanalyzed and estimated to support better decisions in selecting ABC versus conventional bridgeconstruction methods. However, this analysis and estimation process is a complex process as itinvolves the evaluation of different types of costs including but not limited to: construction costs,engineering and inspection costs, user costs (with consideration of impacts on mobility, reliability,motorist and construction worker safety, and emission), right of way, quality of work, and theimpact on surrounding communities and businesses (Salem & Miller 2006). Unfortunatelyhowever, the lack of appropriate tools inclusive of the aforementioned factors does not allow theagencies to fully realize the true benefits and appreciate the true costs of ABC compared toconventional bridge construction. In order to address these gaps in both the body of knowledgeand current ABC practices, the objectives of this project are to: (1) better understand and estimate
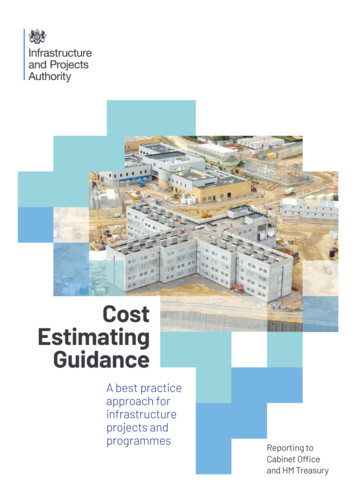
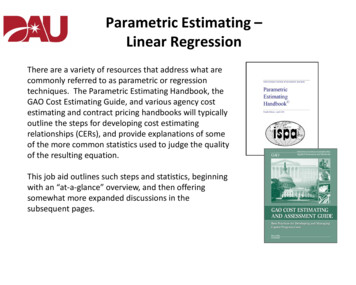
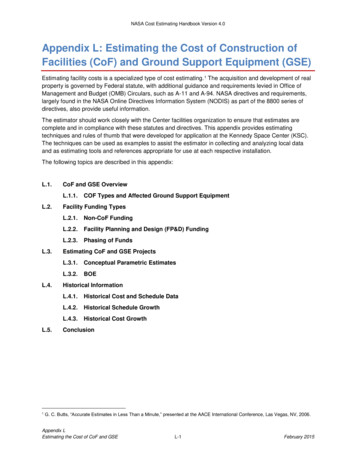
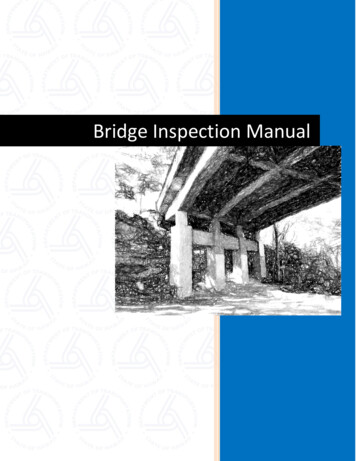
the costs associated with ABC; and (2) Analyze different ABC case studies to determine the driversand barriers for implementing ABC as well as performing a benefit-cost analysis.A.1.a. Brief Description of Current Practices of ABC Decision MakingThere are a number of existing tools that are currently in use by or available to STAs to supporttheir decision-making related to ABC; these tools can be categorized under two main categories:qualitative and AHP-based quantitative tools, as shown in Figure 1.Figure 1: Current Decision Making Tools for Bridge Construction ProjectsQualitative tools currently in use by STAs include flowcharts, matrices, and questionnaires. Oneof the most widely used qualitative tools is the FHWA flowchart (FHWA 2005) that is designedto assist decision makers in determining whether the use of prefabricated bridges is suitable fortheir projects or not. The flowchart (Figure 2) includes questions related to major factors that mighttrigger the use of ABC, such as: average daily traffic; whether it is an emergency bridgereplacement project; whether the bridge is on an evacuation route; detours and lane closures times;and whether the bridge construction is on the critical path of the project schedule. If the useranswers “no” to all these questions, the use of ABC is only justified if it improves safety and/or ifthe construction cost is less than that of conventional bridge construction. Alternatively, if theanswer to any one of five aforementioned questions is “yes”, then the decision maker shouldconsider ABC after examining the bridge’s need for rapid construction, and the associated safetyand costs impacts. Similar decision making practices are followed in other qualitative tools, suchas the FHWA matrix and STA questionnaires. This kind of subjective practice that uses a yes/noand/or Likert scale approaches to evaluate ABC projects is insufficient in identifying andevaluating the true costs of ABC methods.
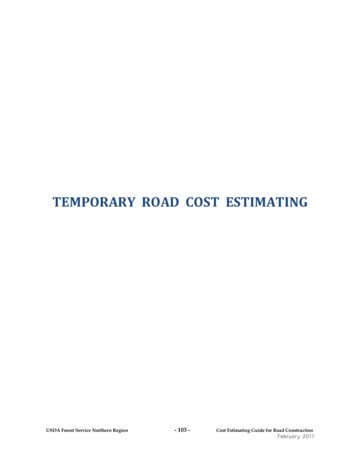
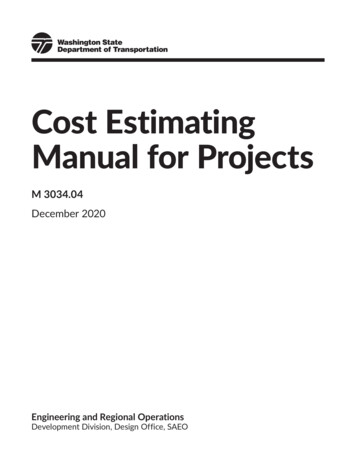
Figure 2: Flowchart for PBES Decision MakingAHP-based quantitative tools are also used for ABC decision making. One of these tools, andperhaps the most well-known ABC decision making tool, is developed by the Oregon Departmentof Transportation (ODOT) in collaboration with seven other DOTs (Doolen et al. 2011). In thistool, five main decision criteria are considered: direct cost, indirect cost, schedule constraints, siteconstraints, and customer service. Furthermore, a set of sub-criteria was developed for each ofthese five criteria as seen in Figure 3. The tool guides the decision makers through performingtwo-step pair-wise comparisons between the construction alternatives for each of the criteriaselected by the users based on their goals and priorities. This method considers myriad factors andreduces the very high subjectivity inherent in the qualitative tools by attempting to assign scoresto each construction method based on its performance in each of the criteria considered. However,these scores and their relative weights are still subjective since they are assigned based on theuser’s perceptions rather than objective evaluation and in-depth analysis. These tools are thereforesusceptible to underestimation or overestimation of the utility of different alternatives. While suchmethods might be suitable for inherently subjective criteria, such as customer service, they areinsufficient to objectively evaluate criteria such as construction, indirect, and user costs.
Figure 3: ODOT AHP Tool Decision Criteria and Sub-criteriaAnother important component in decision-making process is to assess the user costs. The “WorkZone Road User Costs – Concepts and Applications” report produced for the Federal HighwayAdministration presents a framework for the use of user and construction costs in alternativeanalysis and associated decision making process. The report also discussed how the unit cost ofdelays, vehicle operating cost, crashes, and safety can be calculated based on outputs from toolsand methods that can calculate these parameters. A number of tools have been developed to assessthe impacts of work zones o mobility. The FHWA Traffic Analysis Toolbox Volumes VIII and IXclassifies these tools to sketch planning tools, traffic demand models, signal optimization tools,macroscopic simulation, mesoscopic simulation, and microscopic simulation. These documentsprovide guidance to assist in selecting between these different types of tools based on variousfactors.The sketch planning tools range from simple spreadsheets that allow the analysis of a single link(like the Q-DAT developed for Texas A&M) to slightly more complicated tools like theQuickZone developed by FHWA that allows the modeling of multiple links on the subject facilityand alternative route. A good example of macroscopic simulation models are the tools that
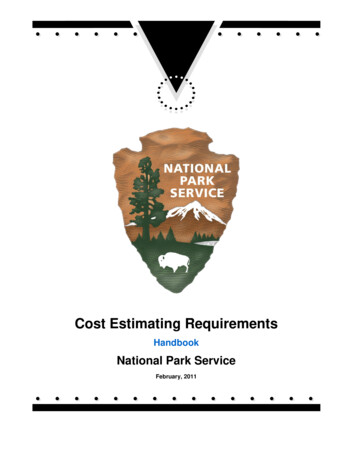
implement the freeway and urban street facility procedures of the Highway Capacity Manual(HCM) including the soon to be updated work zone procedures in the 2015 update of the HCM.An example of the use of demand forecasting-based and simulation-based dynamic trafficassignment modeling tools is the WISE approach developed as part of the SHRP 2 R11 project.Most of the above mentioned tools do not consider in details reliability, emission, and safetyimpacts. Recent information, tools, and findings from the TRB SHRP 2 Reliability program, EPAMOVES emission modeling, and Highway Safety Manual (HSM) procedures are not considered.Real-word data from advanced monitoring systems and other sources are also becoming availablethat will allow the provision of more detailed data to the developed tools and to confirm theirperformance. The use of the data needs to be further considered to support the decision makingprocesses related to ABC construction.A.2. Contribution to Expanding Use of ABC in PracticeDevelopment of a comprehensive tool that has the capability of estimating the total cost of ABCprojects and compare them with those of the conventional methods will help decision makers inunderstanding and evaluating the true benefits and costs of ABC methods at an early stage of theproject development which, in return, will lead to the expansion in the use of ABC methods versusthe conventional ones.A.3. Research Approach and MethodsDue to the limitation of the existing ABC decision making tools, there is a need for an integratedtool that can assist decision makers in reliable estimation of a wide range of costs and impactsrelated to ABC. Such integrated decision support tool should facilitate decision-making at differentplanning stages based on the information available at each of these stages. Hence, this project aimsat creating a vision for a multi-tier tool decision making tool, which has the capability of assistingthe decision makers during these different stages; namely: the early planning, preliminary design,design & implementation, and construction stages. Thus far, the research team has developed apreliminary framework for a multi-tier tool composed of two tiers, as seen in Figure 4. Each tierincludes a set of modules for estimating the costs and benefits of ABC based on the informationavailable at that stage.
Figure 4: Overview of the Envisioned ABC Cost Estimating Tool Tier 1: The modules included in this tier will be used during the early planning stage whenlittle information is known about the project or during the preliminary engineering designstage at which more specific information is available. This tier will primarily help thedecision makers to get a conceptual and parametric estimation of ABC costs and impacts. Tier 2: The modules included in this tier will be utilized during the project’s design &implementation phase. By this stage the decision to adopt ABC is already taken, but witha more detailed analysis of the costs and impacts, decision makers can reach the decisionof which ABC method is best suited for their project by utilizing multi-objectiveoptimization methods based reliable estimates of a wide range of costs and benefits.As seen from the above discussion, the envisioned ABC decision making framework consists oftwo different tiers, each takes into account and analyzes a different set of decision factors andconsiders the availability of information at that phase of decision making. While the scope of thecurrent project is only limited to developing modules for estimating user and construction costs ofABC projects in various stages and combining these two cost components to assess the true costof ABC, the vision for the integrated ABC decision support tool is to continue this research effortto create, validate, and deploy a multi-tier ABC decision support tool that includes the product ofthis project as a component.
A.4. Description of Tasks to be Completed in Research ProjectThe following tasks will be completed to achieve project tasks.Task 1: Review of State-of-the-Practice and State-of-the-Art: This review will include reviewand assessment of existing methods and tools used in calculating public costs and in supportingagency decisions, as they relate to ABC. This task will also review current agency practices andpolicies in evaluation of public costs and in making decisions regarding ABC during the planning,design, construction, operations, and preservation of roadway infrastructure. The research teamwill conduct an extensive review of the existing literature on the subject.Task 2: Create a Two-Tier Model for ABC Construction Cost Analysis: The research team willutilize various ABC data sources (e.g., FHWA database) and case studies to develop a two-tiercost analysis. The Tier-1 will include a conceptual cost estimation model that will provide a highlevel cost estimate for an ABC project based on different characteristics such as number of spans,ABC type, road type, and materials. The Tier-1 model will be developed mainly based on theFHWA data. The tool will be created in a spreadsheet platform and will be posted on the ABCUTC website for use by transportation agencies. This model will be appropriate for early stagesof the project, when limited information is available and a less detailed analysis is sufficient.Figure 5: Tier-1 Cost Estimation ToolThe Tier-2 tool will include a mean for detailed cost estimation of ABC project. To this end, theresearch team will identify the key cost items for three main ABC methods (i.e., SPMT, LateralSlide, and Modular method). For this purpose, data will be collected from various ABC casestudies and cost reports and schedules will be analyzed to identify the cost items (Figure 6) andactivities that cause cost difference between these methods as well as the conventional methods ofbridge construction. Based on the collected data, a checklist of detailed cost items for the threemain ABC methods will be developed. The checklist will be shared with selected transportationagencies for verification and collection of numerical values of cost items. The research team willemphasize collecting the indirect costs of ABC projects, in order to make comparison with theconventional methods, since very limited information is currently available related to this item.Based on the feedback and data collected from the transportation agencies, the research team will
create a spreadsheet tool for comparative cost analysis of different ABC methods vs. conventionalmethods of bridge construction.Figure 6: Components of the Tier-2 Estimation ToolTask 3: User Cost Analysis: An integrated environment of methods and tools will be developedin this study to support scenario analysis and the estimation of associated user costs at early stagesof bridge construction projects when less detailed analysis is needed and at later stages when moredetailed analysis is needed. Within such an environment, the impacts of bridge construction ontraffic mobility and reliability can be estimated utilizing different analysis methods and tools,depending on the level of details available at the current phase of bridge construction. In the firststage, the early planning stage, the analysis of bridge construction impacts may be conducted atthe sketch-planning level. Available sketch-planning tools such as Q-DAT developed by TTI,SHRP 2 C11, and RealCost developed by FHWA, analysis is needed and more data is availableQuickZone tool developed by FHWA, and SHRP 2 L07 tool can be used, in combination withother procedures. The selection between these tools depends on the data availability at the earlystages of the implementation since some of them require more data than others. A route diversionmodel will be developed in this study and integrated with these sketch-planning level tools tocapture the diversion of travelers resulted from bridge construction and provide a better estimationof mobility impacts.At the design and implementation stages of the project, more detailed analyses may be required toassess the impacts of bridge construction. In this case, more detailed modeling tools such as statictraffic assignment or simulation-based dynamic traffic assignment (DTA) are more appropriate.At this stage, the principals of the WISE tool proposed by SHRP 2 R 11 project, can be used tomodel the construction impacts with the consideration of traffic diversions. When lacking detailed
data and the required resources to perform simulation-based DTA, the highway capacity manual(HCM)-based procedures and tools may be applied.During the construction and post-construction stages, real-world data may be available andtherefore a before and after study can be conducted based on collected data to evaluate the mobilityand reliability impacts of construction. This study will also recommend procedure to monitor theactual user cost incurred by an agency during construction based on real-world data.The outputs of traffic counts, speed, and delays from the different levels of analysis can beassociated with the MOtor Vehicle Emission Simulator (MOVES) developed by the United StatesEnvironmental Protection Agency (EPA) to estimate the emissions and meanwhile applied toproduce vehicle operating costs.Work zone safety including both motorist safety and worker safety is also an important componentwhen assessing user costs. The statistics of work zone crashes and crash modification factorsresulting from mitigation strategies will be collected based on existing studies and used as part ofthe developed tools.Another important component of the developed integrated environment is to estimate the businessand social impacts of bridge construction. The application of ABC method is expected to reducethese impacts. Land use data, trip purpose, type, and socio-economic characteristics of the tripmaker that pass the construction zone or divert to alternative routes because of construction willbe extracted from either the conventional four-step travel demand model or more advancedactivity-based demand model and used in the calculation of business and social impacts. Similarly,the different types of freight trips affected by bridge construction can also be obtained from traveldemand model and combined with the data of commodity distribution and value of commodity toassess the loss due to impacts on freight mobility and reliability.
Figure 7: Components of the User CostsTask 4: Recommendation of Estimation and Assessment Framework: The tools developed inTask 2 and Task 3 will be integrated into a spreadsheet tool for transportation agencies to determinethe total costs of ABC projects. In addition, a framework will be proposed for a web-based decisionsupport system that integrates the recommended methods and tools in a user-friendly system.Figure 8 demonstrates an example of components of the envisioned decision support framework.The cost estimates produced by different components of the framework will be combined througha fuzzy logic algorithm. The users will be able to assign different weights to different costscomponents based on local conditions. This will used as the basis of a quantitative multi-criteriadecision making process to support agency decisions.
**This project will only focus on the cost analysis module and development of cost estimation tool of the envisionedframework rather than development of animation and visualization toolsFigure 8: Components of the Envisioned Bridge Construction Decision SupportFrameworkTask 5: Method Applications to Identified Scenarios: This task will demonstrate the use of therecommended framework and the cost analysis module utilizing a number of scenarios. The resultswill be analyzed to determine the effectiveness of the proposed framework and if any adjustmentsare needed. This task will first identify few bridge construction scenarios that are representative oftypical bridge project characteristics. These characteristics include, for example, bridge size(number of spans and lanes), traffic demands, operating environment (e.g., area type, facility type,etc.), and the availability of near-site space for bridge component prefabrication. The data neededfor identifying such scenarios will be collected from the agency survey mentioned in Task 1, casestudies, geographical information system (GIS) data, and traffic volume data.Once the scenarios are selected, the recommended methods in Tasks 2 and 3 will be applied andthe results will be examined to determine any issues with the estimated costs and associateddecisions based on identifying the major differences between the conventional and acceleratedconstruction methods. In addition, sensitivity analyses will be applied to study the impact ofvariables uncertainty on construction time, traffic operations, and user and construction costs. Thesensitivity analysis will facilitate evaluating the impact of risk factors, such as weather conditions,traffic conditions, and other project characteristics on construction production rates and hence
project time and costs for the different scenarios. The results of this task will be used to recommendrefinements, if needed, to the framework developed in Tasks 2 and 3.Task 6: Production of Guidebook and Final Report: The results of the research will beincorporated in a guidebook describing key cost factors and outlining the decision supportframework. The deliverables will also include a tool for analyzing and estimating public costs ofABC. In addition, final report will document the efforts and results of Tasks 1 to 5 of the projectin accordance with ABC-UTC guidelines.B. CURRENT PROGRESSB.1. Completed activities:Thus far, several research tasks have been conducted to attain the research objectives:1. State-of-the-Art literature review: During this task, a comprehensive literature review wasconducted to identify the current ABC decision making tools, the decision factors taken intoaccount, and the way these factors are accounted for. Furthermore, a literature review identifyingthe different components of indirect & agency cost was completed. From this information, thelimitations of the current tools and the requirements of the new tools were identified. Finally, acomprehensive review of the current user cost estimation tools was conducted to assess thestrengths and weaknesses of each tool and determine their suitability to be used in the context ofthis study.2. Tier-1 Construction Data Collection: In this task, data related to the final construction cost andduration of several nationwide completed ABC projects as well as the characteristics of theseprojects were collected. In total, data from 65 projects related to 29 different states were collectedas shown in the table below.
Table 1: Construction Cost Data
3. Tier-1 Indirect Cost Data Collection: In this task, data about the magnitude and types ofdifferent components of the indirect & agency costs are being collected and at this stage data from13 projects from ODOT and one project from MassDOT were compiled as shown in the tablebelow.Table 2: Indirect Cost Data4. Tier-1 Construction Cost and Indirect Cost Analysis: To analyze the data, the collected datawere normalized for time and location using the RS Means indices and a statistical classificationmodel was used to create a model for cost estimation at the early planning stage. Table 3 andFigure 8 present the comparison of construction costs using ABC method versus conventionalmethod based on the costs data collected from different sources. The results show that the costs ofABC projects are less than conventional projects in 11 projects among all the data collected, thatis, about 21%.Table 3: Construction Costs Comparison Based on Collected dataABC( /FT2)Conventional( /FT2)% %
MaxCost ( 2282752003328ABCConventionalFigure 8: Comparison of ABC and Conventional Construction CostsFour factors were identified as the main factors influencing the project construction cost; thesefactors are: the project location, AADT, type of bridge structure, and number of spans. Amultinomial logistic regression model was developed based on these four bridge characteristicsinputs. In this model, the inputs were categorized and the cost output was treated as a range basedon the frequency of the cost in the collected data and each was assigned a categorical value, asshown in Table 4.Table 4: Categories of Multinomial Logistic Regression Model Cost OutputCost Interval ( /sq.ft)Categorical Value0 to 1001101 to 2002201 to 3003301 to 4004401 to 5005501 to 6006601 to 7007701 to 8008801 to 9009901 to 100010
In addition, a preliminary analysis of the indirect cost data collected up to this stage was conductedto understand the different characteristics of these data. In this analysis, the cost data of the tenABC projects collected from Oregon DOT were further analyzed to study the following four typesof agency and indirect costs: right-of-way (ROW), construction engineering (CE), projectengineering (PE), and inspection. Figure 9 presents the average values of agency and indirectcosts based on the Oregon DOT ABC projects and Figure 10 shows the corresponding percentagescompared to the total costs. Tables 5 to 8 list the comparison of each type of indirect costs resultedfrom the ABC and conventional construction methods.Avg 0.00.0PEROWCEInspectionFigure 9: Average Values of Agency and Indirect CostsAvg % of Total ctionFigure 10: Percentages of Average Values of Agency and Indirect Costs Compared to TotalCosts
Table 5: Project Engineering Costs Comparison Based on Collected Min2.1%1.8%0.3%Max25.1%23.7%1.4%Table 6:Right-of-Way Costs Comparison Based on Collected Min2.1%1.8%0.3%Max25.1%23.7%1.4%Table 7: Construction Engineering Costs Comparison Based on Collected Min2.1%1.8%0.3%Max25.1%23.7%1.4%Table 8: Inspection Costs Comparison Based on Collected Max2.9%6.5%-3.6%Average5. Tier-2 Data Collection & Categorization: in order to be able to perform a detailed costestimating for an ABC project, data about the different activities involved in that project have tobe first collected. To achieve this objective, detailed schedules for a total of 16 different ABCprojects were collected from 11 different states using the FHWA database. In addition, data froma CMGC project in Tennessee was collected, this project consists of four different bridges.Furthermore, data from six hypothetical ABC projects (SPMT) and their comparable conventionalprojects were collected from an analysis of the ABC costs posted on the FDOT website. Thecollected data were categorized according to the ABC method used in order to facilitate a reliable
analysis. These methods were: modular construction, SPMT, and lateral sliding, with 13, 6, and 1project in each category, respectively6. Tier-2 Data Processing: using the collected schedules, a generalized activity’s list for eachABC method was generated. This list captures the major activities associated with each ABCconstruction method.7. Tier-2 Cost Estimating Spreadsheet Tools: three detailed cost estimation spreadsheets arecurrently under development, one each for the ABC methods of modular, SPMT, and lateral sliding.These spreadsheets are based on the results of the analysis of the previous task. The user will,based on the specific characteristics of the bridge being considered, be provided with the mostsignificant cost components that need to be evaluated. Identifying the most significant costcomponents will be made possible by analyzing the collected cost and schedule data for ABC andconventional bridge project in order to identify cost the components that:i.exist in both types of construction, andii.are unique to either of ABC or conventional construction.8. Tier-2 Cost Mapping & Normalization: detailed cost data of the different activities of theabove-mentioned projects were collected from the projects’ bid tabs and mapped with the activitiesin the generalized activity’ lists. Moreover, in order for the cost mapping data to be comparable,the costs of each project were normalized by the project size in order to negate the impact of theproject size on the activities cost and be able to compare cost/sq.ft for all the projects.9. Tier-2 Statistical Analysis: paired sample t-tests were applied to the bridge project cost data ofthe hypothetical ABC and conventional bridge project cost data collected from the FDOT website.This statistical analysis identified the cost items that showed significant difference between ABCand conventional construction methods. This analysis was performed on direct and indirect costs,different types of bridge structures: superstructure and substructure, and different type of work:concrete and steel. The results of all these analyses are shown in table 9. This analysis proved thatindirect and contractor’s general condition costs could be significantly different between the ABCand conventional construction and therefore careful planning of ABC projects can provide costsavings over conventional construction methods.Table 9: ABC vs. Conventional Bridges Statistical AnalysisItemTotal CostIndirect CostDirect CostDetourGeneral ConditionsEnd BentsConclusionSignificant Differenc
Figure 2: Flowchart for PBES Decision Making AHP-based quantitative tools are also used for ABC decision making. One of these tools, and perhaps the most well-known ABC decision making tool, is developed by the Oregon Department of Transportation (ODOT) in collabor