Transcription
This PDF is a selection from an out-of-print volume from the National Bureauof Economic ResearchVolume Title: Output Measurement in the Service SectorsVolume Author/Editor: Zvi Griliches, editorVolume Publisher: University of Chicago PressVolume ISBN: 0-226-30885-5Volume URL: http://www.nber.org/books/gril92-1Conference Date: May 4-5, 1990Publication Date: January 1992Chapter Title: Measurement and Efficiency Issues in Commercial BankingChapter Author: Allen N. Berger, David B. HumphreyChapter URL: http://www.nber.org/chapters/c7237Chapter pages in book: (p. 245 - 300)
7Measurement and EfficiencyIssues in Commercial BankingAllen N. Berger and David B. HumphreyCommercial banking is a very difficult service industry in which to measureoutput, technical change, or productivity growth. First, there is disagreementover which services banks produce and over how to measure them. In addition, banking services are often priced implicitly through below-market interest rates on deposit balances, making observed revenue flows inaccurateguides to choosing the important outputs to include in the analysis. Bankingalso remains a highly regulated industry in which substantial inefficiencieshave been shown to exist. As a result, technical improvements that increasethe productivity of the most efficient firms may not be well reflected in theindustry as a whole. A further complication is that the deposit side of bankingunderwent substantial deregulation in the 1980s, including the lifting of effective interest rate ceilings on certain deposits and the creation of new types ofaccounts. The deregulation directly raised banking costs and shifted the optimal mix between the provision of services and the payment of interest to depositors. Measurement of cost changes and productivity gains must take thesefactors into account, including the possibility of a period of significant disequilibrium as banks attempted to adjust to deposit deregulation.Despite these difficulties, it is important to analyze the banking industry, asit constitutes almost 20 percent of the U.S. finance, insurance, and real estateservice sector of the national income accounts (net of owner-occupied housing). In addition, the externalities that banking generates through its roles asAllen N. Berger is senior economist at the Board of Governors of the Federal Reserve System,and David B. Humphrey is the Fannie Wilson Smith Eminent Scholar in Banking at Florida StateUniversity.The opinions expressed do not necessarily reflect those of the Board of Governors or its staff.The authors thank Frank Wykoff for his discussion of the paper. They also thank Tim Bresnahan,Dennis Fixler, Zvi Griliches, Diana Hancock, Stacie Humphrey, John Leusner, Jack Triplett, KimZieschang, and the other conference participants for helpful comments and suggestions and AlexWolman for outstanding research assistance.
246Alien N. Berger and David B. Humphreythe nation’s primary financial intermediary and conduit for monetary policyare considered to be important enough to require substantial government protection and supervision. Correspondingly, this paper attempts to meet thechallenges mentioned above in measuring output and efficiency in U.S. banking in the 1980s. It is hoped that some of the methods used here will also beapplicable to the study of other service sectors.Section 7.1 analyzes some of the problems in defining and measuring bankoutput. Three methods of choosing which banking functions represent important outputs are evaluated: the asset, user cost, and value-added approaches.The value-added approach, which identifies the major categories of depositsand loans as the important bank outputs, is determined to be the most satisfactory for our purposes. Note that, although deposits are specified as outputsbecause of their associated service output to depositors, we also specify themas having input characteristics, since they provide much of the supply of fundsto be invested in creating loan output.Sections 7.2 and 7.3 examine inefficiency and technical change in banking.The striking degree of cost dispersion in banking, where some firms haveaverage costs several times higher than others with similar scale and productmix, suggests that the standard assumption of equal efficiency underlyingmost analyses of technical change is invalid for banking. Cost function studiesof technical change (e.g., Hunter and Timme 1986) or productivity measuresthat relate total industry output to inputs (e.g., the Bureau of Labor Statistics[BLS] labor productivity measure) may confuse changes in the minimum costtechnology with changes in the deviations from that technology (i.e., inefficiency). We separate these elements here by estimating the change over timein both a cost frontier and the dispersion of industry costs from the frontier.Three methods of estimating a frontier are analyzed, and the thick-frontiermethod is chosen as most appropriate for the highly dispersed banking data.This method is applied to all 14,000 U.S. banks for the years 1980, 1984, and1988, which roughly correspond to periods of pre-, mid-, and postderegulation of the deposit side of banking, respectively. Shifts in the costfrontier over time are used to examine the effects of deregulation and technicalchange. Changes over time in the dispersion from the frontier are also evaluated. In this way, the standard approach to measuring productivity change isdecomposed into two parts: the frontier shift and the change in dispersionfrom the frontier. It is found that the interest rate deregulation of the 1980sand the banking industry’s response to it on balance increased costs in banking, but much of this increase benefited bank depositors through higher interest payments without a corresponding decrease in the provision of depositservices.7.1 Defining and Measuring Bank OutputThere is long-standing disagreement over exactly what it is that banks produce. Three alternative methods of choosing bank outputs are analyzed here,
247Measurement and Efficiency in Bankingthe asset, user cost, and value-added approaches. It is argued that the valueadded approach, which defines outputs as those activities that have substantialvalue added (i.e., large expenditures on labor and physical capital), is best foraccurately estimating changes in bank technology and efficiency over time.7.1.1 The Asset Approach to Defining Bank OutputVirtually all observers would agree that bank liabilities have some characteristics of inputs, because they provide the raw material of investable funds,and that bank assets have some characteristics of outputs as they are ultimateuses of funds that generate the bulk of the direct revenue that banks earn.Under the asset approach, banks are considered only as financial intermediaries between liability holders and those who receive bank funds. Loans andother assets are considered to be bank outputs; deposits and other liabilitiesare inputs to the intermediation process (see Sealey and Lindley 1977). Forsome large banks that primarily purchase their funds (with interest payments)from other banks and large depositors and turn these funds into loans, this isan adequate description of bank output. However, most banks do much morethan purchase their funds-they also provide substantial services to depositors, but these services are not counted as output in the asset approach.Mamalakis (1987) makes the useful distinction between the funds intermediation and deposit services of banks, of which the asset approach considersonly the former. Intermediation services transform balance-sheet liabilitiesinto assets and pay out and receive interest to cover the time value of the fundsused in this capacity. Although some large banks tend to specialize in thisfunction, most banks raise a substantial portion of their funds through produced deposits and provide liquidity, payments, and safekeeping services (aswell as interest payments) to depositors to obtain these funds.For some purposes, the asset approach is the most appropriate. For instance, in a study of loan costs or profitability, a reduced-form model in whichthe costs and different methods of raising funds are taken to be exogenousmay be best. However, any study of banking output as a whole needs to consider a structural form in which the investable funds are an intermediate output of raising deposits, and the services are provided to depositors as partialpayment to obtain these funds. The reduced-form asset approach excludes theimportant differences in service output that occur when the funds are raisedvia produced deposits versus purchased funds. Moreover, under current institutional arrangements, application of the asset approach to measure bankingoutput often leads to contradictions. For example, consider a bank that produces deposits and sells virtually all its funds to a second bank, which makescommercial loans with these funds. If the two banks merge, there is no changein total banking output, ceteris paribus. However, under the asset approach, ifboth commercial and interbank loans are considered to be outputs, then measured output would be diminished by the merger because there would be nomore interbank lending. If only commercial loans are considered to be out-
248Allen N. Berger and David B. Humphreyputs, then the bank that sells funds has no measured output, despite its production of deposit services and the fact that the second bank values the fundspurchased.7 . 1 . 2 The User Cost ApproachThe user cost approach determines whether a financial product is an inputor an output on the basis of its net contribution to bank revenue. If the financial returns on an asset exceed the opportunity cost of funds or if the financialcosts of a liability are less than the opportunity cost, then the instrument isconsidered to be an financial output. Otherwise, it is considered to be a financial input. Hancock (1985a, 1985b) first applied the user cost approach tobanking and Fixler and Zieschang (1990; chap. 6, this vol.) used it to determine the weights applied to bank asset and liability categories to derive indexes of bank output and prices.'The user cost approach determines whether an asset or liability categorycontributes to the financial output of a bank. The operating costs involved inproducing nonfinancial services associated with the asset or liability are notexplicitly considered. However, under relatively standard assumptions, theseoperating costs (inclusive of a normal return on capital) are simply the dual ofthe user cost approach and are included implicitly. An optimizing bank earns(in financial revenue less operating costs) exactly its opportunity cost of fundsat the margin on each asset and pays (in financial costs plus operating costs)exactly its opportunity cost at the margin on every liability.* Thus, to the extent that the user cost approach accurately measures marginal financial revenues and opportunity costs, its allocation is largely on the basis of excludedoperating costs, which is almost the same as the basis of the value-added approach described below. However, there are some difficulties in measuringfinancial revenues and marginal opportunity costs that make the user cost approach to distinguishing outputs from inputs subject to significant measurement error and sensitive to changes in the data over time.A problem with measuring the financial flows associated with balance-sheetitems, particularly loans and demand deposits, is that there is some commingling of implicit revenues that cannot be easily disentangled. As discussedfurther below, banks frequently use compensating balances or pay belowmarket rates on deposits as a method of charging for bank services. Borrowersare often required to hold part of their loan funds as idle demand deposit balances, which means that some of a bank's earnings on a loan are implicit and1. The user cost approach was pioneered by Donovan (1978) and Bamett (1980) in developingmoney supply indexes.2. The underlying assumptions used here are fairly common in banking. If costs and revenuesare separable across asset and liability categories and a bank holds securities that it perceives to bein infinite supply (e.g., Treasury Bills), then the quantities of asset and liability categories areadjusted until the marginal revenue less operating cost on every asset and the marginal revenuepaid plus operating cost on every liability equal the security rate less its marginal operating cost.See Klein (1971) and Hannan and Berger (1991).
249Measurement and Efficiency in Bankingare earned by paying less than the opportunity cost of funds on deposits. Further implicit earnings accrue to the bank on a loan when additional balancesare kept with the bank for liquidity, clearing, or timing purposes associatedwith spending the loan receipts. If the ratio of the compensating and conjunctive balances to loans were known, the implicit earnings could be allocated toloans in much the same way that the implicit losses on deposits from reserverequirements are calculated. However, this ratio is not known or estimated andthese implicit revenues are instead allocated entirely to deposits. As a result,there is a bias toward finding loans to be inputs or to have a smaller outputweight and toward finding demand deposits (where the balances are held) tobe an output or to have a higher output weight.Another difficulty is in adjusting opportunity costs for the important characteristics of bank assets and liabilities, including differences in credit risk,liquidity, and duration (maturity). Banks earn substantially higher rates forriskier, less liquid, and longer-term assets and pay substantially higher ratesfor deposits and other liabilities that are uninsured, have fewer liquidity features, and have longer terms to maturity. Theory requires that each dollar ofbank liabilities or assets have the same marginal opportunity cost only afteradjustment for these important characteristics. Therefore, the opportunity costmust be adjusted for each category or, equivalently, the financial return or costof each category must be adjusted before applying a common opportunitycost.3 In practice, these adjustments are difficult to make for every category,although there have been some attempts to do SO. When such adjustments arenot made or fall short, the determination of outputs from inputs and theweights derived for an index of bank output is biased. The bias toward findingan asset to be an output or have a higher output weight is greater, the longerthe maturity, the less the liquidity, and the greater the credit risk, because thesecharacteristics increase the unadjusted rate earned on an asset but are not reflected in the opportunity cost as currently m e a u r e dThus,. the matching ofliability and asset durations to reduce interest rate risk, the holding of assetsand liabilities with varying liquidity features, and the making of loans withdifferent credit risks are all commonplace in banking but may not be wellreflected in the application of the user cost approach.A final difficulty is the apparent sensitivity for turning outputs into inputsand vice versa with slight changes in the data or assumptions. When Fixlerand Zieschang (1990) switch the assumed opportunity cost for all balance3. As well, ex ante rates and opportunity costs are called for, but only ex post values areobserved.4. E.g., Hancock (1985a. 198%) corrected for credit risks on loans by subtracting off historical average loan losses for each bank. Also, Fixler and Zieschang (chap. 6, this vol.) calculatedopportunity costs that differ by bank, which may be viewed as a rough method of accounting fordifferences in risk, liquidity, and duration across institutions.5 . The biases go in the opposite direction for liabilities, because banks pay higher rates onlonger maturity, less liquid, or riskier liabilities, and these higher rates are subtracted from aconstant, unadjusted opportunity cost.
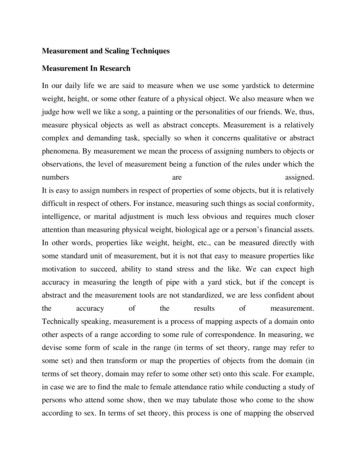
250Allen N. Berger and David B. Humphreysheet items between the average interest rate on loans (the Bureau of Economic Analysis [BEA] method) and the average of interest rates on both loansand deposits (the United Nations Statistical Office [UNSO] method), a number of switches in sign of user cost occur.6 In addition, nearly half of theirfinancial categories (mostly the smaller categories) switch between inputs andoutputs over a five-year period, even without changing the method of computing opportunity cost. One would expect banking technology to remain sufficiently constant that the determination of inputs and outputs should notchange so often.7.1.3 The Value-Added ApproachThe value-added approach differs from the asset and user cost approachesin that it considers all liability and asset categories to have some output characteristics rather than distinguishing inputs from outputs in a mutually exclusive way. The categories having substantial value added, as judged using anexternal source of operating cost allocations, are employed as the importantoutputs. Others are treated as representing mainly either unimportant outputs,intermediate products, or inputs, depending on the specifics of the category.A significant difference from the user cost approach is that the value-addedapproach explicitly uses operating cost data rather than determining thesecosts implicitly as that part of the return or cost not accounted for by thedifference between measured financial flows and marginal opportunity costs.The application of the value-added approach here and in other recent coststudies of the banking industry (e.g., Berger, Hanweck, and Humphrey, 1987)identifies the major categories of produced deposits (demand, time and savings) and loans (real estate, commercial, installment) as important outputs,because they are responsible for the great majority of value added. Purchasedfunds (federal funds purchased, large CDs, foreign deposits, other liabilitiesfor borrowed money) are treated as financial inputs to the intermediation process, because they require very small amounts of physical inputs (labor andcapital). On the asset side, government securities and other nonloan investments are considered to be unimportant outputs, because their value addedrequirements are also very low.’Table 7.1 shows the distribution of expenses for labor (salaries and fringebenefits) and capital (occupancy and furniture and equipment expenses) forthe largest size class of banks reported in the Federal Reserve’s FunctionalCost Analysis (FCA) program for 1980, 1984, and 1988.* In 1988, the two6. Fixler and Zieschang (chap. 6, this vol.) using a distance function approach, estimate opportunity costs that differ noticeably from the BEA and UNSO opportunity costs. However, theoutput and price indexes formed using the different opportunity costs were not very sensitive tothese differences.7. Government securities also often play an input role when they serve as required collateralon government deposits.8. The FCA is a cost-allocationiaccounting system that assigns direct and joint costs to a number of banking functions based on expert information and accounting rules of thumb. The FCAsample includes about 400-600 banks each year and is inclusive of all bank sizes except thelargest.
251Measurement and Efficiency in BankingDistribution of Bank Value Added in 1980, 1984, and 1988 (%)Table 7.1DepositsLoansYearDemandDepositsTime &SavingsRealEstateCommercial& 344111314101212718078Source: Board of Governors of the Federal Reserve System, FCA data.Note: Data refer to banks with 200 million to 1 billion in deposits, the largest-size class in theFCA data.major deposit functions shown absorbed 48 percent of bank value added; threemajor loan functions absorbed 30 percent, for a total of 78 p e r e n t Similar. results are shown for the two earlier periods.’OThe outputs identified using value added are similar to those used in theBLS measure of bank labor productivity, which uses a set of aggregate transaction flow data on major deposit and loan services, such as the number ofchecks written for demand deposits, the number of savings deposits and withdrawals for time and savings accounts, and the number of new loans for realestate, commercial, and installment loans (BLS 1989). Unfortunately, theseflow data are not available for all banks. In the analysis below, the deflatedvalues of deposit and loan balances are used as outputs for individual banks.The presumption is that these real dollar balances are proportionate to theunderlying transactions and account maintenance service flows for the depositcategories and the transactions, credit evaluation, and monitoring serviceflows for the loan categories.II Note that, although real deposit balances areused to indicate bank service output, the interest costs on these deposits,which are associated with the role of deposits as providing the input of loanable funds, are specified as well. In the existing literature, deposits are generally treated as either an input or an output, but both characteristics are represented here. I 2Despite the differences between the value-added and user cost approaches,the two methods do give similar results, in at least some cases. When we9. Other bank functions, in declining order of importance, are trust (8 percent), credit cards ( 5percent), and other data services (4 percent). The remaining 5 percent includes nonbanking activities (e.g., insurance), nondeposit funds, and safe deposit.10. If the FCA data were not available, the value-added approach could be essentially replicated for any sample of banks by applying a statistical cost function to call report data. Thecoefficients of a regression of labor and capital expenses on the dollar volumes of assets andliabilities can substitute for the percentage of value added to determine the important bank outputsand their weights in an output index.11. In support of this presumption, Humphrey (1992) showed that a cost-share weighted average of the deflated deposit and loan balances used here yields approximately the same growth rateas does the BLS index of bank transactions for the 1980s.12. Comments by Frank Wykoff and Jack Triplett have helped us clarify our position on thisissue, which is essentially an application of Mamalakis (1987).
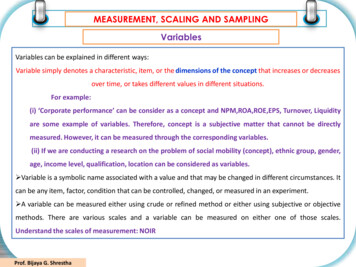
252Allen N. Berger and David B. Humphreyapply our value-added weights to the same group of banks for the same timeperiod (1984-88) as in Fixler and Zieschang (chap. 6 , this vol.), we obtain a7.6 percent annual growth rate, similar to their rate of about 8.8 percent.7.1.4 Implicit Revenues versus Explicit Revenues in BankingMuch of the disagreement surrounding the choice of bank outputs can betraced to the fact that bank services are not priced in the same manner asservices provided by other industries. In many cases, the pricing is implicitfor institutional and regulatory reasons.'? On the loan side, most of the revenue is explicit interest and fees. However, as discussed above, some implicitrevenue is raised by business borrowers holding additional idle demand balances with the bank. On the deposit side, revenues from the compensatingcomponent of deposit balances, defined as the bank's earnings owing to payment of below-market interest rates, dominate explicit revenues. l 4 As shownbelow, these implicit revenues currently account for over 80 percent of therevenue raised on deposits, although an unknown (but small) part of this figure is implicit revenue for loans.This suggests that in banking, unlike other industries, explicit revenues arean unreliable guide to determining outputs or service flows. If banks paidmarket rates on all deposits and charged explicit fees for all deposit services,then this large explicit revenue flow would be convincing evidence that deposits provide substantial service output. Thus, much of the controversy regarding the treatment of deposits as an input or an output arises because the explicit revenues on deposits are relatively small. Another problem with the useof revenue data is that the proportion of revenue that is explicit is not constant.The deregulation of bank deposits caused a significant increase over the 1980sin the proportion of revenues that were explicit, from 5 percent in 1980 to 1 1percent in 1984 to 18 percent in 1988.Table 7.2 illustrates these points, showing estimated breakdowns of depositrevenues and costs for 1988. The implicit revenue from deposit balances iscomputed as follows:(1)Implicit revenue (1-r,/r,,)[balance,. (1- RR,)] r,,where r, the average interest rate paid on balance j ; rFF the federal fundsrate (a market rate); balance, the value of thejth deposit balance; RR, the13. E.g., idle deposit balances for loan borrowers are negotiated on a case-by-case basis andprovide a way to adjust the loan price without altering a very visible and comparable interest rate.For depositors, regulation forbids interest on demand deposits and formerly put ceilings on otherdeposit rates as well. The use of indirect pricing, such as minimum balance requirements at belowmarket interest rates, also makes comparison shopping difficult.14. A below-market interest rate on a deposit is equivalent to a zero-rate compensating balanceon part of the deposits and a market rate on the remainder. E.g., if the actual rate paid is twothirds of the market rate, then the implied zero-rate compensating balance is one-third of the totaldeposit balance. For a demand deposit, which has a zero interest rate, the entire balance is compensating.
253Measurement and Efficiency in BankingTable 7.2Deposit Revenues and Costs for All U.S. Banks, 1988Source of Revenues and CostsRevenues:Value of compensating balances (implicit revenues)Demand depositsTime & savings depositsOther depositsTotal implicit revenuesExplicit revenues from fees on depositsTotal deposit revenueAllocated operating costs:Demand depositsTime & savings depositsOther depositsTotal operating costs allocated to depositsValue (in billionsof 1988 ce: Revenues are calculated from the call report and costs are allocated from the FCA data.See Berger and Humphrey (1990, appendix table AIA) for more details.reserve requirement on balance j ; and rTB the 90-day Treasury Bill rate, astandard-earnings credit rate applied to compensating balances. The first termin (1) compares the rate paid on deposits (r,) with the market rate (rFF)anddetermines the proportion of balance, that is purely compensating. This compensating component is then adjusted for nonearning required reserves (1 RR,) and evaluated using a standard earnings credit rate (rTB),giving the implicit revenue flow. The top half of table 7.2 shows the estimated implicit andexplicit revenues for deposits for all banks in the United States in 1988. Implicit revenues ( 41.9 billion) account for 82 percent of the 5 1.3 billion intotal deposit revenues. About two-thirds of the implicit revenue is generatedfrom demand deposits; one-third is generated by time and savings deposits.The bottom half of the table shows the allocation of operating costs to thedeposit categories using ratios of FCA costs for that year. The overall costestimate of 47.4 billion is just a little below the estimated revenues of 5 1.3billion. Note that the slightly higher revenues than costs may be expectedbecause some of the revenues from demand deposits are actually implicit revenues on loans.Two final conclusions are suggested by these data: First, the finding of alarge amount of total (implicit plus explicit) revenue on both demand depositsand time and savings deposits supports the finding under the value-added approach that both types of deposits have output characteristics. Under the assetapproach, neither of the deposit types is an output, and under the user costapproach as applied to date, usually only demand deposits are outputs.1s Sec15. An exception is Fixler and Zieschang (chap. 6, this vol.), who do not distinguish amongdeposit categories, but rather include all deposits and some other purchased funds in a singleoutput category.
254Allen N. Berger and David B. Humphreyond, if one uses procedures applied to other industries to measure gross outputin banking-namely, looking only at the explicit revenue flows-then depositoutput is understated by about 80 percent. Moreover, the shifts over time fromimplicit to explicit pricing can give the false impression that the level of bankoutput is increasing, even if total revenues (implicit plus explicit) and totaloutput may not have changed.7.2 Inefficiency and Cost Dispersion in BankingIf all banks are approximately equally efficient, as is assumed in most bankcost studies, then it is appropriate to examine technical change and productivity growth over time using the data from either all banks or from a representative sample. However, if banks are not close to being equally efficient, thencost function measures of technical change, such as in Hunter and Timme(1986), or measures of average productivity change, such as the BLS laborproductivity index, may confuse shifts in the minimum-cost technology withchanges in the dispersion of bank costs away from the minimum-cost technology. We try to separate these elements by forming a thick-frontier cost function for relatively low-cost banks. In this section, we examine inefficiency andcost dispersion away from this frontier; in the following section, we examinechanges in this frontier over time.Banking costs show a striking degree of dispersion. In many cases, bankshave costs that are several times higher than other banks with similar scale andproduct mix. This cost dispersion could be due to many factors, includingsimple inefficiency. Here, we estimate a thick-frontier cost function using datafrom banks in the lowest average cost quartile, compare it to a cost functionfor banks in the highest average co
Commercial banking is a very difficult service industry in which to measure output, technical change, or productivity growth. First, there is disagreement over which services banks produce and over how to measure them. In addi- tion, banking service