Transcription
Biomed Pap Med Fac Univ Palacky Olomouc Czech Repub. 2008, 152(2):223–230. J. Petrek223PICTORIAL COGNITIVE TASK RESOLUTION AND DYNAMICSOF EVENT-RELATED POTENTIALSJosef PetrekDepartment of Physiology, Faculty of Medicine and Dentistry, Palacky University, Olomouc, Czech Republice-mail: fesoj@tunw.upol.czReceived: July 22, 2008; Accepted: September 17, 2008Key words: Cognitive task/Personality traits/ERPAims: To judge whether and how the character of the visual stimulus and type of cognitive task affects brain eventrelated potentials (ERPs).Methods: ERPs to three types of visual stimuli (white blank oval on a dark background, unfolded cube and net ofsixteen small squares) were recorded from nine scalp sites and saved on a computer. Special software was used foroff-line analysis of the ERPs.Results: The presentation of each of the three visual stimuli used was followed by ERPs consisting of two negative(N160, N340) and one positive (P220) components. The character of the stimulus did not affect the latency of ERPscomponents. However, the type of visual stimuli affected the amplitude. The most conspicuous changes were shownby the N340 ERPs component. Its average amplitude in comparison with reference amplitude was always significantly higher during the first cognitive task (“Choose the cube that can be folded up from the unfolded cube!”) andsignificantly lower than reference amplitude during the second cognitive task (“Complete the missing part of a figurewith the appropriate item!”). It was also shown that subjective personality traits such as nervousness, spontaneousaggressivity and emotional lability had an influence on the recovery phase of the experiment affecting the averageamplitude of N340Conclusion: The results revealed that the cognitive processes underlying successful resolution of two pictorialcognitive tasks affected differently the activity of systems giving rise to visual ERPs.INTRODUCTIONEvent-related potentials (ERPs) are currently considered a good tool for the study of different aspects oflanguage processing and comprehension (see e.g.16, 37, 41).Their analysis also contributes significantly to knowledgeof neural processes that underlie a highly specific skill inhumans20, 37, the visual analysis of faces1, 4, 5, 12, 18, 19, 21, 24, 25,27, 32, 40, 43, 47or the processing of emotional stimuli13, 15, 26, 36,28, 44, 45. Therefore, it is not surprising that the recordingand analysis of ERPs affect all areas of cognitive neurosciences.In our recent study38 we used the ERP technique toanalyze the impact of an instant cognitive activity (selection of two identical pictures in a group of similar pictures) on the behaviour of ERPs to visual stimuli (drawingof living creatures or common objects). The dynamics ofthe spontaneous EEG was also observed39. It was shownthat the cognitive processes underlying successful selection of two identical pictures from a group of similarones affected both the amplitude N160 and N340 ERPscomponents and the characteristics of the event-relateddesynchronization.Taking into account the findings we decided to carryout an experiment with the aim of judging whether andhow the character of the visual stimulus and the type ofcognitive task can affect brain potentials or activity ofother functional systems. Therefore, special attention waspaid to: (a) the dynamics of ERPs components, (b) thecharacter of an ongoing EEG activity and (c) some autonomic (heart rate) and metabolic parameters (minuteventilation, oxygen consumption and carbon dioxide production).Answer to these questions will be given in severalpresentations. This project seeks an answer to the firstquestion.METHODSSubjectsFifteen right-handed female students from the MedicalFaculty of Palacký University in Olomouc participated inthe experiment. Records of only 12 were analysed – onefemale stopped the experiment at her own request and twosubjects were discarded because of a high artefact rate.All students were twenty-one-year old and they reportedtaking no medication and had no history of neurological, opthalmological or systemic disease. Their vision wasnormal or corrected to normal. Written informed consentwas obtained from all participants prior to the start ofthe experiment.StimuliThree types of 3500 ms long visual stimuli were used totest electrophysiological correlates of participants’ cogni-
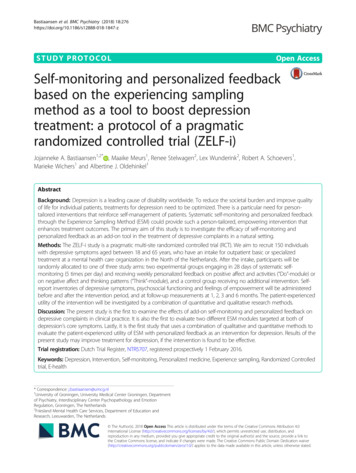
224tive activity. The first type of stimuli (white blank oval ona dark background) constituted the reference stimuli andtheir presentation did not require any cognitive activityon the part of the subject. The other two types (unfoldedcube and the net of sixteen small squares) representedthe test stimuli the presentation of which was followedby specific cognitive and motor activity. The test stimuliappeared in fifteen variants of which seven formed theunfolded cube (left half of Figure 1) and the remainingeight on the net of squares (right half of Figure 1). Thegraphic images for all variants of test stimuli were takenfrom the book of Carter and Russell7.A balanced 15 15 Latin square design was used toarrange blocks of test stimuli into an experimental sequence. The fifteen experimental sequences were createdaltogether – one sequence for each of participant. Eachof the fifteen sequences contained fifteen blocks of teststimuli (unfolded cube seven times, net of squares eighttimes), fifteen blocks of reference stimuli (white blankoval on a dark background) and fifteen warning stimuli (five asterisks in a white oval on black background)preceding each block of stimuli. The number of stimuliin blocks was as follows: each test block contained 160stimuli, each reference block only 10 stimuli.Besides fifteen experimental sequences, one practicesequence was created. However, this contained only oneblock of reference visual stimuli and one block of 100 teststimuli (cube and net of squares – fifty times each), whichdid not belong to any of experimental sequences.J. PetrekPresentation of stimuliSciWorks Version 5, Experimenter’s WorkBench32 Data Acquisition and Experiment Control Software(DataWave Technologies, Longmont, CO) was used tocontrol stimulus presentation, regulate the timing ofevents, and record the responses of participants. A photodiode was used to record the moment of a visual stimulusappearing on the screen. Each of the fifteen volunteerswas tested individually in a darkened, sound-attenuated,and electrically shielded room. During the experiment,the participant was seated in a comfortable chair approximately 120 cm in front of the computer screen (SONY,Model: SDM-X72). Sequences of visual stimuli were presented on a computer screen with resolution of 1024 768 pixels. A second monitor, located outside the testingroom, allowed the experimenter to view the stimulus presented on each trial.ProcedureThe experiment started with the presentation of thepractice sequence. After its completion the experimental sequence presentation was begun. At first 3500 mslong warning stimulus appeared on the screen. After 500ms after its termination, the first picture of a referenceblock stimuli appeared on the screen. Other pictures (10in sum) followed the first one with inter-stimulus intervalof 500 ms. In 500 ms after the tenth reference stimulusending ensued further warning stimulus. It signalled thebeginning of the presentation of the test block stimuli.The presentation of them (160 in sum) abided by theFig. 1. Example of the two types of test visual stimuli used in the experiment to initiate a prearranged cognitive activity – “unfolded cube” signalized the choice of the cube that can be folded up from the unfolded cube, “net ofsixteen small squares” the completion of missing part of the figure.Graphic images for all variants of test stimuli were taken from the Czech translation of a book by Carter andRussell (2002) and modified. Coloured pictures were presented.
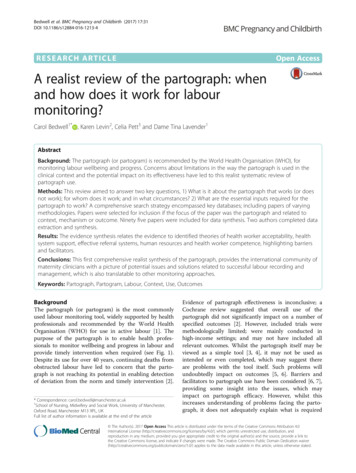
Pictorial cognitive task resolution and dynamics of event-related potentials225Fig. 2. Average amplitudes of N160, P220 and N340 (in AD/mV) to reference stimuli ( RE), to ”unfolded cubes”( FC/ RC) and to “nets of sixteen small squares” ( FS/ RS) during the cognitive task solving period (upper half) and during the rest period (lower half).Calibration: 40 AD/mV 1 μV; Black circles – average values; Vertical bars – 0.95 per cent confidenceintervals.same rules as the presentation stimuli of the referenceblock. The last stimulus of the test block was followed bya forty-second pause without any visual stimuli.After pause termination, the warning stimulus appeared on the screen again and the described procedurewas repeated once more with the next available blocks ofreference and test stimuli. The whole experiment lastedapproximately two hours.Before the experiment began, subjects were instructedto restrain from blinking, moving their eyes and swallowing during the presentation of the stimuli. They were alsoasked to focus on asterisks (warning stimulus) wheneverthey appear on the screen. Concurrently they were told tomodulate their next behaviour according to the characterof the visual stimulus that replaced the warning stimulus.When the warning stimulus replaced the white blankoval on black background (reference stimulus), the subjects merely viewed the stimulus appearing on the screen.On the other hand, when the warning stimulus replacedthe test stimulus of whichever block (unfolded cube ornet of sixteen small squares), the subjects had to solvethe preassigned cognitive task. This means that subjectshad to choose which cube from the offer can be foldedup from the presented net of a cube (the first cognitivetask) or they had to choose the satisfactory item from
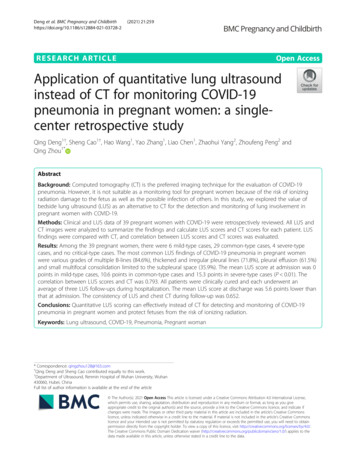
226J. PetrekFig. 3. Average amplitudes of N160, P220 and N340 (in AD/mV) to reference stimuli (triangles), to unfolded cubes(squares) and to nets of sixteen small squares (black circles) during the cognitive task solving period (left half,F) and during the rest period (right half, R) in different scalp recording sites (abscissa).Significant differences between averages (p 0.05] are encircled. Calibration: 40 AD/mV 1 μV; Verticalbars – 0.95 per cent confidence intervals.the offer to replenish the missing part of the figure (thesecond cognitive task).The result of task solving was announced aloud tothe experimenter and simultaneously a mouse button waspressed to measure the reaction time. If their choice wascorrect, the experimenter told them and at the same timeasked them to view only the stimuli appearing on thescreen without any cognitive activity. If their choice wasnot correct, they were asked to continue task solving untilthey were successful.Data acquisitionEEG was recorded from 9 scalp sites by tin electrodesattached to an elastic cap (Electro-Cap International,Eaton, OH). The electrodes were placed in scalp positions F3/4, CP5/6 (a crossing point between T3/4-P3/4and C3/4-T5/6), P3/4, O1/2 and Cz. One electrode wasalso placed at the outer canthus of the right eye to monitor eye movements. Scalp electrodes were referred tolinked earlobes. The ground electrode was placed at Fpz.Electrodes impedance was kept below 3 kΩ throughoutthe experiment.The EEG signal was amplified by the cascade of twoamplifiers (amplifiers EKe, OTE Biomedica, Firenze, andAmplifier Neuralynx, Tucson, Arizona) with bandpassof 0.01-100 Hz and continuously sampled at 256 Hz perchannel by an A/D converter; the resolution of the system is 0.122 μV/bit. The digitised records were saved onthe hard disk of a computer for later off-line replay andanalysis.After the end of the experiment all participants wereadministered the Freiburg Personality Inventory (FPI)
Pictorial cognitive task resolution and dynamics of event-related potentials(ref.30) in the modified version for Czech and Slovakpopulations.Data analysisSciWorks Version 5, DataWave CP Analysis Moduleand Data Editing Software were used for off-line analysisof EEG records. The analysis ran as follows: A visualelimination of distorted records, digital filtering of records(bandpass 1-30 Hz), cutting filtered records for averaging (the start points of the cut segment of EEG recordswere time-locked to photodiode signal) and detection ofERPs by averaging. Then maximal positive and negativeamplitudes from baseline, calculated by software usingthe first five points of the waveform, were measured intime windows 120-250 ms (N160 and P220) and 250-400ms (N340 ERPs component). StatSoft software package(StatSoft, Tulsa, OK) was used for statistic processing ofthe ERPs data.RESULTSThe presentation of each of the three visual stimuliused in our experiment (white blank oval on a dark background, unfolded cube or net of sixteen small squares)was followed by an event-related potential (ERP) consisting of two negative (N160, N340) and one positive (P220)components. The character of the stimulus did not affectthe latency of ERPs components but the latency was affected by the site of scalp recording electrode – the latencies were significantly shorter in occipital and parietalscalp sites than in frontal ones. However, the type of visualstimuli or rather the mental activity related to them markedly affected the amplitude of all ERPs components.Functional state of the brain and ERPs amplitudedynamicsThe average amplitudes of all visual ERPs componentsregistered during the solution of the firsta and the secondbcognitive task (upper half of the Figure 2) and also inthe rest periodc (bottom half of the Figure 2) differedfrom the average amplitudes of ERPs to reference stimuli.The ERPs component N340 illustrates this explicitly (seethe third column in Figure 2). In comparison with thereference amplitude (N340 RE), its amplitude was significantly higher during the solution of the first cognitivetask (N340 FC) than during the solution of the secondone (N340 FS). On the other hand, in the rest period,the average N340 amplitudes to both types of test stimuliwere significantly lower than the reference amplitude andthey did not show any significant differences.The average amplitudes of N160 and P
the test stimuli the presentation of which was followed by specifi c cognitive and motor activity. The test stimuli appeared in fi fteen variants of which seven formed the unfolded cube (left half of Figure 1) and the remaining eight on the net of squares (right half of Figure 1). The graphic images for all variants of test stimuli were taken