Transcription
Deng et al. BMC Pregnancy and -2(2021) 21:259RESEARCH ARTICLEOpen AccessApplication of quantitative lung ultrasoundinstead of CT for monitoring COVID-19pneumonia in pregnant women: a singlecenter retrospective studyQing Deng1†, Sheng Cao1†, Hao Wang1, Yao Zhang1, Liao Chen1, Zhaohui Yang2, Zhoufeng Peng2 andQing Zhou1*AbstractBackground: Computed tomography (CT) is the preferred imaging technique for the evaluation of COVID-19pneumonia. However, it is not suitable as a monitoring tool for pregnant women because of the risk of ionizingradiation damage to the fetus as well as the possible infection of others. In this study, we explored the value ofbedside lung ultrasound (LUS) as an alternative to CT for the detection and monitoring of lung involvement inpregnant women with COVID-19.Methods: Clinical and LUS data of 39 pregnant women with COVID-19 were retrospectively reviewed. All LUS andCT images were analyzed to summarize the findings and calculate LUS scores and CT scores for each patient. LUSfindings were compared with CT, and correlation between LUS scores and CT scores was evaluated.Results: Among the 39 pregnant women, there were 6 mild-type cases, 29 common-type cases, 4 severe-typecases, and no critical-type cases. The most common LUS findings of COVID-19 pneumonia in pregnant womenwere various grades of multiple B-lines (84.6%), thickened and irregular pleural lines (71.8%), pleural effusion (61.5%)and small multifocal consolidation limited to the subpleural space (35.9%). The mean LUS score at admission was 0points in mild-type cases, 10.6 points in common-type cases and 15.3 points in severe-type cases (P 0.01). Thecorrelation between LUS scores and CT was 0.793. All patients were clinically cured and each underwent anaverage of three LUS follow-ups during hospitalization. The mean LUS score at discharge was 5.6 points lower thanthat at admission. The consistency of LUS and chest CT during follow-up was 0.652.Conclusions: Quantitative LUS scoring can effectively instead of CT for detecting and monitoring of COVID-19pneumonia in pregnant women and protect fetuses from the risk of ionizing radiation.Keywords: Lung ultrasound, COVID-19, Pneumonia, Pregnant woman* Correspondence: qingzhou128@163.com†Qing Deng and Sheng Cao contributed equally to this work.1Department of Ultrasound, Renmin Hospital of Wuhan University, Wuhan430060, Hubei, ChinaFull list of author information is available at the end of the article The Author(s). 2021 Open Access This article is licensed under a Creative Commons Attribution 4.0 International License,which permits use, sharing, adaptation, distribution and reproduction in any medium or format, as long as you giveappropriate credit to the original author(s) and the source, provide a link to the Creative Commons licence, and indicate ifchanges were made. The images or other third party material in this article are included in the article's Creative Commonslicence, unless indicated otherwise in a credit line to the material. If material is not included in the article's Creative Commonslicence and your intended use is not permitted by statutory regulation or exceeds the permitted use, you will need to obtainpermission directly from the copyright holder. To view a copy of this licence, visit http://creativecommons.org/licenses/by/4.0/.The Creative Commons Public Domain Dedication waiver ) applies to thedata made available in this article, unless otherwise stated in a credit line to the data.
Deng et al. BMC Pregnancy and Childbirth(2021) 21:259BackgroundThe Coronavirus Disease 2019 (COVID-19) pandemichas lasted more than 1 year [1]. Unfortunately, it isunlikely that the pandemic will disappear soon. Up tonow, there are more than 100,000,000 confirmed casesand more than 2,500,000 deaths have been reportedworldwide, including many pregnant women [2, 3].Severe pneumonia and acute respiratory distress syndrome are the leading causes of death in COVID-19 patients. Timely and accurate evaluation of lung lesions isvery important in the treatment of patients withCOVID-19. Although chest computed tomography (CT)represents the gold standard to assess the evaluate lunglesions, it is not an ideal monitoring tool for pregnantpatients because of the risk of ionizing radiation to thefetus. In addition, transporting pregnant women to theradiology department for CT examination increases therisk of spread to health care providers.Lung ultrasound (LUS) offers a convenient, inexpensiveand radiation-free monitoring tool at the bedside. Many researches have highlighted the advantages of LUS in theevaluation of COVID-19 pneumonia in general population[4–6]. Whether the LUS manifestations of COVID-19pneumonia in pregnant women are characteristic comparedwith the general population, and whether LUS can be usedinstead of CT to evaluate and monitor the lung lesions inpregnant women during COVID-19 pandemic is the focusof many obstetricians. Some studies have shown that LUScan accurately evaluate lung lesions in pregnant womenwith COVID-19 [7–9]. However, some clinicians suggestedLUS images are non-specific and may mislead the treatment of pregnant women during COVID-19 [10, 11]. Theapplication of LUS in pregnant women with COVID-19 remains to be further studied. In this study, we retrospectivelyanalyzed the dynamic LUS findings of 39 pregnant womenin our COVID-19 center and explored the value of LUSinstead of CT for monitoring of COVID-19 pneumonia inpregnant women.MethodsThis study was approved by the clinical research ethicscommittee of Renmin Hospital of Wuhan University(No. WDRY2020-K031) and was carried out in accordance with The Code of Ethics of the World Medical Association. Data were collected and analyzed to facilitatebetter clinical decisions and treatment.Page 2 of 11respiratory syndrome coronavirus 2 (SARS-CoV-2)nucleic acid in samples of pharynx swabs. The other 10patients were clinically diagnosed with COVID-19. Theclinical diagnosis criteria were as follows: 1. Supportiveepidemiological history, including history of travel orresidence in Hubei province within 2 weeks prior to theonset of illness, contact with patients from Hubei province with fever and respiratory symptoms within 14 daysprior to onset, or presented with clustering onset; 2.Clinical manifestation, such as fever; normal or lowlevels of white blood cells or decreased lymphocytecounts at onset. 3. Imaging manifestation, whereby chestCT at an early stage shows the characteristics of multiplesmall patchy shadows and interstitial changes, which aremore prominent in the extrapulmonary bands, and multiple ground-glass opacities and infiltrations may developbilaterally with disease progression, with possible consolidation in severe cases.According to the Diagnosis and Treatment Guidelinesfor COVID-19 (7th edition) issued by the NationalHealth Commission of China, the severity of the diseasewas classified into 4 categories. Mild-type cases had mildclinical symptoms and no pulmonary changes on CT imaging. Patients with common-type disease had symptomsof fever and signs of respiratory infection with pneumonia changes on CT imaging. Severe-type cases presentedwith any one of the following: a. respiratory distress andrespiratory rate 30/min, b. fingertip blood oxygen saturation 93% in resting conditions, or c. arterial partialpressure of oxygen (PaO2)/oxygen concentration(FiO2) 300 mmHg(1 mmHg 0.133 kPa).Finally,critical-type cases met any one of the following criteria:a. respiratory failure requiring mechanical ventilation, b.shock, and c. ICU admission requirement due to multiple organ failure.Clinical characteristicsThe demographics and baseline characteristics that wecollected consisted of age, trimester of pregnancy, clinical signs and symptoms (such as fever, cough, shortnessof breath, chest pain, fatigue, and loss of appetite), bloodoxygen saturation and coexisting conditions. After thorough clinical assessment, blood samples were taken toevaluate white blood cells, neutrophils, lymphocytes, Creactive protein and procalcitonin.Study populationChest CT evaluationThirty-nine pregnant patients who were admitted to thehospital from January 28, 2020, to April 15, 2020, wereincluded in the study. In 29 patients, the diagnosis ofCOVID-19 was confirmed via real-time fluorescencereverse-transcription polymerase chain reaction (rRT–PCR), revealing positive detection of severe acuteThe extent of lung lesions was evaluated using theCT scoring system adopted by Pan et al [12] Each ofthe 5 lung lobes was visually scored from 0 to 5: noinvolvement, 0; 5% involvement, 1; 5–25% involvement, 2; 26–49% involvement, 3; 50–75% involvement, 4; and 75% involvement, 5. The total CT
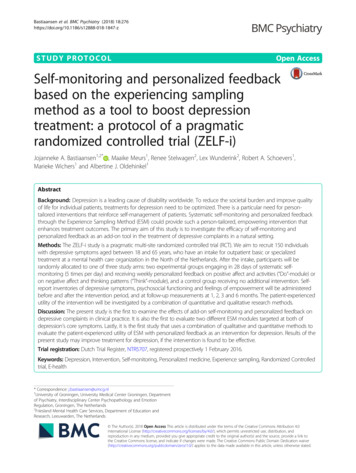
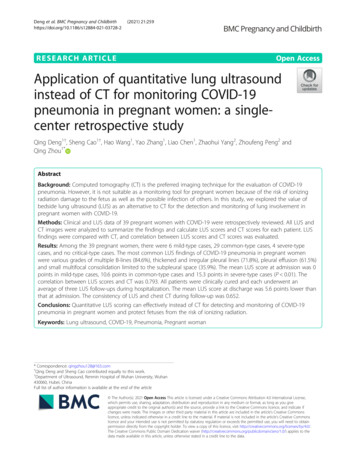
Deng et al. BMC Pregnancy and Childbirth(2021) 21:259score was the sum of the individual lobar scores(total score ranging from 0 to 25).Bedside LUS examinationThe machine used was a GE Vivid iq ultrasonography(GE Healthcare, China) equipped with a convex C1–5RS probe. The frequency was set at 3.5 MHz, the depthwas set at 10 cm, and the gain was adjusted to obtain thebest possible image. The bedside lung ultrasound examination was performed by a sonographer with 4 years’experience in LUS. According to the recommendationsof Dargent A et al. [13], the complete 12-zone LUSexamination was performed with patients in the supineor near-to-supine position. The chest wall was dividedinto 12 zones: 2 anterior zones, 2 lateral zones and 2posterior zones per side. The superior and inferior zoneswere divided by the third intercostal space. Videoclipswere recorded throughout the respiratory cycle for subsequent off-line analysis. The doctors were blinded tothe clinical data when analyzing the images.Each zone was scored according to the LUS pattern asfollows [6]: a normal lung pattern was identified by thepresence of normal lung sliding with A-lines or fewerthan two isolated B-lines and was scored as 0; the presence of 3 or more well-spaced B-lines presented in a single intercostal space was scored as 1; the presence ofcrowded B-lines with or without consolidation limited tothe subpleural space was scored as 2; and the presenceof confluent B-lines or a tissue pattern characterized bydynamic air bronchograms that was defined as lung consolidation was scored as 3. The schematic diagram is displayed in Fig. 1. The most severe ultrasound finding canbe considered representative of the entire zone, and themost severe ultrasound findings observed in each zonewere recorded. For each lung zone, a 0- to 3-point scorewas given (total score ranging from 0 to 36).To dynamically assess lung lesions, follow-up of bedside LUS was performed on all patients. Patients withLUS scores that had increased 2 points compared withprevious examination were defined as having diseaseprogression. Similarly, a reduction of 2 points in LUSscore compared with the previous examination was defined as improvement. Changes in LUS score within 1point were defined as no change.Inter- and intra-observer variability of LUSThe lung ultrasound images were analyzed and scoredby 2 doctors with 3 years’ experience in LUS. Two doctors were blinded to each other and the clinical data.Random ultrasound images of 20 examinations were analyzed by two independent observers to assess inter- andintra-observer variability. The two observers wereblinded to each other and neither of them were participated in the lung ultrasound examination. The intervalPage 3 of 11between two analyses performed by the same observerwas more than a month. Inter- and intra-observerconsistency were defined as the same images acquiredthe same lung ultrasound score.Statistical analysisContinuous numeric variables are expressed as the meanvalue standard deviation, and dichotomous variablesare expressed as the frequency number (%) or median[interquartile range]. Variables were compared amongthree groups using the Chi-square test. Correlationsbetween LUS scores and CT scores were analyzed usingthe Pearson coefficient if the data is normally distributed. A Kappa consistency check was applied to evaluatethe consistency of LUS and CT. Statistical significancewas defined at a level of P 0.05. All statistical tests wereanalyzed with SPSS software (version 20.0, SPSS Inc.,Chicago, USA).ResultsDemographic and clinical characteristicsThe demographic and clinical characteristics are shownin Table 1. The median age was 30 years (IQR: 27–32;range: 24–40 years). Of the 39 patients, 27 (69.2%) werein the third trimester of pregnancy, 8 (20.5%) were inthe second trimester, and 4 (10.3%) were in early pregnancy. Regarding clinical manifestations, fever (46.2%),cough (33.3%), diarrhea (18.0%) and fatigue (18.0%) werethe most prevalent. There were 16 patients without obvious clinical symptoms. Of the 39 patients, there were 6mild-type cases, 29 common-type cases and 4 severetype cases. Nine patients (23.0%) presented with pregnancy complications, including 3 with gestational hypertension (7.7%), 2 with chronic nephritis (5.1%), 2 withgestational diabetes mellitus (5.1%), and 2 withthrombocytopenia (5.1%). During hospitalization, 21(53.9%) and 18 (46.2%) patients exhibited a reduction inlymphocytes and elevated levels of C-reactive protein,respectively. Three severe-type cases had decreased oxygen saturation, whereas oxygen saturation was normal inthe other cases.Clinical outcomeTwenty-six patients were given low flow oxygen therapy.None of the patients used mechanical ventilation orwere sent to the ICU. Fifteen patients had normally progressing pregnancies. One patient had a spontaneousabortion at 6 weeks of gestation. Twenty-three patientsgave birth during their hospitalization. Among the 23puerperae, 1 had a natural birth; the other children wereall delivered by cesarean section. Except for one neonatewho had an Apgar score of 7 (1 5 min), the Apgarscores of the other neonates were 9 10 (1 5 min).The nucleic acid tests of all the children were negative.
Deng et al. BMC Pregnancy and Childbirth(2021) 21:259Page 4 of 11Fig. 1 Schematic diagram of the lung ultrasound protocol and the scoring system. Each lung was separated into six quadrants: anterior, lateraland posterior zones were separated by the anterior and posterior axillary lines, with each zone divided into upper and lower portions by thethird intercostal space. a A normal lung pattern was identified by the presence of a clear pleural line (indicated by green triangular arrowheads)and A-lines (marked with green thin arrows), scored as 0; b a small number of B-lines (marked with orange thin arrows), scored as 1; c-d thepresence of crowded B-lines (indicated by orange thin double arrow) or consolidations limited to the subpleural space (marked with orange thickarrow), scored as 2; e-f the presence of confluent B-lines (indicated by red thin double arrow) or mass consolidation with dynamic airbronchograms (marked with red thick arrow), scored as 3. Thickened, irregular and interrupted pleural lines are indicated by orangetriangular arrowheadsAs of April 25th, 2020, all patients were cured and discharged from the hospital; no cases deteriorated into thecritical type, and there were no deaths. The dischargecriteria were as follows: (1) body temperature returnedto normal for more than 3 days; (2) respiratory symptoms improved obviously; (3) pulmonary imagingshowed obvious absorption of inflammation; and (4) nucleic acid tests were negative twice consecutively usingrespiratory tract samples such as sputum and nasopharyngeal swabs (sampling interval being at least 24 h).The average hospitalization time was 14 days (IQR: 9–23 days; range: 5–41 days).Chest CT characters and scoresAll patients underwent CT examination before admission. The median interval from CT examination tohospital admission was 1.5 days (range: 0 3 days).The CT characteristics and lesion distribution beforeadmission are summarized in Table 2. CT examination revealed no abnormalities in the 6 mild-type
Deng et al. BMC Pregnancy and Childbirth(2021) 21:259Page 5 of 11Table 1 Clinical characteristics of pregnant women with COVID-19Patient informationAge, yearsAllPatients(n 39)Disease typeMild (n 6)Common (n 29)Severe (n 4)P value30 (27–32)29 (27–31)30 (27–32)30 (28–31)0.867Early trimester4 (10.3%)1 (16.7%)3 (10.4%)00.711Second trimester8 (20.5%)07 (24.1%)1 (25.0%)0.431Third trimester27 (69.2%)5 (83.3%)19 (65.5%)3 (75.0%)0.750Time from illness onset to hospital admission, days9 (7–11)8 (6–11)9 (7–11)110.846Fever, n (%)18 (46.2%)1 (16.7%)13 (44.8%)4 (100.0%)0.027Cough, n (%)13 (33.3%)1 (16.7%)8 (27.6%)4 (100.0%)0.015Diarrhea, n (%)7 (18.0%)1 (16.7%)4 (13.8%)2 (50.0%)0.196Sore throat, n (%)6 (15.4%)04 (13.8%)2 (50.0%)0.139Fatigue, n (%)7 (18.0%)04 (13.8%)3 (75.0%)0.023Shortness of breath, n (%)5 (12.8%)02 (6.9%)3 (75.0%)0.005Chest pain/tightness, n (%)4 (10.3%)01 (3.5%)3 (75.0%)0.004No signs or symptoms16 (41.0%)4 (66.7%)12 (41.4%)00.134Signs and symptomsPregnancy complicationsGestational hypertension, n (%)3 (7.7%)1 (16.7%)2 (6.9%)00.600Chronic nephritis, n (%)2 (5.1%)02 (6.9%)1 (25.0%)0.334Gestational diabetes mellitus, n (%)2 (5.1%)02 (6.9%)1 (25.0%)0.334Thrombocytopenia, n (%)2 (5.1%)02 (6.9%)01.00012 (30.8%)1 (16.7%)8 (27.6%)3 (75.0%)0.150Neutrophils increased ( 6.3 10 /L)17 (43.6%)2 (33.3%)12 (41.4%)3 (75.0%)0.561Lymphocytes decreased ( 1.1 109/L)21 (53.9%)1 (16.7%)16 (55.2%)4 (100.0%)0.046Laboratory testsLeucocytes increased ( 9.5 109/L)9C-reactive protein increased ( 5.0 mg/L)18 (46.2%)2 (33.3%)13 (44.8%)3 (75.0%)0.442Procalcitonin level increased ( 0.1 μg/L)12 (30.8%)1 (16.7%)9 (31.0%)2 (50.0%)0.529Oxyhemoglobin saturation, %96 (95–98)98 (97–98)96 (95–97)92 (91–93)0.001Decreased oxygen saturation ( 93%)3 (7.7%)003 (75.0%)0.000Each value represents the median (interquartile range) or the number (%)cases, and the other 30 patients had lung lesions. Themost frequent CT findings were ground-glass opacity(29/39), followed by pleural effusion (19/39) and consolidation (16/39). Among the 33 patients with positive lung CT findings, 26 (76.9%) cases had bilateraland multifocal involvement and 31 cases (93.9%) hadperipheral involvement. In common-type cases, anaverage of 2.9 lobes were involved; in severe-typecases, 4.8 lobes were involved. The mean CT scorewas 6.6 points in common-type cases and 11.7 pointsin severe-type cases.During hospitalization, all pregnant women refused tohave CT follow-up before delivery. After delivery, 23 patients underwent repeat CT examination. Comparedwith the condition before admission, CT follow-upshowed that the lung lesions had improved in 20patients and had become aggravated in 3 patients.Bedside LUS findings and scoresThe first LUS was performed within 24 h of admission. The LUS acquired positive findings in 34 patients. The most common LUS findings of COVID-19pneumonia in pregnant women were increased B-linesto different degrees (33/39), thickening and irregularity of the pleural line (28/39), pleural effusions (24/39), and small multifocal consolidation limited to thesubpleural space (14/39). Mass consolidations withdynamic air bronchograms were not found in thisstudy. Most patients showed involvement of 5 6zones. The mean LUS score was 0 points in mildtype cases, 10.6 points in common-type cases and15.3 points in severe-type cases. The LUS findingsand scores are displayed in Table 3.The data of LUS scores and CT scores on admission isnormally distributed. Pearson correlation analysis
Deng et al. BMC Pregnancy and Childbirth(2021) 21:259Page 6 of 11Table 2 Lung CT of pregnant women before admissionAllPatients(n 39)Disease typeMild (n 6)Common (n 29)Severe (n 4)P valueLung CT findingsNormal6 (15.4%)6 (100.0%)000.000Ground glass opacification29 (74.4%)025 (86.2%)4 (100.0%)0.000Consolidation16 (41.0%)012 (41.4%)4 (100.0%)0.004Crazy-paving pattern11 (28.2%)08 (27.6%)
and radiation-free monitoring tool at the bedside. Many re-searches have highlighted the advantages of LUS in the evaluation of COVID-19 pneumonia in general population [4–6]. Whether the LUS manifestations of COVID-19 pneumonia in pregnant women are characteristic co