Transcription
UBS House View Weekly — 3 February 2020Regional view - United StatesHow to maximize growthJustin WaringRisk management is important, but over the longterm missing out on potential growth can causefar more damage than market volatility. Hereare some tools for tapping into the power ofcompounding to help you build significant wealth.Investment Strategist AmericasIf you invest USD 100 and it grows 7.2%a year, how much will it be worth after10 years? How about after 20 years, or30 years?This isn't a trick question, but there isa trick to answering it without openinga spreadsheet or calling your financialadvisor: a shortcut called The Rule of 72.Here's how it works: Take the number72 and divide it by your expected return,and it will tell you about how many yearsit will take for your wealth to double. Inthis example, 72 divided by 7.2% givesa "doubling time" of 10 years. So after10 years, the USD 100 investment wouldgrow to USD 200, and then USD 400 byYear 20, USD 800 by Year 30, and so on.This demonstrates a concept calledcompounding, which works—and defiesmental arithmetic—because it operateson a feedback loop. Growth in Year 1 isjust USD 7.20 (7.2% of USD 100), but inYear 2 the first year's growth also grows,resulting in a Year 2 appreciation of USD7.72 (7.2% of USD 100 plus 7.2% ofUSD 7.20), which then contributes toYear 3 growth, and so on.Even after years of researching marketsand calculating performance figures,I still need to rely on The Rule of 72or grab my calculator. That's true formost people, partly because exponentialgrowth is a type of trend that we rarelyencounter in everyday life—which is alittle ironic, since it is literally the mathof life. For example, cells divide bydoubling: 1, 2, 4, 8, 16, and so on—butI digress.for your lifetime—it might be spent in 40or 50 years. If you've already fully fundedyour Longevity strategy, the dollar mightnot be spent until decades after you'regone; it might even live a longer life thanyou do.The life of a dollarWe spend a lot of time thinking aboutrisk management and addressingpossible dangers to our financial wellbeing. Those are valuable conversations,but they aren't equally relevant foreach dollar in our portfolios. This isone of the key reasons why we viewinvestment decisions through the lens ofan investor's timeline of financial goals,using the Liquidity. Longevity. Legacy.(3L) framework.Tips for getting rich less slowlyOf course, dollars are fungible, so this isa matter of perspective. In addition, lifeis bumpy, so you might need to tap intoyour portfolio contributions earlier thanthis. On the other hand, it's also truethat much of your retirement spendingwill likely be funded out of "growthdollars," not the original saved dollars.As a thought experiment, think aboutthe first dollar you were able to save, andthen the last dollar you will spend duringyour lifetime. If that is the same dollar,it probably has "life expectancy" of 60years, or even 80 years, from the timeit is born (saved) until it dies (is spent).Eighty years allows for a lot of doublingtimes. At a 7.2% average rate of return—and this a 10-year doubling time—thisworks out to USD 256 per USD 1 saved.Now think about the last dollar thatyou will save just before you retire. Ifthat dollar is going into your Longevitystrategy—the funds you've earmarkedThis report has been prepared by UBS Financial Services Inc. (UBS FS).Please see important disclaimers and disclosures at the end of the document.The bulk of investment success—and theratio or your earned versus grown dollars—is determined by three main variables:1. The dollars you are able to saveSaving is the opposite of spending, anddeveloping a habit of frugality—stayingoff of what economists call "the hedonictreadmill"—means that you're likely tomaintain a more affordable lifestyle laterin life. This reduces the amount that youwill need to fund retirement spending,giving you the option of either retiringearlier or investing capital in your Legacystrategy—building wealth for futuregenerations and your philanthropic goals—instead.1
As we discuss in Doubling time and theRule of 72, the math of compoundingcan be supercharged when we considera "living portfolio." If you are able tosave an increasing amount each year,you can effectively boost your portfolio'sgrowth rate. Saving enough to add2% to your portfolio's value each yearbecomes harder later in life—as yourinvestment returns begin to competewith your salary—but if you can manageit, you can effectively add another 2% toyour investment return.3L disclaimer: Timeframes may vary. Strategiesare subject to individual client goals, objectives,and suitability. This approach is not a promise orguarantee that wealth, or any financial results, canor will be achieved.This report has been prepared by UBS Financial Services Inc. (UBS FS).Please see important disclaimers and disclosures at the end of the document.2
2. How early you begin investingIt's a cliché, but starting to save early isan immensely powerful step. By savingearly, you increase the "life expectancy"of your earned dollars, begin populatingyour portfolio with growth dollars, andstart the magic of compounding.3. The growth rate of yourinvestmentsWhen it comes to maximizing the longterm growth of your investments, thebest place to start is to consider anall-equity strategy. If a dollar in yourportfolio has a "life expectancy" of morethan 30 years, there's historically beenno more consistent way to maximize itsexpected growth than investing in a welldiversified stock index.On the other hand, all-equity strategiesare prone to periods of drastic lossesand increase the risk of bad timing. Inaddition, starting with the maximumlevel of risk robs you of the potential totake advantage of market corrections,or to add value through portfoliomanagement strategies like rebalancingand tax-loss harvesting, which canthemselves improve returns and enhanceafter-tax growth potential. A welldiversified portfolio of stocks, especiallythose with exposure to secular trends—like our Longer Term Investment (LTI)themes—can be essential in providingmore consistent and robust returns.Adding fixed income might not soundlike a way to boost growth, but it canenhance results substantially. In the last50 years, an 80% stock, 20% bondportfolio would have delivered 95%of an all-equity portfolio's annualizedreturn, with 20% less realized volatilityand significantly milder and more shortlived losses during bear markets (seeFig. 4 of the Bear market guidebook).Adding potential rebalancing and lossharvesting opportunities, an 80/20portfolio should outperform an all-equityportfolio often—especially in difficultmarket environments—thus improvingthe likelihood of significant wealthcreation.We would also recommend harnessingthe illiquidity premium by addingalternative investments—especiallyprivate equity—to the portfolio. Inexchange for accepting the additionalcomplexity, time horizon, and illiquidityof private markets, we expect investorsto earn, on average, about 1-3% peryear more than they would receive inpublic markets.3L disclaimer: Timeframes may vary. Strategiesare subject to individual client goals, objectives,and suitability. This approach is not a promise orguarantee that wealth, or any financial results, canor will be achieved.Last, but not least, you can boostportfolio growth by incorporatingleverage into their investment strategy.As we discuss in Why borrow if you'realready wealthy?, debt and leveragehave a bad reputation, but when usedprudently they can enhance returns. Thisapplies at the portfolio level, but canalso be considered when implementingindividual asset classes; utilizing optionsstrategies and structured investments canbe a useful tool for enhancing returns,especially when markets are pricing inbad news, selling you upside exposure ata discount.These return-enhancement strategiesare especially relevant for your Legacystrategy assets that aren't earmarkedfor specific spending or bequest goals.They will also often be appropriate foryour Longevity strategy dollars, especiallyif you are still in your working years,or if you've fully funded your Liquiditystrategy—cash, bonds, and borrowingcapacity—with enough resources to paythe bills for three to five years in the caseof a bear market.At the end of the day, even if these stepsonly provide a 1% boost to the 7.2%expected return that we used as anexample, it would cut the doubling timefrom 10 years to 8.8 years, increasing thenumber of doubling times for that "80year dollar" from 8 to 9.1—and thus itsfuture value from USD 256 to USD 547!This report has been prepared by UBS Financial Services Inc. (UBS FS).Please see important disclaimers and disclosures at the end of the document.3
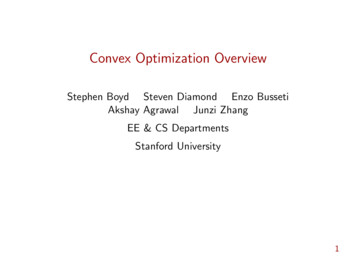
Strategy and performanceTAA and market returns–8 –6 –4–202468Asset classTacticalDeviationin %*CashAnnualized total return in %Total return in %1–week 1–month0.0YTD1–Year0.020.130.132.335–Year 10–Year**1.180.66Barclays Capital US Treasury –Bills [1–3 M]BenchmarkBarCap US Agg GovernmentFixed Income–3.0US Gov't FI–5.00.922.422.428.902.343.12US 10 year Treasury0.01.493.713.7112.132.134.34US Treasuries (long)0.02.247.077.0722.473.707.83 2.00.882.102.109.232.403.41US Municipal FI0.00.371.801.808.653.534.47BarCap Municipal BondUS IG Corp FI0.00.582.342.3413.994.295.39BarCap US Agg CreditUS HY Corp FI0.0–0.260.030.039.405.997.43BarCap US Agg Corp HYInt'l Developed FI0.01.010.760.763.952.151.61BarCap Global Agg xUSUS TIPSBloomberg Barclays US TreasuryBellwethers 10 YearICE U.S. Treasury 20 YearsBond IndexBarclays US Treasury InflationNotes IndexEM FI30.0–0.120.560.568.234.245.0450% BarCap EM Gov and 50%BarCap Global EM (USD)EM FI - Local Currency0.0–0.66–0.43–0.435.152.433.38BarCap EM GovEM FI - Hard Currency0.00.421.541.5411.316.056.70BarCap Global EM (USD)Equity 3.0Global Equity0.0–2.54–1.10–1.1016.048.509.14MSCI ACWIUS All cap0.0–2.10–0.11–0.1120.5311.8313.80Russell 3000US Large cap Growth0.0–1.812.242.2427.9415.4715.97Russell 1000 GrowthUS Large cap Value0.0–2.32–2.15–2.1514.888.6911.86Russell 1000 ValueUS Mid cap0.0–2.42–0.80–0.8016.899.4913.47Russell Mid CapUS Small cap0.0–2.89–3.21–3.219.218.2211.87Russell 2000Int'l Developed Markets0.0–2.50–2.09–2.0912.105.125.75MSCI EAFEJapan0.0–1.58–1.36–1.3611.206.916.23MSCI Japan 3.0–5.09–4.66–4.663.814.483.77MSCI 73N/ABlooomberg Commodity IndexYield Assets0.0Senior –10.70–7.493.53US Real Estate0.0–1.601.211.2114.116.0712.66EM Equity*Tactical deviation is for moderate nontaxable without alternative investments model, see House View Investment Strategy Guide for details.**As of last month end***EM FI refers to a 50%/50% blend of local and hard currency bondsSource: UBS, as of 31 January 2020S&P 500 forecastCIO GWMJune 2020 price targetUSD 3400December 2020 price targetUSD 34002019E earnings per share estimateUSD 164.02020E earnings per share estimateUSD 174.0Source: UBS, as of 31 January 2020S&P/LSTA U.S. Leveraged Loan100 IndexBofA Merrill Lynch Fixed RatePreferred Securities IndexAlerian MLP Total ReturnFTSE NAREIT Equity REIT Index
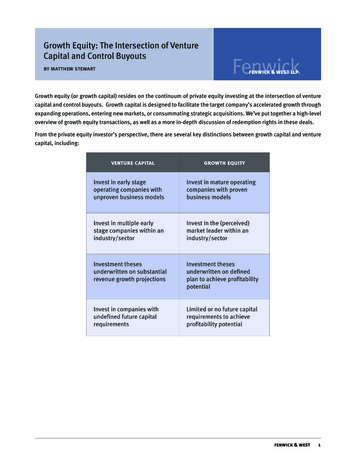
Strategy and performanceTAA and market returns: US equity sectorsTotal return in %–3–2–10123Annualized total return in unication Services 1.0–2.990.920.9221.338.3410.68S5TELS IndexConsumer Discretionary 1.00.150.630.6316.7313.9517.57S5COND IndexConsumer Staples0.0–0.780.360.3621.758.6212.27S5CONS 172.57S5ENRS 2.07S5FINL IndexHealth Care0.0–3.24–2.72–2.7212.119.4314.37S5HLTH 13.49S5INDU Index–1.0–2.163.963.9646.0722.0618.97S5INFT 0S5MATR IndexReal Estate0.0–1.821.421.4218.106.5311.95S5RLST Index–1.00.856.656.6530.2911.1813.08S5UTIL Index–2.10–0.04–0.0421.6712.3513.95SPX IndexSectorInformation TechnologyUtilitiesS&P 5005–Year 10–Year**BenchmarkNote: Tactical deviations are intended to be applicable to the US equity portion of a portfolio across investor risk profiles.**As of last month endSource: UBS, as of 31 January 2020Market movesS&P 500DJIANasdaqNikkei 225Level1–w chg3,226–2.10%YTD %23,205–2.60%–1.90%Eurostoxx 503,641–3.66%–2.62%MSCI EM1,062–5.09%–4.66%MSCI World2,342–2.19%–0.58%MSCI EAFE1,994–2.50%–2.07%DXY97–0.47%1.04%Gold 1589/oz1.12%4.74%Brent crude oil 58.2/bbl–4.17%–11.88%US 10-year yieldVIX1.51%–18 bps–41 bps18.8 4.3 pts 5.1 ptsSource: Bloomberg, as of 31 January 2020Note: All returns are in local currency* As of intraday 30 January 2020Tactical time horizon is approximately six months.Total return market performance is from Bloomberg as of close of business on source date, using representative indices, and is provided for information only.Past performance is no indication of future performance. –Indicates /– changeTerms and abbreviationsYTD year-to-date.TAA tactical asset allocation.
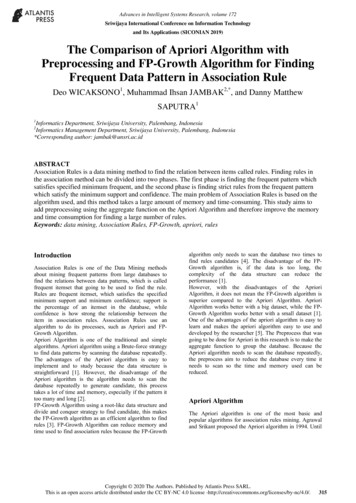
Earnings calendarThe Earnings Calendar provides publicly announced reporting dates and times of companies covered by Chief Investment OfficeGWM. Reporting dates and times are subject to change by the reporting 0Alexandria Real Estate Equities, Inc.AREAlphabet, Inc.GOOGL04-Feb-2020Cummins, Inc.CMIEQM Midstream Partners LPEQMLennox International, Inc.LII04-Feb-2020Simon Property Group, Inc.SPGConocoPhillipsCOPThe Walt Disney Co.DIS04-Feb-2020Plains All American Pipeline LPPAAPlains All American Pipeline LPPAAZayo Group Holdings, Inc.ZAYO05-Feb-2020AvalonBay Communities, Inc.AVBCognizant Technology Solutions Corp.CTSHFMC Corp.FMC05-Feb-2020MetLife, Inc.METQUALCOMM, Inc.QCOMSuncor Energy, Inc.SU06-Feb-2020Macerich Co.MACThe Est (R)e Lauder Companies, Inc.ELPhilip Morris International, Inc.PM06-Feb-2020Yum! Brands, Inc.YUMIntercontinental Exchange, Inc.ICELions Gate Entertainment Corp.LGF.A06-Feb-2020Take-Two Interactive Software, Inc.TTWOFortinet, Inc.FTNT07-Feb-2020Cboe Global Markets, Inc.CBOESource: FactSet, UBS, as of 31 January 2020Key economic indicatorsDateIndicatorPeriodTime (ET)UnitConsensusPrevious3-Feb-20Construction SpendingDec10:00 AMm/m0.4%0.6%3-Feb-20ISM ManufacturingJan10:00 AMlevel48.047.24-Feb-20Factory OrdersDec10:00 AMm/m0.7%–0.7%5-Feb-20ADP Employment ChangeJan08:15 AMlevel155k202k5-Feb-20Trade BalanceDec08:30 AMlevel– 46.0b– 43.1b5-Feb-20ISM Non-ManufacturingJan10:00 AMlevel55.055.06-Feb-20Unit Labor Costs4Q P08:30 AMq/q0.9%2.5%6-Feb-20Nonfarm Productivity4Q P08:30 AMq/q1.7%–0.2%7-Feb-20Nonfarm PayrollsJan08:30 AMlevel153k145k7-Feb-20Private PayrollsJan08:30 AMlevel150k139k7-Feb-20Unemployment RateJan08:30 AMlevel3.5%3.5%7-Feb-20Average Hourly EarningsJan08:30 AMm/m0.3%0.1%7-Feb-20Average Weekly Hours All EmployeesJan08:30 AMlevel34.334.3Source: Bloomberg, UBS, as of 31 January 2020UBS forecast estimates are published on Friday evenings in Economic Perspectives by economists employed by UBS Investment Research, a part of UBS Investment Bank.m/m month–over–month. q/q quarter–over–quarter. y/y year–over–year. k thousand. mn million. b billion. P preliminary. F Final.
Non-Traditional AssetsNon-traditional asset classes are alternative investments that include hedge funds, private equity, real estate, and managed futures (collectively, alternative investments). Interests of alternative investment funds are sold only to qualified investors,and only by means of offering documents that include information about the risks, performance and expenses of alternative investment funds, and which clients are urged to read carefully before subscribing and retain. An investment in an alternative investmentfund is speculative and involves significant risks. Specifically, these investments (1) are not mutual funds and are not subject to thesame regulatory requirements as mutual funds; (2) may have performance that is volatile, and investors may lose all or a substantialamount of their investment; (3) may engage in leverage and other speculative investment practices that may increase the risk ofinvestment loss; (4) are long-term, illiquid investments, there is generally no secondary market for the interests of a fund, and noneis expected to develop; (5) interests of alternative investment funds typically will be illiquid and subject to restrictions on transfer; (6)may not be required to provide periodic pricing or valuation information to investors; (7) generally involve complex tax strategies andthere may be delays in distributing tax information to investors; (8) are subject to high fees, including management fees and otherfees and expenses, all of which will reduce profits.Interests in alternative investment funds are not deposits or obligations of, or guaranteed or endorsed by, any bank or other insureddepository institution, and are not federally insured by the Federal Deposit Insurance Corporation, the Federal Reserve Board, or anyother governmental agency. Prospective investors should understand these risks and have the financial ability and willingness toaccept them for an extended period of time before making an investment in an alternative investment fund and should consider analternative investment fund as a supplement to an overall investment program.In addition to the risks that apply to alternative investments generally, the following are additional risks related to an investment inthese strategies: Hedge Fund Risk: There are risks specifically associated with investing in hedge funds, which may include risks associated withinvesting in short sales, options, small-cap stocks, “junk bonds,” derivatives, distressed securities, non-U.S. securities and illiquidinvestments. Managed Futures: There are risks specifically associated with investing in managed futures programs. For example, not all managers focus on all strategies at all times, and managed futures strategies may have material directional elements. Real Estate: There are risks specifically associated with investing in real estate products and real estate investment trusts. Theyinvolve risks associated with debt, adverse changes in general economic or local market conditions, changes in governmental, tax,real estate and zoning laws or regulations, risks associated with capital calls and, for some real estate products, the risks associatedwith the ability to qualify for favorable treatment under the federal tax laws. Private Equity: There are risks specifically associated with investing in private equity. Capital calls can be made on short notice, andthe failure to meet capital calls can result in significant adverse consequences including, but not limited to, a total loss ofinvestment. Foreign Exchange/Currency Risk: Investors in securities of issuers located outside of the United States should be aware that evenfor securities denominated in U.S. dollars, changes in the exchange rate between the U.S. dollar and the issuer’s “home” currencycan have unexpected effects on the market value and liquidity of those securities. Those securities may also be affected by otherrisks (such as political, economic or regulatory changes) that may not be readily known to a U.S. investor.Emerging Market InvestmentsInvestors should be aware that Emerging Market assets are subject to, amongst others, potential risks linked to currency volatility,abrupt changes in the cost of capital and the economic growth outlook, as well as regulatory and socio-political risk, interest rate riskand higher credit risk. Assets can sometimes be very illiquid and liquidity conditions can abruptly worsen. CIO GWM generally recommends only those securities it believes have been registered under Federal U.S. registration rules (Section 12 of the Securities ExchangeAct of 1934) and individual State registration rules (commonly known as “Blue Sky” laws). Prospective investors should be aware thatto the extent permitted under US law, CIO GWM may from time to time recommend bonds that are not registered under US or Statesecurities laws. These bonds may be issued in jurisdictions where the level of required disclosures to be made by issuers is not as frequent or complete as that required by US laws. For more background on emerging markets generally, see the CIO GWM EducationNotes, Emerging Market Bonds: Understanding Emerging Market Bonds, 12 August 2009 and Emerging Markets Bonds: Understanding Sovereign Risk, 17 December 2009. Investors interested in holding bonds for a longer period are advised to select the bondsof those sovereigns with the highest credit ratings (in the investment grade band). Such an approach should decrease the risk that aninvestor could end up holding bonds on which the sovereign has defaulted. Sub-investment grade bonds are recommended only forclients with a higher risk tolerance and who seek to hold higher yielding bonds for shorter periods only.
UBS Chief Investment Office's ("CIO") investment views are prepared and published by the Global Wealth Management business of UBSSwitzerland AG (regulated by FINMA in Switzerland) or its affiliates ("UBS").The investment views have been prepared in accordance with legal requirements designed to promote the independence of investmentresearch.Generic investment research – Risk information:This publication is for your information only and is not intended as an offer, or a solicitation of an offer, to buy or sell any investment orother specific product. The analysis contained herein does not constitute a personal recommendation or take into account the particularinvestment objectives, investment strategies, financial situation and needs of any specific recipient. It is based on numerous assumptions.Different assumptions could result in materially different results. Certain services and products are subject to legal restrictions and cannotbe offered worldwide on an unrestricted basis and/or may not be eligible for sale to all investors. All information and opinions expressed inthis document were obtained from sources believed to be reliable and in good faith, but no representation or warranty, express or implied,is made as to its accuracy or completeness (other than disclosures relating to UBS). All information and opinions as well as any forecasts,estimates and market prices indicated are current as of the date of this report, and are subject to change without notice. Opinions expressedherein may differ or be contrary to those expressed by other business areas or divisions of UBS as a result of using different assumptions and/or criteria.In no circumstances may this document or any of the information (including any forecast, value, index or other calculated amount ("Values"))be used for any of the following purposes (i) valuation or accounting purposes; (ii) to determine the amounts due or payable, the price orthe value of any financial instrument or financial contract; or (iii) to measure the performance of any financial instrument including, withoutlimitation, for the purpose of tracking the return or performance of any Value or of defining the asset allocation of portfolio or of computingperformance fees. By receiving this document and the information you will be deemed to represent and warrant to UBS that you will notuse this document or otherwise rely on any of the information for any of the above purposes. UBS and any of its directors or employees maybe entitled at any time to hold long or short positions in investment instruments referred to herein, carry out transactions involving relevantinvestment instruments in the capacity of principal or agent, or provide any other services or have officers, who serve as directors, eitherto/for the issuer, the investment instrument itself or to/for any company commercially or financially affiliated to such issuers. At any time,investment decisions (including whether to buy, sell or hold securities) made by UBS and its employees may differ from or be contrary to theopinions expressed in UBS research publications. Some investments may not be readily realizable since the market in the securities is illiquidand therefore valuing the investment and identifying the risk to which you are exposed may be difficult to quantify. UBS relies on informationbarriers to control the flow of information contained in one or more areas within UBS, into other areas, units, divisions or affiliates of UBS.Futures and options trading is not suitable for every investor as there is a substantial risk of loss, and losses in excess of an initial investmentmay occur. Past performance of an investment is no guarantee for its future performance. Additional information will be made available uponrequest. Some investments may be subject to sudden and large falls in value and on realization you may receive back less than you invested ormay be required to pay more. Changes in foreign exchange rates may have an adverse effect on the price, value or income of an investment.The analyst(s) responsible for the preparation of this report may interact with trading desk personnel, sales personnel and other constituenciesfor the purpose of gathering, synthesizing and interpreting market information.Tax treatment depends on the individual circumstances and may be subject to change in the future. UBS does not provide legal or tax adviceand makes no representations as to the tax treatment of assets or the investment returns thereon both in general or with reference to specificclient's circumstances and needs. We are of necessity unable to take into account the particular investment objectives, financial situation andneeds of our individual clients and we would recommend that you take financial and/or tax advice as to the implications (including tax) ofinvesting in any of the products mentioned herein.This material may not be reproduced or copies circulated without prior authority of UBS. Unless otherwise agreed in writing UBS expresslyprohibits the distribution and transfer of this material to third parties for any reason. UBS accepts no liability whatsoever for any claims orlawsuits from any third parties arising from the use or distribution of this material. This report is for distribution only under such circumstancesas may be permitted by applicable law. For information on the ways in which CIO manages conflicts and maintains independence ofits investment views and publication offering, and research and rating methodologies, please visit www.ubs.com/research. Additionalinformation on the relevant authors of this publication and other CIO publication(s) referenced in this report; and copies of any past reportson this topic; are available upon request from your client advisor.Important Information about Sustainable Investing Strategies: Sustainable investing strategies aim to consider and incorporateenvironmental, social and governance (ESG) factors into investment process and portfolio construction. Strategies across geographiesand styles approach ESG analysis and incorporate the findings in a variety of ways. Incorporating ESG factors or Sustainable Investingconsiderations may inhibit the portfolio manager’s ability to participate in certain investment opportunities that otherwise would beconsistent with its investment objective and other principal investment strategies. The returns on a portfolio consisting primarily of sustainableinvestments may be lower or higher than portfolios where ESG factors, exclusions, or other sustainability issues are not considered bythe portfolio manager, and the investment opportunities available to such portfolios may differ. Companies may not necessarily meethigh performance standards on all aspects of ESG or sustainable investing issues; there is also no guarantee that any company will meetexpectations in connection with corporate responsibility, sustainability, and/or impact performance.Distributed to US persons by UBS Financial Services Inc. or UBS Securities LLC, subsidiaries of UBS AG. UBS Switzerland AG, UBS Europe SE,UBS Bank, S.A., UBS Brasil Administradora de Valores Mobiliarios Ltda, UBS Asesores Mexico, S.A. de C.V., UBS Securities Japan Co., Ltd, UBSWealth Management Israel Ltd and UBS Menkul Degerler AS are affiliates of UBS AG. UBS Financial Services Incorporated of Puerto Rico isa subsidiary of UBS Financial Services Inc. UBS Financial Services Inc. accepts responsibility for the content of a report prepared bya non-US affiliate when it distributes reports to US persons. All transactions by a US person in the securities mentioned in thisreport should be effected through a US-registered broker dealer affiliated with UBS, and not through a non-US affiliate. Thecontents of this report have not been and will not be approved by any securities or investment authority in the United Statesor elsewhere. UBS Financial Services Inc. is not acting as a municipal advisor to any municipal entity or obligated person withinthe meaning of Section 15B of the Securities Exchange Act (the "Municipal Advisor Rule") and the opinions or views containedherein are not intended to be, and do not constitute, advice within the meaning of the Municipal Advisor Rule.
External Asset Managers / External Financial Consultants: In case this research or publication is provided to an External Asset Manageror an External Financial Consultant, UBS expressly prohibits that it is redistributed by the External Asset Manager or the External FinancialConsultant and is made available to their clients and/or third parties.For country disclosures, click here.Number 06/2019. CIO82652744 UBS 2020.The key symbol and UBS are among the registered and unregistered trademarks of UBS. All rights reserved.
are some tools for tapping into the power of compounding to help you build significant wealth. This report has been prepared by UBS Financial Services Inc. (UBS FS). Please see important disclaimers and disclosures at the end of the document. 1 If you invest USD 100 and it grows 7.2% a year, how much will it be worth after 10 years?