Transcription
All rights reserved. No part of this work may be reproduced or transmitted in any form or byany means, electronic or mechanical, including photocopying and recording, or by anyinformation storage or retrieval system without the prior written permission of the copyrightowner unless such copying is expressly permitted by federal copyright law.ISBN 0-934-3SO-36-8Published by TRADERS PRESS, INC.The material contained herein is not to be taken as advice to buy or to sell specific securities.The information presented is based on sources we believe to be reliable and has been carefullychecked for completeness and accuracy but cannot be guaranteed.TRADERS PRESSI N C O R P O R A T E DPO BOX 6206Greenville, SC 29606Books and Giftsfor Investors and Traders800-927-8222Fax com
TABLE OF CONTENTSPrefaceIntroductionClues from the CosmosHarmonic and Vibratory NumbersGeometric Characteristics of a Price ChartThe Primary PatternsClassical Chart Patterns Using Ratios and ProportionThe "Butterfly" PatternThe Opening PriceEntry TechniquesAppendicesAdditional Readings
Books and Giftsfor Investors and TradersPublishers of:Commodity Spreads: A Historical Chart Perspective (Dobson)The Trading Rule That Can Make You Rich* (Dohson)Viewpoints of a Commodity Trader (Longstreet)Commodities: A Chart Anthology (Dobson)Profitable Grain Trading (Ainsworth)A Complete Guide to Trading Profits (Paris)Traders Guide to Technical Analysis (Hardy)The Professional Commodity Trader (Kroll)Jesse Livermore: Speculator-King (Sarnoff)Understanding Fibonacci Numbers (Dobson)Wall Street Ventures & Adventures through Forty Years (Wyckoff)Winning Market Systems (Appel)How to Trade in Stocks (Livermore)Stock Market Trading Systems (Appel & Hitschler)Study Helps in Point and Figure Technique (Wheelan)Commodity Spreads: Analysis, Selection and Trading Techniques (Smith)Comparison of Twelve Technical Trading Systems (Lukac, Brorsen, & Irvvin)Day Trading w i t h Short Term Price Patterns and Opening Range Breakout (Crabel)Understanding Bollinger Bands (Dobson)Chart Reading for Professional Traders (Jenkins)Geometry of Stock Market Profits (Jenkins)Please write or call for our current catalog describing these and many other books and gifts of interesinvestors and traders.1-800-927-8222FAX .com
This bookis dedicated to Benida.You are the reason I am still here toenjoy all of my friends and family. Everyonedeserves to have someone love them this much in a lifetime.
PREFACEOver the past 20 years the use and misuse ofthe Fibonacci Summation Series proliferatedto the point that commentators on the nation'sTV business channels now present themselves as resident experts. 1 lay no claim tobeing an expert. However, my studies alwaysincluded an extensive e x a m i n a t i o n of Fibonacci numbers. My pragmatic position onanything I learned is t h a t it I could not usewhat I was studying to help in trading, then Iwas not interested in pursuing it any further.If this m a t e r i a l s t i m u l a t e s your interest in thesubject, then introducing you to it w i l l beworthwhile. A word of caution, this materialis based on the probabilities of trading. Theart of trading is one of risk management.Amos Hosteller, one of the founders of Commodity Corporation in Princeton, New Jersey, used to say, "take care of losses and theprofits will take care of themselves." 1 referto this quote a lot because it is very important!The pattern recognition methodology illustrated in the text will be of interest to anyonewho ever traded using technical charts. I cansay with confidence there arc very few whoresearched patterns to the extent I have. Someof the references date back to the early 1900's.Each of these patterns is based on ratio andproportion. A technical chart is nothing morethan a road map with a price and time axis.These patterns repeat w i t h a great deal ofregularity. My best students have been airline pilots. They seem to approach tradinglike they approach flying, following a flightplan. The similarities to trading are numerous.Finally, one of my goals in writing this bookis to expose you to the subject of ancient geometry. Fibonacci numbers are an integralpart of the numbers that make up the subjectof ancient geometry. It w i l l be of interest tosome of you that many of these sacred ratiostrace their origin to the cosmos. 1 w i l l notspend a significant amount of t i m e relatingmy experiences in astro-harmonics research.The subject is too vast for me to consider.More importantly, it is not necessary for profitable trading.
INTRODUCTIONLeonardo de Pisa de Fibonacciand Beyond21, 34, 55, 89, 144 to infinity. Dividing onenumber by the next after the eighth sequenceyields 21/ 34 .618. This just happens to beOn the eastern seaboard about an hour's drive the relationship of the height of the Greatfrom Florence, Italy lies the town of Pisa. It Pyramid to 1/2 its base. This additive series ofwas here that Fibonacci was born. He was a numbers is based on the equationthirteenth century m a t h e m a t i c i a n who primarily worked for the royal families of Italy. Thework for which he is most famous is theLibre Abaci (Book of Calculations). Hisaward for t h i s work was the present dayequivalent of the Nobel Peace Prize. Fibonacci was largely responsible for the useof arithmetic numbers versus Roman numerals. Before Fibonacci, the number 30 waswritten XXX. After his Libre Abaci, it waswritten 30.Phi 1 Phi squaredLegend describes his journey to Egypt as one (0 1 02).of great discoveries. He went to Egypt to Base 2.00study the mathematical relationships con- Half Base 1.00tained in the pyramids.Height .618Slope 1.618Those of you who really want to study themath contained in the pyramids should readPeter Thompkin's book The Secret of the Diagonal 1.902 V(2.618 1)Great Pyramids. It is not my intention to explore all of the geometry in the pyramids, onlythe Fibonacci Summation series. Fibonaccifound this series when he studied the GreatPyramid at Giza. The series is the sum of thetwo previous numbers 0, 1, 1, 2, 3, 5, 8, 13,
What Fibonacci did for me was to open myeyes! These are the relationships that areconstantly in the market. I first startedusing Fibonacci numbers in 1974 at theurging of John Hill, Sr. of the CommodityResearch I n s t i t u t e of Hendersonville NorthCarolina. I read all of lilliott's papers andhis correspondence w i t h Charles Collins.Years later, Frost and Prechter wrote thebook Elliott Wave Theory, which explainedthe wave structure and the use of Fibonaccinumbers. It concerned me that not all thewaves were .382, .500, .618, 1.618. It wasnot u n t i l 1988 that I began using the squareroot numbers of the Fibonacci series SQ(.618) .786 and SQ(1.618) 1.27. Armed w i t hthese two square root relationships, thewave structure can be more easily explained. Bryce Gi1more's first book,Geometry of Markets brought the ratios tothe public's attention. The Elliott WaveNewsletter never used these ratios. I usedto fax information to them on the squareroot numbers, but they never responded.Robert Miner of the Dynamic TradersCroup in Tucson, Arizona, uses all of theharmonic ratios. It is my opinion that hisnewsletter and technical work is the best inour business. If you don't have the time todo the work, Robert Miner, one of the besttechnicians on this planet, w i l l do it for youat a small monthly cost. This reminds meof one of my favorite quotes from myfriend and fellow trader, Jim Twentyman"Defy Human Nature—Do the work yourself."What this book is going to do is illustratehow to use the Fibonacci ratios, theirsquare roots, and their reciprocals to determine the structure of wave vibrations. Ofall the books I have in my library, none ofthe Elliott Wave material covers this import a n t concept. I am going to keep it assimple as possible. If you can glean onlyone or two concepts or patterns, then thismaterial w i l l not have been written in vain.I can promise you this much. II you studythe ratios and patterns shown here, you w i l lrealize that markets have a d e f i n i t e patternhidden within their chaos. Sorting throught h i s chaos can e n l i g h t e n you. The goal hereis not to try to predict the f u t u r e or even toknow what is going to happen n e x t . No oneknows that! (Well, there is One who knows,but He doesn't trade.) It is not necessary toknow what is going to happen in 5 days.What is necessary is to determine howmuch risk and profit potential is availablein the next 5 days. Probability is the nameof the game. Risk control is of tantamountimportance. Winners think in terms of howmuch they can lose. Losers focus on howmuch they can win. "Take care of yourlosses and the profits will take care ofthemselves." —A.B.H.By end of the book, I hope you see thecorrelation of geometric patterns to theratios and proportions illustrated. It is goingto be as simple as I can make it for you.Should you want more elaborate readingmaterial it w i l l be listed in the bibliography.
Bryce Gilmore and Robert Miner werediscussing T-Bonds. They both came upw i t h different Elliott Wave counts. Theyhumbly admitted that they were both right!And these are two of the best technicians Ihave ever met. Bryce introduced the t e c h n i cian to the true geometry of the market,with his software program and book, WaveTrader . I count him as one of my veryOne more thought about the square rootn u m b e r from the golden mean. These n u m - good friends and 1 w i l l always be indebtedbers were first revealed in W i l l i a m Garrett's to him. A l t h o u g h E l l i o t t Wave devoteesmay cringe at this thought, you need not beincredible book The Torque Analysis ofoverly concerned with wave labeling, butStock Market Cycles. This is hands downthe square roots and t h e i r reciprocals cant h e best book on cycles I ever read. Therego a long way to a n a l y s e a wave in the t r u ewere only 200 copies sold in 1972. Theremainder were destroyed by Prentice Hall Elliott sense.due to lack of interest. The book has rec e n t l y been republished by R u f f P u b l i s h i n g U s u a l l y , when I w r i t e about a s u b j e c t . 1include the works of other authors. 1(509-448-6739). An excellent choice forthought about doing this for a long t i m e butevery library.decided to leave the m a t t e r alone. There areThere are a lot of charts in this book. Igreat many technicians all over the worldwho could and should be mentioned here.know of no other way to illustrate theseconcepts. Charts were selected from allThere are even more private traders ofareas, from commodities to the Dow Jones equal or greater skill that no one ever hearsStocks. Several different time frames wereabout. It is out of respect for these unSelected because these patterns are found in known artists that I w i l l refrain from menall time frames.tioning names. I would have left someoneout anyway and if it would have been aDo not be disappointed if you do not seefriend of mine-—well, you know the feelthe traditional Elliott Wave pattern labeling. ing!It is not neccesary when you use short termpattern recognition. What is important isThe material presented here is not to bethe ratio and proportion of each wave,considered as a trading system. It cannotfrankly, I never felt too comfortable aboutstand alone. It is an approach to trading theexactly identifying the precise Elliott Wave markets. Judgement and discipline arecount. This was brought to my attentionnecessary. And if they can be mastered, themost v i v i d l y several years ago at my tradtrader has the potential for financial freeing house in Pismo Beach, California.dom. True f r e e d o m can only come withdiscipline.The material here has proved exciting tome and my fellow traders who also subscribe to this approach to the market. In myopinion, it answers the question "can therehe order in I he chaos of the market?" Iwish I had known t h i s much about themarket 20 years ago!
A CLUE FROM THE COSMOSIn the s u m m e r of 1986, my good friend andmentor, Dr. R u t h M i l l e r sent me a note. 'Thenote stated that October soybean oil wouldgo off the board at 14 cents/lb and begin ahuge bull market. I posted the note to mytrading monitor and forgot about it u n t i lOctober. After October soybean oil went offthe board near the exact price she predicted, I gave her a call. She s t i l l lived inI n d i a n a and had a soybean and corn farming operation. Her husband was my firstsoybean hedge account when I was a broker at Drexel Burnham. During our phoneconversations, R u t h revealed to me that shehad unearthed (pardon the pun) some incredibly accurate cycles. She said that theywere based on planetary movements. Herexcitement caused me to be on the nextplane to Indiana for a two week tutorial thatwould change my l i f e forever. Two weekswith her is comparable to a parish priesthaving the same time with the Pope. Hereare just some of the things that came out ofthat two week stunt at her farm.1. Astrocycles Newsletter was formed. Itappeared in more than 22 foreign countries and every state in the union. Five ofthe G7 countries subscribed.2. Three books on financial astrology werewritten over the next six years.a) Astro-Cycles - The TradersViewpointb) Planetary Harmonics ofSpeculative Marketsc) Harmonic Vibrations3. One hundred and fifty traders came toPismo Beach, California to learn whatmethodology I used. Most of them ares t i l l in contact w i t h me.4. I gave lectures to thousands of traders inthe United States and 8 foreign countries.5. FNN (now CNBC) invited me regularlyas a guest to discuss the planetary cyclesin the newsletter.6. The Pesavento Index was developed atDr. Miller's urging. It is now a d a i l y partof the Commodity Traders Almanac published by Frank Tauscher of Tulsa.OklahomaThe index rates each day by the numberof planetary cycles occurring exactly onthat date. The average is eight cycles perday. When there are three or less, markets have a strong tendency to changetrends. The same is true when there are13 or more.I studied a great many approaches to themarket over the past thirty years and this
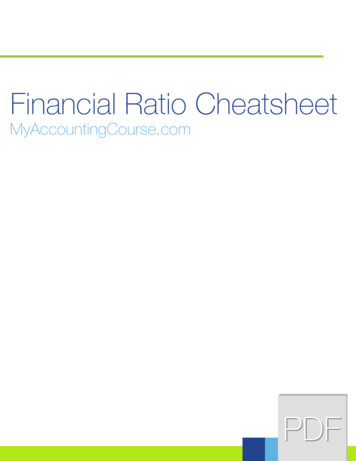
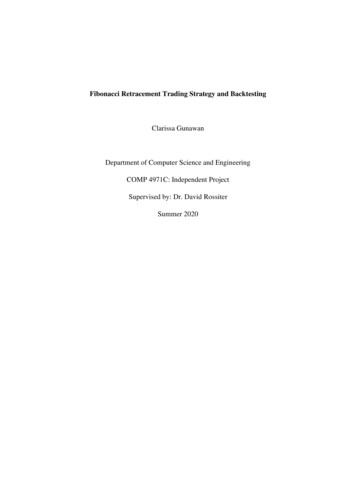
ary trader W.D. Gann was an avid proponent of astrology, as was Bernard Baruch.Baruch's comment that "millionaires don'tuse astrology, hid billionaires do" alwaysfascinated me. He employed his own fulltime astrologer/astronomer, EvangelineAdams. What really drew me closer to thesubject were some of my earlier readings.Both Albert Einstein and Isaac Newtonwere both avid astrologers/astronomers.Once, at a very important meeting, Newtonwas debating the subject with JohannKepler, the father of modern physics. Aftera heated exchange Newton remarked "thedifference between us, dear sir, is that it isquite apparent that I have studied the subject matter extensively and you have not!"The first cycle Ruth revealed to me was theVenus-Uranus cycle. She knew I had studied Fibonacci extensively and my interestwas guaranteed. Venus takes 255 days tocircle the earth and pass through the 360 aspects with Uranus. If you divide 255 by365 the result is approximately .618 of ayear. Since this was the golden mean, Ibecame very excited.Each year there arc 12 or more hard aspectsof Venus and Uranus. A hard aspect is oneof 30 or multiples thereof:Fortunately, I had stock market data goingback to 1896. All I needed to do was get theVenus-Uranus aspects for all the years from1896 to 1986. Those 90 years gave memore than 1000 samples of the VenusUranus aspects. Jim Twentyman, my goodfriend and fellow trader at CommodityCorporation, helped me with this studyunder Ruth's watchful eye.The research on the Venus-Uranus aspectyielded excellent results. It now has morethan 100 years of data and the statisticshave held up. The accuracy of timing 3 to 8day moves in the stock market is trulyamazing. Stocks seemed to be pulledupward or downward by this cycle into thedate of the aspect.PLANETARY ASPECTS USED IN TRANSITS
The Commodity Traders Almanac lists these aspects as they occur throughout each year.
Astrology is a big business throughout theworld. Many people plan their lives aroundit. Most religions banned astrology as ascience at the Council of Constantinople in552 A.D. This is why although Vaticanvaults contain the finest astrological materialever written, they are inaccessible to thepublic. My interest in astrology was purelypragmatic. I was searching for the "HolyGrail" of trading. What I did find wereseveral tools that work far above average.But 1 do believe the markets are vibrating tothe tune played by the planets. My reasonfor this is based on the work of DonaldBradley. Bradley wrote a book StockMarket Predictions in 1947. The book wasbased on forecasting the stock market oneyear in advance by weighting each of theplanets (cycles). Bradley's model is rightabout 70% of the time in showing the trendof the market for the entire year. Thisincludes some amazing predictions such asthe market fall of October 19, 1987, and thebig upmove following the attack of Iraq in) 1990. The January 1994 stock market surgeperformed perfectly to the Bradley model.The remarkable part of the model is that itcan be completed years in advance and ituses the weighting of the planets as its soledata source. I know of no other technicalsystem that can or will do that.I know these patterns with ratios and proportion quite well and how their source is inthe cosmos. I perform very little astrological research at this time. These patternsallow you to put probabilities in yourfavor and control risk easily. That iswhat the trader needs at his fingertips.
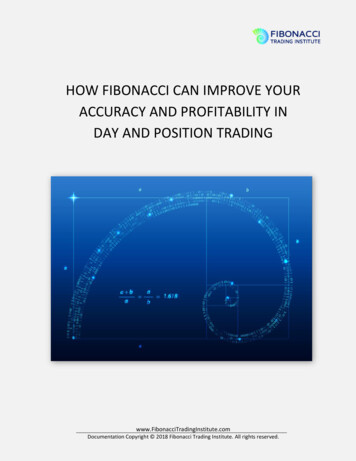
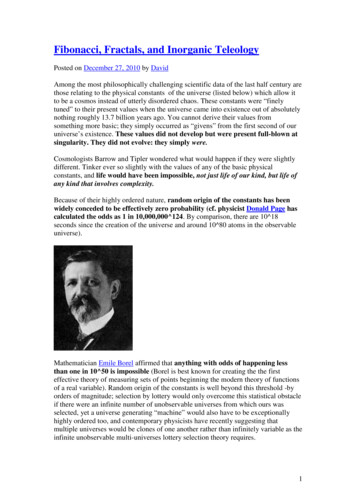
Harmonic and Vibratory NumbersI included the section on Harmonic andoffices so we could talk without using theVibratory numbers early in this book so the phone. Jim had just moved from Contireader w i l l begin to think in terms of repeti- Commodities where he was a very successful broker/trader. He was now helping metions and swings.manage my C.T.A. firm, A.V.M. AssociReluctance to share some of their mostates. J i m purchased a Wang computer inprecious trading secrets is probably inher1977 to do research on cycles and numbers.He also took a two year sabbatical to studyent in all traders. I am no exception. Whatyou will observe in this chapter is, in mythe works of the legendary trader W.D.Gann.opinion, one of the best kept secrets intechnical analysis. These harmonic, orvibratory numbers as I refer to them, can be I had access to the library of the InvestmentCenter Bookstore in West Los Angeles.incredibly useful for profit projection andstop placement. Every commodity, stock, or This library had the finest collection ofbooks I had ever seen. Any book I everspeculative instrument has its own vibratory number. It is as natural as each eleheard about was there, including rare astrological books and old technical books fromment on a chemical chart having its ownthe 1920s and 1930s. Once you go throughnumber. Traders who specialize in tradingthis vintage material you w i l l realize thereone speculative vehicle use these numbersall the time. They don't know why, exceptis not a lot that is new to technical analysis.that they repeat day after day. The next few Most assuredly there are new concepts andpages and charts will describe these numideas, but most material can be traced backbers and illustrate their usage. Make noto earlier traders. I think you will agree thatthe concept of harmonic or vibratory n u m mistake about this section: it could be oneof the most effective tools you can use as a bers fits into the "new idea" bracket.trader.The easiest way to describe why harmonicMy first interest in these harmonic or vibra- numbers work the way they do is to use antory numbers occurred in 1979 while I was analogy. Suppose you were to drop a rockinto a pool of water. Once the rock hits theoperating the commodity department forwater, waves will vibrate from the center ofDrexel Burnham Lambert in southernimpact until the thrust of the rock h i t t i n gCalifornia. Jim Twentyman was workingwith me and occupied the adjoining office. the water dissipates. There are four thingsthat will determine the consistency andA small window was located between the
duration of the waves: 1) The height fromwhich the rock was dropped; 2) The weightof the rock; 3) The depth of the water. (Secillustration below.)Markets react to thrust in much the same way.Typically, anew announcement or scheduledeconomic report will cause this thrust in thespeculative markets. Currently, the financialmarkets respond to Gross Domestic Product,employment data, both the Producer Price Index and Consumer Price Index, plus manyothers. Veteran traders remember vividly howthe Money Supply numbers of M1 and M2would shock the markets each week. Nowyou must search to find these economic numbers. Soon a new leader of economic fundamentals will emerge and the current leaderswill take their place in the history books.Jim Twentyman has an obsession with correct data. Me has the best data I have everseen. It is flawless! What Jim and I did wasto categorize all the price swings over a fivem i n u t e bar chart in all major commodities.The S&P data was done in 1985. We enteredeach of these into the Wang computer byhand. The computer would then search forvalues of the price swing and report the frequency distribution of each price swing.When the distribution is skewed you wouldget a Poisson distribution and your first hintof a harmonic or vibratory number. It was thenapparent that the only way you could provethis theory was to look at thousands of chartsto see if the premise was valid. We tested theidea and found it statistically accurate andquite useful in technical analysis.Technicians will agree that chart analysis istantamount to reading a road map. There isan X axis and a Y axis. Chartists depict the Xaxis for time and the Y axis for price. Oncethe coordinates are found, you know the exact spot where price and time meet. This information is not going to tell you what willhappen next. Nothing can do that! What it doestell you is that a pattern may be completed atthat time. The neural network I am using doesjust that; and harmonic numbers help withthis estimation. It has categorized these patterns in time and price. As a trader, I mustdecide when to enter and exit the market. Thisis what trading is all about. I then ask myselftwo questions: 1) Is the pattern and ratio signal present? and 2) Can I afford to take therisk? If the answer to both of these questionsis "yes," then I must take the trade. No one
S&PThe S&P 500 has a total of fiveharmonic numbers—three primary and twosecondary numbers. Secondary harmonicnumbers are important in strongly trendingmarkets. Primary harmonic numbers are:270, 350, 540. Secondary harmonic numbers are: 170, 110.Treasury BondsTreasury Bonds havea harmonic number of 20. When TreasuryBonds exceed 20 ticks they will most oftenproceed to 40 ticks. In strongly trendingmarkets multiples of the tick harmonicshould be expected (i.e., 2 x 20, 3 x 20,4 x 20).SilverThe harmonic numbers for Silverare 18 cents and 36 cents. The secondharmonic is 12 cents.WheatThe harmonic numbers in Wheatare 17 cents and 11 cents. Multiples of 17and 11 will appear in strongly trendingmarkets.SoybeansThe harmonic numbers inSoybeans are 18 cents and 36 cents.GoldThe harmonic numbers in Goldare 17 and 11.Swiss Franc and DeutschemarkTheharmonic numbers for the Swiss Franc andDeutschemark are 27 and 54 points. TheSwiss Franc has a secondary harmonicnumber of 81 points (27 54).Crude OilThe harmonic numbers forCrude Oil are 44 and 88 points.Dow Jones IndustrialsThe DowJones Industrials have a total of three harmonic numbers: two primary (35 and 105)and one secondary (70).
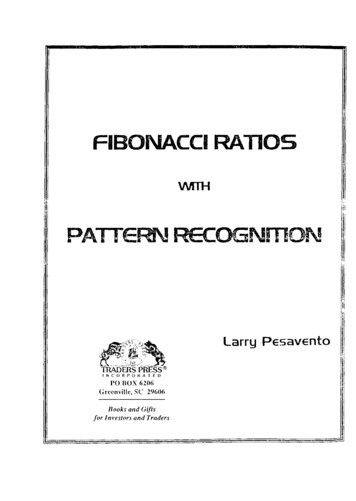
The Geometric Characteristics of a Price ChartTechnicians use price charts to interpret what the next move is most likely to be. Let usconsider the following:A price chart is a square
Geometric Principles(by Bryce Gilmore)Philosophical GeometryAncient philosophers taught pupils the artsof SACRED GEOMETRY in order todevelop their faculty of INTUITION.the Earth and Moon and their combinedmovements around the Sun. The pyramiddemonstrates the binding relationshipsbetween the SQUARE, CIRCLE and theGOLDEN MEAN.Geometry attempts to recapture the orderlymovement from an infinite formlessness toan endless interconnected array of forms,and in recreating this mysterious passagefrom ONE to TWO, it renders it symbolically viable.The practice of Sacred Geometry is one ofthe essential techniques of self-development.Geometry deals with pure form, and philosophical geometry reenacts the unfolding ofeach form out of the preceding one.The Canon of ProportionThe binding natural law of mathematics aswe know it today ORIGINATES from theCOSMOS. It was not invented by man, justrevealed to him through his study of thePlanets.The Seventh wonder of the ancient world,the Great Pyramid of Giza, holds within itsstructure all the math "secrets" we need toknow.The pyramid is a graphic representation ofModern day scientific studies have (amongother things) confirmed the measurementsof the Moon and the Earth.The radius of the Moon is 1090 miles andthe radius of the Earth is 3960 miles. Acombined total of 5040 miles (Plato's mystical number and in calendar days equal to720 weeks, 2 times 360, 3 times 240, 4times 180, 5 times 144, and 8 times 90).A square encompassing a circle representing the Earth has four sides, each equal tothe diameter of the Earth, i.e., 3920 by 2 or7920 miles. The perimeter of this squarecalculates to 31680 miles (4 times 7920, 44times 720, 88 times 360, 132 times 240,176 times 180, 220 times 144, and 352times 90).
If the Moon and the Earth were placed side The radius of the circle 5040 (1080 3960)by side, the distance between the two cenas a factor of the Earth's radius is equal toters would be equal to the sum of the radii, 5040:3960 or 1.2727:1.000. And 1.272 isi.e., 3920 plus 1080, which equals 5040mathematically the square root of 1.618.miles. A circle drawn using the combinedradii of 5040 would have a circumference ofSquaring the Circle2 Pi R or 2 x 22/7 x 5040, which equals31680.The relationship of the circle's circumference to the square's perimeter is1.000:1.000.A hypotenuse calculation for a right-angledtriangle using the 5040 radius of the abovecircle and half the side of the above square,i.e., the radius of the Earth 3960, would givethe following result.Using the Pythagorean theorem, i.e., thelength of the hypotenuse in a right triangle(90 degree triangle) will be equal to thesquare root of the sum of the squares of theother two sides.Hypotenuse square root [(5040 x 5040) (3960 x 3960)] 6409 miles.This geometric exercise is known as squaring the circle. Pi is the Pythagorean measureof 22/7 used to calculate the dimensions in acircle or sphere. In decimal form Pi is theirrational number 3.14159.If we call the base of the triangle the Earth'sradius, i.e., 3960, then the hypotenuse6409.6 as a ratio of the base 3960 is6409:3960 or 1.618:1.000.
The irrational number 1.272 is the squareroot of 1.618, i.e., 1.272 Harmonic Ratios from the SquareThe Diagonal of the Square(Root 2 1.4142)It can be demonstrated by this exercisewhere the designers of the Great Pyramid of The square is bounded by four equal sides atGiza procured their measurements. It canright angles to each other.also be seen that the irrational numbers of0 1.618 and PHI 3.14159 are related.Using the Pythagorean theorem we can calculate the diagonal length. This number willalways maintain the same relationship to anyside of the square (1.4142:1).1/4 is the harmonic ratio from the squareand 1.618 is the Golden Mean.A square with sides equal to 1.000 has adiagonal of:which is1.4142.The diagonal of any square relates as1.4142:1.000 with its side.Expanding a square by the ratio of its diagonal produces the Harmonic Ratio Series.1.0001.41422.0002.828The inverse ratio relationships are:0.3540.5000.7071.000
THE PRIMARY PATTERNThis section discusses the primary patternsI use in trading. Many of my students askme why I share this information. It is quitesimple and has a two part answer. First, allof these patterns were found by someoneelse over the past 70 years. Second, everytrader has his own time frame that he likesto trade, so the chance of a self-fullingtrade expectation is very remote.importantly it also reiterates that it is notnecessary to know what is going to happennext. What is necessary is to know the riskon the trade. Since we are dealing withmathematical relationships, the control ofrisk can be quantified easily.I spent the better part of 30 years looking atthese patterns. My sources originated fromDon Mack at the Investment Center inOne very important difference will emerge Santa Monica, California and John Hill atfrom this section on pattern recognition.the Commodity Research Institute inThat difference is that all of the patternsHendersonville, North Carolina. I do notdiscussed will be illustrated using the math- think I overlooked anyone who ever deematical ratios of ancient geometry, ofscribed a price pattern. There are two bookswhich the Fibonacci Summation series is a that I highly recommend:part. What I tried to do is show how youcan use only four numbers of the1. Profits in the Stock Market by H.M.Fibonacci Summation series to mathemati- Gartley (1935). This was Gartley's Stockcally identify these patterns. I alwaysMarket course in the 1930's. It cost 1500thought that the mathematical relationshipwhich was equivalent to 3 Ford automoof these price swings is what the originators biles at the time. On pages 200 to 250 mostof these patterns failed to bring up. This isof the patterns ever discussed are found.especially true for the Elliott Wave theoreti- More trading systems were
Understanding Fibonacci Numbers (Dobson) Wall Street Ventures & Adventures through Forty Years (Wyckoff) Winning Market Systems (Appel) How to Trade in Stocks (Livermore) Stock Market Trading Systems (Appel & Hitschler) Study Helps in Point and Figure Technique (Wheelan) Commodity Spreads: Analysis,