Transcription
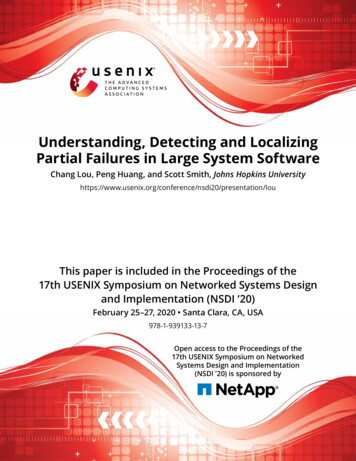
Understanding, Detecting and LocalizingPartial Failures in Large System SoftwareChang Lou, Peng Huang, and Scott Smith, Johns Hopkins /presentation/louThis paper is included in the Proceedings of the17th USENIX Symposium on Networked Systems Designand Implementation (NSDI ’20)February 25–27, 2020 Santa Clara, CA, USA978-1-939133-13-7Open access to the Proceedings of the17th USENIX Symposium on NetworkedSystems Design and Implementation(NSDI ’20) is sponsored by
Understanding, Detecting and Localizing Partial Failuresin Large System SoftwareChang LouJohns Hopkins UniversityPeng HuangJohns Hopkins UniversityAbstractPartial failures occur frequently in cloud systems and cancause serious damage including inconsistency and data loss.Unfortunately, these failures are not well understood. Norcan they be effectively detected. In this paper, we first study100 real-world partial failures from five mature systems tounderstand their characteristics. We find that these failures arecaused by a variety of defects that require the unique conditions of the production environment to be triggered. Manuallywriting effective detectors to systematically detect such failures is both time-consuming and error-prone. We thus proposeOmegaGen, a static analysis tool that automatically generatescustomized watchdogs for a given program by using a novelprogram reduction technique. We have successfully appliedOmegaGen to six large distributed systems. In evaluating 22real-world partial failure cases in these systems, the generatedwatchdogs can detect 20 cases with a median detection timeof 4.2 seconds, and pinpoint the failure scope for 18 cases.The generated watchdogs also expose an unknown, confirmedpartial failure bug in the latest version of ZooKeeper.1IntroductionIt is elusive to build large software that never fails. Designersof robust systems therefore must devise runtime mechanismsthat proactively check whether a program is still functioningproperly, and react if not. Many of these mechanisms are builtwith a simple assumption that when a program fails, it failscompletely via crash, abort, or network disconnection.This assumption, however, does not reflect the complexfailure semantics exhibited in modern cloud infrastructure.A typical cloud software program consists of tens of modules, hundreds of dynamic threads, and tens of thousandsof functions for handling different requests, running variousbackground tasks, applying layers of optimizations, etc. Notsurprisingly, such a program in practice can experience partial failures, where some, but not all, of its functionalities arebroken. For example, for a data node process in a moderndistributed file system, a partial failure could occur when aUSENIX AssociationScott SmithJohns Hopkins Universityrebalancer thread within this process can no longer distributeunbalanced blocks to other remote data node processes, eventhough this process is still alive. Or, a block receiver daemonin this data node process silently exits, so the blocks are nolonger persisted to disk. These partial failures are not a latentproblem that operators can ignore; they can cause seriousdamage including inconsistency, “zombie” behavior and dataloss. Indeed, partial failures are behind many catastrophicreal-world outages [1, 17, 39, 51, 52, 55, 66, 85, 86]. For example, Microsoft Office 365 mail service suffered an 8-houroutage because an anti-virus engine module of the mail serverwas stuck in identifying some suspicious message [39].When a partial failure occurs, it often takes a long timeto detect the incident. In contrast, a process suffering a totalfailure can be quickly identified, restarted or repaired by existing mechanisms, thus limiting the failure impact. Worse still,partial failures cause mysterious symptoms that are incrediblydifficult to debug [78], e.g., create() requests time out butwrite() requests still work. In a production ZooKeeper outage due to the leader failing partially [86], even after an alertwas triggered, the leader logs contained few clues about whatwent wrong. It took the developer significant time to localizethe fault within the problematic leader process (Figure 1).Before pinpointing the failure, a simple restart of the leaderprocess was fruitless (the symptom quickly re-appeared).Both practitioners and the research community have calledattention to this gap. For example, the Cassandra developersadopted the more advanced accrual failure detector [73], butstill conclude that its current design “has very little abilityto effectively do something non-trivial to deal with partialfailures” [13]. Prabhakaran et al. analyze partial failure specific to disks [88]. Huang et al. discuss the gray failure [76]challenge in cloud infrastructure. The overall characteristicsof software partial failures, however, are not well understood.In this paper, we first seek to answer the question, how dopartial failures manifest in modern systems? To shed somelight on this, we conducted a study (Section 2) of 100 realworld partial failure cases from five large-scale, open-sourcesystems. We find that nearly half (48%) of the studied failures17th USENIX Symposium on Networked Systems Design and Implementation559
1 public class SyncRequestProcessor {public void serializeNode(OutputArchive oa, .) {2DataNode node getNode(pathString);3if (node null)4return;5String children[] null;6synchronized (node) {7blocked for a long timescount ;8oa.writeRecord(node, "node");9children node.getChildren();10}11path.append('/');12for (String child : children) {13path.append(child);14serializeNode(oa, path); //serialize children15}16}1718 }Figure 1: A production ZooKeeper outage due to partial failure [86].cause certain software-specific functionality to be stuck. Inaddition, the majority (71%) of the studied failures are triggered by unique conditions in a production environment, e.g.,bad input, scheduling, resource contention, flaky disks, or afaulty remote process. Because these failures impact internal features such as compaction and persistence, they can beunobservable to external detectors or probes.How to systematically detect and localize partial failures atruntime? Practitioners currently rely on running ad-hoc healthchecks (e.g., send an HTTP request every few seconds andcheck its response status [3, 42]). But such health checks aretoo shallow to expose a wide class of failures. The state-of-theart research work in this area is Panorama [75], which convertsvarious requestors of a target process into observers to reportgray failures of this process. This approach is limited bywhat requestors can observe externally. Also, these observerscannot localize a detected failure within the faulty process.We propose a novel approach to construct effective partialfailure detectors through program reduction. Given a programP, our basic idea is to derive from P a reduced but representative version W as a detector module and periodically testW in production to expose various potential failures in P. Wecall W an intrinsic watchdog. This approach offers two mainbenefits. First, as the watchdog is derived from and “imitates”the main program, it can more accurately reflect the mainprogram’s status compared to the existing stateless heartbeats,shallow health checks or external observers. Second, reduction makes the watchdog succinct and helps localize faults.Manually applying the reduction approach on large software is both time-consuming and error-prone for developers.To ease this burden, we design a tool, OmegaGen, that statically analyzes the source code of a given program and generates customized intrinsic watchdogs for the target program.Our insight for realizing program reduction in OmegaGenis that W ’s goal is solely to detect and localize runtime errors;therefore, it does not need to recreate the full details of P’sbusiness logic. For example, if P invokes write() in a tightloop, for checking purposes, a W with one write() may besufficient to expose a fault. In addition, while it is temptingto check all kinds of faults, given the limited resources, Wshould focus on checking faults manifestable only in a produc-560tion environment. Logical errors that deterministically leadto wrong results (e.g., incorrect sorting) should be the focusof offline unit testing. Take Figure 1 as an example. In checking the SyncRequestProcessor, W need not check most of theinstructions in function serializeNode, e.g., lines 3–6 and 8.While there might be a slim chance these instructions wouldalso fail in production, repeatedly checking them would yielddiminishing returns for the limited resource budget.Accurately distinguishing logically-deterministic faults andproduction-dependent faults in general is difficult. OmegaGenuses heuristics to analyze how “vulnerable” an instruction isbased on whether the instruction performs some I/O, resourceallocation, async wait, etc. So since line 9 of Figure 1 performs a write, it would be assessed as vulnerable and testedin W . It is unrealistic to expect W to always include the failure root cause instruction. Fortunately, a ballpark assessmentoften suffices. For instance, even if we only assess that theentire serializeNode function or its caller is vulnerable, andperiodically test it in W , W can still detect this partial failure.Once the vulnerable instructions are selected, OmegaGenwill encapsulate them into checkers. OmegaGen’s second contribution is providing several strong isolation mechanisms sothe watchdog checkers do not interfere with the main program.For memory isolation, OmegaGen identifies the context fora checker and generates context managers with hooks in themain program which replicates contexts before using themin checkers. OmegaGen removes side-effects from I/O operations through redirection and designs an idempotent wrappermechanism to safely test non-idempotent operations.We have applied OmegaGen to six large (28K to 728KSLOC) systems. OmegaGen automatically generates tens tohundreds of watchdog checkers for these systems. To evaluatethe effectiveness of the generated watchdogs, we reproduced22 real-world partial failures. Our watchdogs can detect 20cases with a median detection time of 4.2 seconds and localize the failure scope for 18 cases. In comparison, the bestmanually written baseline detector can only detect 11 casesand localize 8 cases. Through testing, our watchdogs exposeda new, confirmed partial failure bug in the latest ZooKeeper.2Understanding Partial FailuresPartial failures are a well known problem. Gupta and Shutereport that partial failures occur much more commonly than total failures in the Google Ads infrastructure [70]. Researchersstudied partial disk faults [88] and slow hardware faults [68].But how software fails partially is not well understood. In thisSection, we study real-world partial failures to gain insightinto this problem and to guide our solution design.Scope We focus on partial failure at the process granularity.This process could be standalone or one component in a largeservice (e.g., a datanode in a storage service). Our studiedpartial failure is with respect to a process deviating from thefunctionalities it is supposed to provide per se, e.g., store and17th USENIX Symposium on Networked Systems Design and ImplementationUSENIX Association
Lang. Cases Ver.s (Range)Date CC 13–12/28/2018202020202017 (3.2.1–3.5.3)19 (0.7.4–3.0.13)14 (0.20.1–3.1.0)16 (2.0.40–2.4.29)11 (0.11.0–1.7.0)Table 1: Studied software systems, the partial failure cases, and theunique versions, version and date ranges these cases 50UEIBEHDDPBLEILRL OtherFigure 2: Root cause distribution. UE: uncaught error; IB: indefiniteblocking; EH: buggy error handling; DD: deadlock; PB: performance bug; LE: logic error; IL: infinite loop; RL: resource leak.balance data blocks, whether it is a service component or astandalone server. We note that users may define a partialfailure at the service granularity (e.g., Google drive becomesread-only), the underlying root cause of which could be eithersome component crashing or failing partially.Methodology We study five large, widely-used software systems (Table 1). They provide different services and are written in different languages. To collect the study cases, we firstcrawl all bug tickets tagged with critical priorities in the official bug trackers. We then filter tickets from testing and randomly sample the remaining failures tickets. To minimize biasin the types of partial failures we study, we exhaustively examining each sampled case and manually determine whetherit is a complete failure (e.g., crash), and discard if so. In total,we collected 100 failure cases (20 cases for each tware30MesosZooKeeper20100stuckslow zombieomission denial corrupt otherFigure 3: Consequence of studied failures.ple, the streaming session in Cassandra could hang whenthe stream reader encounters errors other than IOExceptionlike RuntimeException [6]. Indefinite blocking occurs whensome function call is blocked forever. In one case [27], theEditLogTailer in a standby HDFS namenode made an RPCrollEdits() to the active namenode; but this call was blockedwhen the active namenode was frozen but not crashed, whichprevented the standby from becoming active. Buggy error handling includes silently swallowing errors, empty handlers [93],premature continuing, etc. Other common root causes includedeadlock, performance bugs, infinite loop and logic errors.Finding 3: Nearly half (48%) of the partial failures causesome functionality to be stuck.Figure 3 shows the consequences of the studied failures.Note that these failures are all partial. For the “stuck” failures, some software module like the socket watcher was notmaking any progress; but the process was not completely unresponsive, i.e., its heartbeat module can still respond in time.It may also handle other requests like non-local reads.Besides “stuck” cases, 17% of the partial failures causescertain operation to take a long time to complete (the “slow”category in Figure 3). These slow failures are not just inefficiencies for optional optimization. Rather, they are severeperformance bugs that cause the affected feature to be barelyusable. In one case [5], after upgrading Cassandra 2.0.15 to2.1.9, users found the read latency of the production clusterincreased from 6 ms/op to more than 100 ms/op.Finding 1: In all the five systems, partial failures appearthroughout release history (Table 1). 54%1 of them occur inthe most recent three years’ software releases.Finding 4: In 13% of the studied cases, a module became a“zombie” with undefined failure semantics.Such a trend occurs in part because as software evolves,new features and performance optimizations are added, whichcomplicates the failure semantics. For example, HDFS introduced a short-circuit local reads feature [30] in version 0.23.To implement this feature, a DomainSocketWatcher was addedthat watches a set of Unix domain sockets and invokes acallback when they become readable. But this new modulecan accidentally exit in production and cause applicationsperforming short-circuit reads to hang [29].This typically happens when the faulty module accidentallyexits its normal control loop or it continues to execute evenwhen it encounters some severe error that it cannot tolerate.For example, an unexpected exception caused the ZooKeeperlistener module to accidentally exit its while loop so newnodes could no longer join the cluster [46]. In another case,the HDFS datanode continued even if the block pool failed toinitialize [26], which would trigger a NullPointerExceptionwhenever it tried to do block reports.Finding 2: The root causes of studied failures are diverse. Thetop three (total 48%) root cause types are uncaught errors,indefinite blocking, and buggy error handling (Figure 2).Finding 5: 15% of the partial failures are silent (includingdata loss, corruption, inconsistency, and wrong results).Uncaught error means certain operation triggers some errorcondition that is not expected by the software. As an exam1 Withsample size 100, the percents also represent the absolute numbers.USENIX AssociationThey are usually hard to detect without detailed correctnessspecifications. For example, when the Mesos agent garbagecollects old slave sandboxes, it could incorrectly wipe out thepersistent volume data [37]. In another case [38], the Apache17th USENIX Symposium on Networked Systems Design and Implementation561
web server would “go haywire”, e.g., a request for a .js filewould receive a response of image/png, because the backendconnections are not properly closed in case of errors.Finding 6: 71% of the failures are triggered by some specificenvironment condition, input, or faults in other processes.For example, a partial failure in ZooKeeper can onlybe triggered when some corrupt message occurs in thelength field of a record [66]. Another partial failure in theZooKeeper leader would only occur when a connecting follower hangs [50], which prevents other followers from joiningthe cluster. These partial failures are hard to be exposed bypre-production testing and require mechanisms to detect atruntime. Moreover, if a runtime detector uses a different setupor checking input, it may not detect such failures.check for the rollEdits() operation in the aforementionedHDFS failure [27]. However, simply relying on developersto anticipate and add defensive checks for every operation isunrealistic. We need a systematic approach to help developersconstruct software-specific runtime checkers.It would be desirable to completely automate the construction of customized runtime checkers, but this is extremelydifficult in the general case given the diversity (finding 2)of partial failures. Indeed, 15% of the studied failures aresilent, which require detailed correctness specifications tocatch. Fortunately, the majority of failures in our study violate liveness (finding 3) or trigger explicit errors at certainprogram points, which suggests that detectors can be automatically constructed without deep semantic understanding.Finding 7: The majority (68%) of the failures are “sticky”.3Sticky means the process will not recover from the faultsby itself. The faulty process needs to be restarted or repairedto function again. In one case, a race condition caused anunexpected RejectedExecutionException, which caused theRPC server thread to silently exit its loop and stop listeningfor connections [9]. This thread must be restarted to fix theissue. For certain failures, some extra repair actions such asfixing a file system inconsistency [25] are needed.The remaining (32%) failures are “transient”, i.e., thefaulty modules could possibly recover after certain conditionchanges, e.g., when the frozen namenode becomes responsive [27]. However, these non-sticky failures already incurreddamage for a long time by then (15 minutes in one case [45]).We consider a large server process π composed of manysmaller modules, providing a set of functionalities R, e.g.,a datanode server with request listener, snapshot manager,cache manager, etc. A failure detector is needed to monitorthe process for high availability. We target specifically partialfailures. We define a partial failure in a process π to be whena fault does not crash π but causes safety or liveness violationor severe slowness for some functionality R f ( R. Besides detecting a failure, we aim to localize the fault within the processto facilitate subsequent troubleshooting and mitigation.Guided by our study, we propose an intersection principlefor designing effective partial failure detectors—constructcustomized checks that intersect with the execution of a monitored process. The rationale is that partial failures typicallyinvolve specific software feature and bad state; to expose suchfailures, the detector need to exercise specific code regionswith carefully-chosen payloads. The checks in existing detectors including heartbeat and HTTP tests are too generic andtoo disjoint with the monitored process’ states and executions.We advocate an intrinsic watchdog design (Figure 4) thatfollows the above principle. An intrinsic watchdog is a dedicated monitoring extension for a process. This extensionregularly executes a set of checkers tailored to different modules. A watchdog driver manages the checker scheduling andexecution, and optionally applies a recovery action. The keyobjective for detection is to let the watchdog experience similar faults as the main program. This is achieved through (a)executing mimic-style checkers (b) using stateful payloads (c)sharing execution environment of the monitored process.Mimic Checkers. Current detectors use two types of checkers: probe checkers, which periodically invoke some APIs;signal checkers, which monitor some health indicator. Bothare lightweight. But a probe checker can miss many failuresbecause a large program has numerous APIs and partial failures may be unobservable at the API level. A signal checkeris susceptible to environment noises and usually has pooraccuracy. Neither can localize a detected failure.Finding 8: The median diagnosis time is 6 days and 5 hours.For example, diagnosing a Cassandra failure [10] took thedevelopers almost two days. The root cause turned out to berelatively simple: the MeteredFlusher module was blocked forseveral minutes and affected other tasks. One common reasonfor the long diagnosis time despite simple root causes is thatthe confusing symptoms of the failures mislead the diagnosisdirection. Another common reason is the insufficient exposureof runtime information in the faulty process. Users have toenable debug logs, analyze heap, and/or instrument the code,to identify what was happening during the production failure.2.2ImplicationsOverall, our study reveals that partial failure is a commonand severe problem in large software systems. Most of thestudied failures are production-dependent (finding 6), whichrequire runtime mechanisms to detect. Moreover, if a runtimedetector can localize a failure besides mere detection, it willreduce the difficulty of offline diagnosis (finding 8). Existingdetectors such as heartbeats, probes [69], or observers [75] areineffective because they have little exposure to the affectedfunctionalities internal in a process (e.g., compaction).One might conclude that the onus is on the developers toadd effective runtime checks in their code, such as a timer562Catching Partial Failures with Watchdogs17th USENIX Symposium on Networked Systems Design and ImplementationUSENIX Association
address rwatchdoghooks statesContextsmainprogramReplication EngineReportwatchdogmimic checkersdriver Failure alert Failed checker Saved context Figure 4: An intrinsic watchdog example.We propose a more powerful mimic-style checker. Suchchecker selects some representative operations from eachmodule of the main program, imitates them, and detects errors.This approach increases coverage of checking targets. Andbecause the checker exercises code logic similar to the mainprogram in production environment, it can accurately reflectthe monitored process’ status. In addition, a mimic checkercan pinpoint the faulty module and failing instruction.Synchronized States. Exercising checkers requires payloads.Existing detectors use synthetic input (e.g., fixed URLs [3]) ora tiny portion of the program state (e.g., heartbeat variables)as the payload. But triggering partial failures usually entailsspecific input and program state (§2). The watchdog shouldexercise its checkers with non-trivial state from the mainprogram for higher chance of exposing partial failures.We introduce contexts in watchdogs. A context is boundto each checker and holds all the arguments needed for thechecker execution. Contexts are synchronized with the program state through hooks in the main program. When themain program execution reaches a hook point, the hook usesthe current program state to update its context. The watchdogdriver will not execute a checker unless its context is ready.Concurrent Execution. It is natural to insert checkers directly in the main program. However, in-place checking posesan inherent tension—on the one hand, catching partial failuresrequires adding comprehensive checkers; on the other hand,partial failures only occur rarely, but more checkers wouldslow down the main program in normal scenarios. In-placecheckers could also easily interfere with the main programthrough modifying the program states or execution flow.We advocate watchdog to run concurrently with the mainprogram. Concurrent execution allows checking to be decoupled so a watchdog can execute comprehensive checkerswithout delaying the main program during normal executions.Indeed, embedded systems domain has explored using concurrent watchdog co-processor for efficient error detection [84].When a checker triggers some error, the watchdog also willnot unexpectedly alter the main program execution. The concurrent watchdog should still live in the same address spaceto maximize mimic execution and expose similar issues, e.g.,all checkers timed out when the process hits long GC pause.4Generating Watchdogs with OmegaGenIt is tedious to manually write effective watchdogs for largeprograms, and it is challenging to get it right. IncautiouslyUSENIX Associationwritten watchdogs can miss checking important functions,alter the main execution, invoke dangerous operations, corrupt program states, etc. a watchdog must also be updated asthe software evolves. To ease developers’ burden, we designa tool, OmegaGen, which uses a novel program reductionapproach to automatically generate watchdogs described inSection 3. The central challenge of OmegaGen is to ensurethe generated watchdog accurately reflects the main programstatus without introducing significant overhead or side effects.Overview and Target. OmegaGen takes the source code ofa program P as an input. It finds the long-running code regions in P and then identifies instructions that may encounterproduction-dependent issues using heuristics and optional,user-provided annotations. OmegaGen encapsulates the vulnerable instructions into executable checkers and generateswatchdog W. It also inserts watchdog hooks in P to updateW’s contexts and packages a driver to execute W in P. Figure 5shows an overview example of running OmegaGen.As discussed in Section 2.2, it is difficult to automaticallygenerate detectors that can catch all types of partial failures.Our approach targets partial failures that surface through explicit errors, blocking or slowness at certain instruction orfunction in a program. The watchdogs OmegaGen generatesare particularly effective in catching partial failures in whichsome module becomes stuck, very slow or a “zombie” (e.g.,the HDFS DomainSocketWatcher thread accidentally exitingand affecting short-circuit reads). They are in general ineffective on silent correctness errors (e.g., Apache web-serverincorrectly re-using stale connections).4.1Identify Long-running MethodsOmegaGen starts its static analysis by identifying longrunning code regions in a program (step Ê), because watchdogs only target checking code that is continuously executed.Many code regions in a server program are only for one-shottasks such as database creation, and should be excluded fromwatchdogs. Some tasks are also either periodically executedsuch as snapshot or only activated under specific conditions.We need to ensure the activation of generated watchdog isaligned with the life span of its checking target in the mainprogram. Otherwise, it could report wrong detection results.OmegaGen traverses each node in the program call graph.For each node, it identifies potentially long-running loops inthe function body, e.g., while(true) or while(flag). Loopswith fixed iterations or that iterate over collections will beskipped. OmegaGen then locates all the invocation instructions in the identified loop body. The invocation targets arecolored. Any methods invoked by a colored node are alsorecursively colored. Besides loops, we also support coloringperiodic task methods scheduled through common librarieslike ExecutorService in Java concurrent package. Note thatthis step may over-extract (e.g., an invocation under a conditional). This is not an issue because the watchdog driver willcheck context validity at runtime (§4.4).17th USENIX Symposium on Networked Systems Design and Implementation563
123456789101112131415161718192021public class SyncRequestProcessor {public void run() {while (running) {1 identify long-running regionif (logCount (snapCount / 2))zks.takeSnapshot();.3 reduce}}}3 reducepublic class DataTree {public void serializeNode(OutputArchive oa, .) {.String children[] null;synchronized (node) {2 locate vulnerable operationsscount ;oa.writeRecord(node, "node");children node.getChildren();}.} ContextManger.serializeNode reducedargs setter(oa, node);}insert context hooks41234567891011121314151617181920212223public class SyncRequestProcessor Checker {public static void serializeNode reduced(OutputArchive arg0, DataNode arg1) {arg0.writeRecord(arg1, "node");}public static void serializeNode invoke() {Context ctx ContextManger.4 generateserializeNode reduced context(); contextif (ctx.status READY) {factoryOutputArchive arg0 ctx.args getter(0);DataNode arg1 ctx.args getter(1);serializeNode reduced(arg0, arg1);}}public static void takeSnapshot reduced() {serializeList invoke();serializeNode invoke();}public static Status checkTargetFunction0() {. 5 add fault signal checkstakeSnapshot reduced();}}(a) A module in main program(b) Generated checkerFigure 5
But how software fails partially is not well understood. In this Section, we study real-world partial failures to gain insight into this problem and to guide our solution design. Scope We focus on partial failure at the process granularity. This process could be standalone or one component in