Transcription
BreakoutTradingNewsletterExplanatory NotesRevision 1902
BreakoutTrading NewsletterExplanatory NotesGeneral AdviceActVest Pty Ltd is a Corporate Authorised Representative (CAR No.306718) of Primary Securities LtdAFSL No. 224107 ("PSL"). This document has been prepared for the general information of investors anddoes not take into account the investment objectives, financial situation and particular needs of anyparticular person. Persons intending to act on information in this document should seek professional adviceto confirm that the investments or strategies mentioned are appropriate in the light of their particularinvestment needs, objectives and financial circumstances prior to taking any action. While reasonable carehas been exercised and the statements contained herein are based on information believed to be accurate andreliable, neither ActVest, PSL, nor their employees or agents shall be obliged to update you if theinformation or its advice changes or be liable (unless otherwise required by law) for any loss or damagesuffered or caused to any person or corporation resulting from or contributed to by any error or omissionfrom such statements including any loss or damage caused by any fault or negligence on the part of ActVestor PSL, whether direct, indirect, consequential or otherwise, whether foreseeable or not. Direct investing inthe stock market can result in financial loss. This document, and any associated files, is intended solely forits intended recipient. The contents are confidential and may be legally privileged. Copyright Alan Hull 2019This document is copyright. This document, in part or whole, may not be reproduced or transmitted in anyform or by any means, electronic, mechanical, photocopying, recording, scanning or otherwise without priorwritten permission. Further enquiries can be made to Alan Hull, the author, on 061-03-9513 0070.Correspondence can be forwarded to ActVest Pty. Ltd. ABN 44 101 040 939 at 7 Cousin Drive, Bayswater,Vic, 3153, Australia or via our website at http://www.alanhull.com2
Contents .Introduction5Key Features6Theory of Breakout TradingThe Calm before the StormPoints of AgreementEquilibrium to ChaosThe BreakoutMomentum7891011The Tool BoxCandlesticksPivot PointsTrend Lines (for Triangles)Average True Range (Volatility Indicator)MACD IndicatorMACD Bar121314151617Breakout PatternsPoint of Agreement PatternsBreakout CandlesGuidelines for assessing a Breakout Pattern182124Strategy Specific IndicatorsStop Loss IndicatorEntry Limit Indicator2527Risk ManagementPosition RiskSector RiskPortfolio RiskInvestment Guidelines28292929The Trading StrategySearch for New TradesHow to Enter a TradeExample of a Entering a TradeExample of a Trade in ProgressWhen to Exit a TradeExample of Exiting a Trade3132333434353
Second Wave Trades2nd Wave Trading Strategy2nd Wave Trade IndicatorsHow to Enter a 2nd Wave TradeGuidelines for Choosing between 2nd Wave TradesExample of Entering a 2nd Wave TradeExample of a 2nd Wave Trade in ProgressWhen to Exit a 2nd Wave TradeExample of Exiting a 2nd Wave Trade3637373838394041Short SellingBreakouts to the Down Side42Quick GuideNewsletter Section sHow to Enter a TradeGuidelines for Choosing Between TradesWhen to Exit a TradeRisk ManagementChart Features434344444545When do I enter a trade?What do I do if there are several New Trades to choose from?Can I enter a share from the ‘Trades in Progress’ section ratherthan the ‘New Trade ’ section?What do I do if my share does not appear in the ‘Data Tables’?Why is there an ‘Entry Limit’? Some trades seem to go much further.What does ‘Hold’ mean? Can I still enter this share?Is Breakout Trading a Daily or Weekly System?What is a 2nd Wave trade?How do I know if a trade is a Breakout Trade or a 2nd Wave Trade?4646FAQ46464646464747Website & Free Sample Newsletter47Subscription Form484
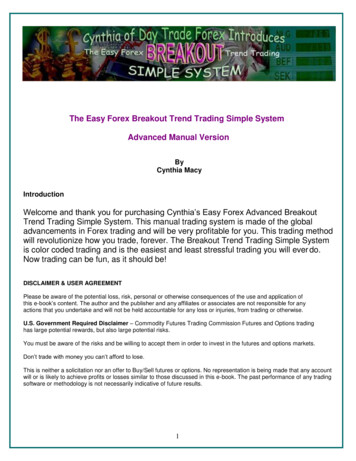
IntroductionBreakout trading is essentially momentum trading following a breakout from a Point ofAgreement; where a Point of Agreement (referred to as a POA) is when the share activityconsolidates into a narrowing trading range see chart below.A key feature of this style of trading is that breakouts can occur regardless of marketconditions, whether it is a bull or bear market or even a sideways market. This is not a trendtrading strategy; instead breakouts from POAs are traded using momentum as a guide sincemost rallies typically have significant momentum.Breakout TradeHowever, breakouts also occur during trends. So although this strategy focuses on tradingrallies, parts of trends tend to be captured anyway. But without a doubt, the strength of thisapproach lies in its universality; finding opportunities in very difficult conditions includingnon-trending periods or even turning points.Breakout trades exist in many time frames but a weekly time frame is quite robust for trading.This timeframe irons out daily volatility and allows some rallies to develop to very profitablelevels. Recent back testing indicates that the average length of a trade using a weeklyapproach is about 9 weeks. Hence the system is a very nimble, relatively short term strategythat requires less than 1 hour a week to operate.The Breakout Trading Newsletter brings together all the essential elements for trading abreakout strategy within the Australian Market by identifying breakouts that follow POA’sand applying trading tactics to capture the majority of any ensuing rally.5
Key Features! All terrain trading systemBreakout trades occur in most market conditions which will mean there will generallybe plenty of trading opportunities, regardless of market conditions. Recent back testingidentified over 100 trading opportunities in each year tested.! High win rate set upA breakout, such as described in this strategy is a high probability trade set up. Recentback testing shows over 60% of trades were profitable. For a complete set of currentback testing results, please go to www.alanhull.com! High profit ratioSpecifics of the strategy including the use of an entry limit and a momentum basedstop loss mean a high profit ratio is achievable. The average profit to loss ratio inrecent back testing was about 2.3:1! Long and Short trading opportunitiesBreakouts can be up or down which means that both Long and Short tradingopportunities can arise. However, the majority of trades tend to be Long; about 80%in recent back testing, so Short trading opportunities are available but can beoverlooked depending on a Trader’s preference.! High frequency trading (and therefore capital) turnoverRecent back testing indicates the average trade length is about 9 weeks. Thus the shortterm nature of the strategy means the opportunity to rollover and therefore pyramidyour trading capital is very attractive.! Double Search procedure.All the hard work is done for you.All trades that appear in the newsletter have resulted from the best of both amechanical search and rigorous discretionary analysis.! 2 Stop Losses for added safety.A Stop Loss made of 2 components is included.It is partly an Initial Stop Loss, ensuring the breakout trade remains valid, and partly aTrailing Stop Loss to make sure any profit is retained. Since the main exit criteria ismomentum based these stop losses are in fact secondary – for safety sake and to applyrisk and money management.! Risk & Money Management done for you with calculated position sizingplus helpful guidance on sector and portfolio risk management! Extra trading strategy called ‘2nd Wave Trading’to provide furtheropportunities in a rising market. So you can capture initial profits from the point ofbreak out, as well as capturing further profits from ongoing trend behavior.! Easy to Use Weekly StrategyThe newsletter brings together all of the above features into an easy to use system thatrequires less than 1 hour a week to operate.6
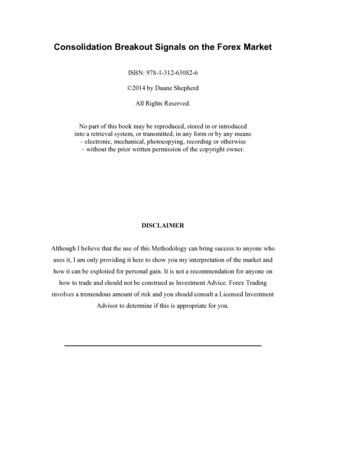
Theory of Breakout TradingThe Calm before the StormIf the air seems very still, everything is quiet and on the horizon is a line of ominous cloudsthen it is quite likely to be a calm moment before a storm. This is an intriguing weatherphenomenon that really does occur.A similar type of pattern happens in the share market. In the centre of the chart below is aregion where the share price has gradually reduced to very little activity. The candlesbecame smaller indicating reducing volatility and the price movement is essentially sideways.What follows, however, is like a storm. The price breaks out upwards with growingmomentum.The Calm before the StormThe scientific explanation of this weather phenomenon hasto do with storm clouds drawing in air from all around,including from in front of the storm pathway.Moisture is removed by the thunderclouds and theresulting warm dry air circulates back into the vacuumthat was initially created in the region around the storm.It is this warm dry air that has a stabilising, settling effectthat gives a feeling of calm.7
This behavioural pattern in the stock market can be explained by understanding the forces ina functioning market. A market can only exist when there is agreement on a sale price (inorder for a transaction to take place) and disagreement on the current or future value of theproduct being traded. Disagreement on value is usually created because of differences inperspectives or opinions.Now if there was prolonged agreement on the value of a product then there would be nomarket for it. For example, imagine a 50 note. Not many people would be willing to buy a 50 note for 60. Nor would many people sell one for 40. This is because we all agree thenote has a value of 50. Therefore, there is no market for 50 notes.Points of AgreementSo for financial markets to continue to exist there must be general disagreement. Butsometimes it seems that there is some agreement, such as when a share price pauses orconsolidates. When the apparent agreement becomes narrower and more focussed, it is calleda Point of Agreement (POA)The period of calm in the chart on page 7 is an example of this happening. The same charthas been reproduced over the page, where trend lines have been added to highlight thetriangular shape of the period in question. As the price moves towards the apex of thetriangle, the buying and selling forces become more in balance; that is, market participantsappear to be moving towards agreement. Usually this is further evidenced by a fall in tradingvolume.8
However, agreement cannot continue for an extended period or the market would lose allliquidity and cease to exist.From Equilibrium to ChaosThus, Points of Agreement are a kind of momentary equilibrium where things seem calm.Perhaps falsely so, just like the calm before a storm. Because when market forces reach astate of equilibrium it becomes very easy for new forces to come along and shift the shareprice.So the situation changes dramatically following a Point of Agreement. New market forcesdrive the share price to break out from the triangle’s apex. The market moves away fromequilibrium and towards chaos; from general agreement back to general disagreement.Volatility (and typically trading volume as well) increases and the price can take off either inan upward or downward direction.A particularly important point of this theory for Breakout Trading is that since the marketcannot continually narrow or move sideways it pretty much has to breakout one way oranother. For this reason POA’s are a very powerful pattern that can be readily identified andthen exploited for profit by traders.9
The BreakoutThe transition from equilibrium to chaos occurs at the Breakout candle. This is the momentwhen forces can suddenly become quite strong; where volatility, and often volume, suddenlyincrease.This is an extremely important part of the break out pattern. The candle not only confirmsthe preceding triangle and Point of Agreement, but signals the direction of the coming rallyand provides an entry point for trading the ensuing rally. In other words, a trader wouldtypically enter at the start of the next trading period.A breakout candle must make a significant move in relation to the POA and make a newshort term high (or a new low for a downward break out). These features can be identifiedwith a combination of mechanical and discretionary techniques.The Breakout Trading strategy searches for these candles and then filters them for those thatoccur directly after a Point of Agreement. All charts in the newsletter section headed ‘NewTrades This Week’ will have a Breakout candle following an acceptable POA.10
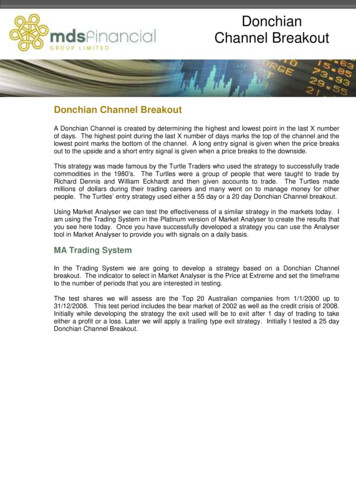
MomentumBreakouts are more often than not, quite dramatic. Forces are shifting the state of the systemfrom equilibrium back to chaos; from agreement back to general disagreement. The lengthand strength of the rally can vary but in each case the rate of change of the price (ormomentum) is typically increasing. For this reason momentum indicators are a good guidefor trading a break out rally.In the chart below the MACD indicator, a momentum linked indicator has been added at thetop. A full explanation on the MACD indicator is on page 16. It shows how momentum (thered line) turned up at the Breakout and continued to rise during the rally. Any weakness inmomentum will indicate an end of the Breakout price rally.It is worth noting that a strong rally may just be the beginning of a long and stable trend.However, the purpose of this trading strategy is to find short term trading opportunities in avariety of market conditions. Therefore exiting a rally at the slightest slow down inmomentum is a key element of this approach.An advantage to using momentum as a guide for exiting a break out rally is that it is oftentriggered before the price falls too much (for LONG trades). This makes for nimble trading.In this strategy there is the safety feature of a trailing stop loss but back testing results showthat the momentum exit is generally triggered first; thereby significantly improving tradingresults versus using a trailing stop loss only.11
The Tool BoxCandlesticksCharts using candles for each time period are visually easy to understand. The larger sectionof each candle is called the Real Body. The thin parts on the top or bottom are calledShadows.White CandleA white candle is an UPcandle where the close ishigher than the open.Black CandleA black candle is a DOWNcandle where the close islower than the open.Doji CandleA Doji candle is where theOpen and Close are equal orvery similar.12
Pivot PointsPrice action moves in waves and Pivot Points are the high and low turning points of thesewaves. The Breakout Trading strategy requires the identification of a previous short termPivot Point when identifying a Breakout Candle. For example, in LONG break out trading aBreakout Candle must close above the highest CLOSE of the previous Pivot Point High.13
Trend Lines (for Triangles)Drawing trend lines and identifying triangles is discretionary so practice really helps. It isbest if the pattern jumps out at you before you’re even drawn the lines on the chart. Thenadding the lines simply confirms what you are already seeing.Definition" A valid trend line must touch in at least 2 places in the past" Triangles must incorporate all the real bodies (see page 12) of the candles.Guidelines" 3 touches to a trend line are better than 2. The more touches the better." Whilst the real bodies of the candles must be within the triangle, a trend line can sit onthe bodies or the shadows or a combination of both.In the following charts the triangle is drawn in 2 different ways. The first uses the shadowsof the candles whilst the second uses the real bodies. Both are considered acceptable.Here, the Trend Lines havebeen placed on the Shadowsof the candlesHere, the Trend Lines havebeen placed on the Bodies ofthe candles14
Average True Range (Volatility)Volatility is the measure of how far the price moves in a period of time. The size of eachcandle is a basic way to assess general volatility. However, in order to be morespecific/mechanical in measuring volatility for this trading strategy we use an indicatorcalled Average True Range (ATR). This was developed by American trader and author, J.Welles Wilder.Wilder created the concept of 'true range'. This defines the volatility of price activity bytaking into account both the price range during any given trading period and pricemovements between trading periods. He defined 'true range' as being the largest of threemeasurements as described in the following diagram.True range is based on the two most recent trading periods and is of little use for measuringprice volatility over a longer period of time. To do so we have to calculate the 'average truerange' using a period of time that we are interested in.In this strategy a period of 17 is being used since recent back testing indicates this is theaverage length of a triangle. This is relevant since a Breakout candle’s volatility can berelated to the average volatility of the preceding triangle. Obviously this figure is subject toconstant review as market conditions change.15
MACD IndicatorMACD is an acronym for Moving Average Convergence Divergence and was developed byGerald Appel. It is calculated by subtracting the 26 period exponential moving average(EMA) from the 12 period EMA. A reference line is added which has a 9 period EMA of theMACD, see chart below.To understand the MACD indicator; consider that it is a difference between two movingaverages. If the MACD line is rising it means the faster moving average is rising quickerthan the slower moving average. This implies an increasing rate of change of the pricewhich is, by definition, momentum.This ideally suits our requirement in breakout trading where a rally normally has increasingmomentum. The rally can be tracked with the MACD. Any slowdown in the MACD linewill be a slowing in the rate of change of the price (momentum) and therefore a likely end tothe price rally.In this trading strategy we are using the default settings as recommended by Appel for theMACD and its reference line. As these settings are well suited to breakout trading Australianequities (as confirmed through back testing), then there is no reason to change them. Ofcourse system performance is monitored to ensure the settings remain suitable.16
MACD BarReading the detail of the direction of the red MACD line in the charts can sometimes be alittle difficult without zooming in. So we have placed a coloured MACD bar on each chart inthe newsletter. This gives the same information as the MACD indicator but it is easier toread at a glance. Here’s how The MACD bar is light blue if the MACD line is rising and above the reference line. It isred if the MACD line is falling and below the reference line. At any other time it is grey.For example, when trading a LONG Breakout trade the MACD bar must be light blue. If itchanges to grey or red this is an exit signal.17
Breakout PatternsA Breakout Pattern includes both a Point of Agreement (POA) and a Breakout Candle.Details of each of these parts of the pattern are discussed below.Point of Agreement (POA) PatternsThe shape of a Point of Agreement will almost always be triangular. However, triangles docome in various shapes and sizes. They can be ascending, descending, equilateral or wedgeshaped. This section shows an assortment of triangles that fit the POA criteria. The mainnotion is that the price is consolidating and narrowing within the triangle.DefinitionA Point of Agreement MUST have the following characteristic. This is essential for a POAto be valid." Price activity can be captured by converging trend linesGuidelinesA Point of Agreement MAY have the following characteristics. These are not alwayspresent but the more of these characteristics a POA has, the better.""""Reducing volatilityReduced or reducing volumeThe MACD (red line) and its reference line are convergingDoji candle(s) prior to the Breakout (see page 12)An Equilateral Trianglehas a sloped upper line anda sloped lower line. Thelines are converging.These triangles can breakeither up or down18
In an Ascending Trianglethe upper line is horizontal,acting as resistance to theprice while the lower line issloped upwards.These are quite common inup trends.In a Descending Trianglethe lower line is horizontal,acting as support to theprice while the upper lineis sloped downwards.These are quite common indown trends.A wedge has an upper andlower line sloped in thesame direction and they arealso converging.A wedge is a valid POA,however, they are not verycommon and can be quitedifficult to identify.19
The following charts illustrate some of the attributes that MAY be seen in a POA. These arenot essential but improve recognition and the quality of the pattern.20
Breakout CandlesDefinitionA Breakout candle MUST have the following characteristics. These are essential for aBreakout to be considered valid and appear in the Newsletter.For LONG breakout trades the Breakout Candle MUST have" A close outside the Trend Lines" A close above the highest close of the previous pivot point high" A close above its midpoint (meaning the Breakout candle itself)" A close above the previous candle by at least half the ATR(17)" The MACD line is above its reference line and rising" A close greater than 20 cents to help ensure there is sufficient liquidityFor SHORT breakout trades the Breakout Candle MUST have" A close outside the Trend Lines" A close below the lowest close of the previous pivot point low" A close below its midpoint" A close below the previous candle by at least half the ATR(17)" The MACD line is below its reference line and falling" A close greater than 1 to help ensure there is still enough room above zero for theshare price to continue falling for a reasonable period.GuidelinesA Breakout Candle MAY have the following characteristics. These are not always presentbut the more of these characteristics a Breakout Candle has, the better.""""Increase in volatilityIncrease in volumeMACD line separates from its reference lineA gap occurs between the previous candle and the Breakout Candle21
In the chart below the Breakout Candle is strong and relatively large. It fulfils all themandatory requirements including closing above the highest close of the previous pivot pointhigh. Note that the MACD and its reference line are opening up and there is strong volume.In the next chart the Breakout Candle is not strong. It has a long upward tail and has closedbelow its mid-point. Also note that the MACD line is not above its reference line. This isnot a valid Breakout.22
The chart below shows a valid Breakout Candle. Note there is a gap preceding the BreakoutCandle which is a plus. It is also worth noting that the second last candle in this chart maylook like a Breakout Candle; however the MACD line was not above its reference line at thatpoint, thus invalidating it as a break out candle.23
Guidelines for choosing between Breakout TradesAll charts that appear in the ‘New Trades ’ section of the newsletter are acceptableBreakout trades according to this strategy. However if you want to be a bit more discerninghere are some guidelines.Point of Agreement Attributes" The POA clearly looks like it is narrowing and focussing into a point" The POA has significantly smaller candles towards the point; preferably Doji like ones" The POA is well contained within the trend lines; with minimal tails poking up ordown, and plenty of touches to the Trend Lines confirming their placement." There is reduced volume at the point of agreementBreakout Attributes" The Breakout Candle looks strong with the close near the high" The MACD indicator is opening up on break out" There is a gap between the Breakout Candle and the preceding candle" There is strong volume with the break out.24
Strategy Specific IndicatorsStop LossFor risk & money management purposes it is essential to have a Stop Loss. This is a pricelevel that follows along with a trade at a certain displacement. It will move in the directionof the trade if the price advances, at a given displacement, but will not retrace if the priceretraces. In this manner, any advance in price means more capital is protected.In this strategy there are two parts to the Stop Loss. The first part is an Initial Stop Losswhich ensures the Breakout Pattern remains valid during the trade while the second part is aTrailing Stop Loss that follows price as it progresses.The Stop Loss Indicator is a combination of these two components; taking the value that hasadvanced the most in the direction of the trade.Part 1 - Initial Stop LossEach Breakout from a Point of Agreement (POA) indicates the market is rejecting the POAand wants to move away from it. Therefore, if the price retraces back to the POA or movespast it after a break out, it means the break out is no longer valid. Note that, like any otherchart pattern, breakouts can fail.For this reason, the Initial Stop Loss should be set at the POA. A mid-line through thetriangle gives a guide as to where the theoretical POA should lie. The Initial Stop Loss isplaced on this line starting at the point of break out.25
Part 2 - Trailing Stop LossThe Trailing Stop Loss part of the Stop Loss indicator uses the Chandelier approach asdescribed by Chuck LeBeau. As the name suggests, a Chandelier Stop Loss hangs downfrom the highest high of the trade for LONG trades (or ‘hangs’ up from the lowest low of thetrade for SHORT trades). The reason this method is used is because it is instantly reactiveto any advance in price which is necessary when trading a strong rally.The trailing part of the Stop Loss uses a set displacement of 2 times the ATR (17) from thehighest high (or lowest low). A move either way of one ATR (17) is expected, given that thisis supposedly representative of normal price volatility. However a retracement of more thantwo ATR’s is abnormal and most likely signals a change in market direction.26
Entry Limit IndicatorThe breakout strategy described here is a nimble short term strategy. This means it is a goodidea to get into a trade fairly promptly. Therefore an Entry Limit indicator has been devisedto avoid chasing a rally too far.The Entry Limit is set as 2.5 times the ATR (17) above the Stop Loss at the beginning of thetrade. Since one times the ATR move would be an normal move, based on the calculation ofthe ATR, a 2.5 times the ATR is room enough for the Breakout Candle to have made adecent break but still allow an entry before the price has run too far. Recent back testingconfirms this.The Entry Limit is calculated once, at the Breakout Candle and is indicated on each chart inthe newsletter as a magenta line. This level stays fixed for the entire trade. Entry into abreakout trade should be made at a price between the Entry Limit and the Stop Loss,preferably in the week immediately following the Breakout Candle.27
Risk ManagementPosition RiskThe potential loss in owning each share is referred to as Position Risk. Traders normally usethe 2% rule that states;‘The total loss for any single trade must not exceed 2% of total capital’Your total capital is the current value of all shares held plus the total amount of cash on hand.By risking only 2% of our total capital on each trade it would take 194 consecutive losses tolose all of our money a situation that rarely occurs.The following example shows how the 2% risk rule can be used to calculate your positionsize in order to only risk 2% of capital in any one trade. To do the calculation you will needto know your Total Capital, the entry price and the Stop Loss for the share you intend topurchase.Example" We are trading with 20,000 total capital and using the 2% risk rule" Assume that the closing price of a share is 12 and the Stop Loss is set at 10. It is""""always assumed that the closing price is the probable entry price.The potential loss per share is 12 - 10 2 and 2% of 20,000 400Divide 400 by 2 to get the number of shares we can buy 200 sharesMultiply 200 by the closing price of 12 to get the position size 2,400Divide 2,400 by 20,000 and multiply by 100 to get the percentage of total capitalthat can be spent on this position 12%. This is the maximum position size for thisshare in this example using the 2% risk rule.The ‘Data Tables’ of the newsletter provide you with the ‘%Portfolio’ figure for each tradebased on using the 2% risk rule. This can easily be used to calculate your position size asfollows:Position Size (Your Total Capital) x ‘%Portfolio’Number of Shares Position Size / Share PriceExample" We are trading with 20,000 total capital." The share we have chosen has a closing price of 5 and a ‘%Portfolio’ figure of 13%" Position size 20,000 x 13% 2,600" Number of Shares 2,600 / 5 520 sharesRule!The 2% risk rule has been incorporated into the ‘%Portfolio’ figure.‘%Portfolio’ figure in the ‘Data Tables’ to calculate your position size.28Use the
Sector Risk (Also referred to as Industry Risk)We want to be able to capitalize on strong sectors without being exposed to a sector bubble.To limit our exposure we will only allocate a maximum of 40% of our total capital per sectorand a maximum of 6% position risk per sector, i.e. 3 positions per sector. (3 x 2% 6%)Guidelines!!Maximum of 40% of Total Capital per SectorMaximum of 3 positions per SectorPortfolio RiskPortfolio risk is the sum total of our position risk. Our portfolio can only have a maximum of10 shares. No single position can be greater than 20% of our total capital. By using the 2%position risk rule we will probably own somewhere between 6 and 9 different positions.Note that the more positions we have; the higher the portfolio risk.Rules!!Maximum of 10 sharesMaximum of 20% of Total Capital per position (‘%Portfolio’ figure is limited to 20%thus helping you to maintain prudent Portfolio Risk)Investment GuidelinesThe Breakout Trading strategy is a short term, medium
trading strategy; instead breakouts from POAs are traded using momentum as a guide since most rallies typically have significant momentum. Breakout Trade However, breakouts also occur during trends. So although this strategy focuses on trading rallies, parts of trends tend to be captured anyway. But without a doubt, the strength of this