Transcription
MELLIN-FOURIER CORRELATIONByEDWARD CARNEY FRIDAYDISSERTATION PRESENTED TO THE GRADUATE SCHOOLOF THE UNIVERSITY OF FLORIDA INPARTIAL FULFILLMENT OF THE REQUIREMENTSFOR THE DEGREE OF DOCTOR OF PHILOSOPHYUNIVERSITY OF FLORIDA1985
Copyright 1985byEdward Carney Friday
ACKNOWLEDGMENTSThe author wishes to thank Dr. Henry Register for hisencouragement to pursue graduate studies at the UniversityDr. Roland Anderson has provided counseling andof Florida.essentialcriticalreview during the years of experimentaleffort leading to publication.The Air Force Office ofScientific Research provided initialfunding for thisresearch through the basic research program conducted by theAir Force Armament Laboratory at Eglin Air Force Base,Florida.The finalstages of the research would have beenimpossible without the computing and word processingresources provided byIncorporatedEG&SpecialG.11Projects,
TABLE OF TRODUCTION1Limitations of Classical TechniquesThe Mellin-Fourier Correlation ProcessResults Obtained by Other WorkersAreas Investigated in this WorkIIIIIIVV1.179BACKGROUND12Experimental TechniquesTheory For Extending the NormalScale Invariance12APPLYING OPTIMUM SAMPLING TECHNIQUES26Examples of Optimum SamplingTesting Theoretical Predictions2644ADDITIONAL EXPERIMENTS52Higher Space BandwidthAdding Noise5256CONCLUSIONS6518REFERENCES69BIOGRAPHICAL SKETCH701V
Abstract of Dissertation Presented to the Graduate Schoolof the University of Florida in Partial Fulfillment of theRequirements for the Degree of Doctor of PhilosophyMELLIN-FOURIER CORRELATIONByEdward Carney FridayMay 1985Chairman: Roland C. AndersonMajor Department: Engineering SciencesThis dissertation evaluates the success ofapatternrecognition system which attempts to recognize an objectsize and orientation fromeven though the object differs inthe object used asareference.The criteria forrecognition were the peak value and shape of the crosscorrelation function calculatedintwo dimensions.Thecross correlation was performed using Fourier transformtechniques to judge the utility of implementing the systemusing many standard opticalcomponents.invariance was achieved usingaSize,orscale,logarithmic samplingtechnique (the Mellin transform), and variations ontraditionalsampling methods were shown to extend the scale
invariance predicted by previous reseachers.The utility ofthe sampling techniques developed was proven using imagesacquired from infrared sensors carried aboard helicopters.Limits of practicalscale invariance were explored andsystem design approaches were suggested from the results ofnumericalexperiments carried outVIincomputer simulations.
f.iCHAPTERINTRODUCTIONILimitations of ClassicalTechniquesPattern recognition is often performed in autonomoushardware by comparing imagery from an on-board sensor withanidealreference image storedorinmemory.aMilitarysystems frequently are required to recognize patterns eventhough they are slightly different from the reference forwhich the system was designed.Signalprocessing techniquesto overcome certain types of distortionsinsensed imageryThe most commonhave been described in the literature (1).distortions are scale and orientation changes.Classicalmatched filters are unreliable unless the reference andsensed objects are very nearly the same.signalisnoise ratio (SNR)to RMSused asaWhen the peakof the correlationfunctionfigure of merit for the holographic matchedfilter technique, lossesinSNR of 27db canoccur with aslittle as 2% scale difference and 3.5 degrees of orientationdi ference (2)The Mel1n-Fouri er Correlation ProcessDistortions such as scale changes and rotations of thepattern of the sensed image may be overcome by using theproper choice of geometricaltransformations.Since most
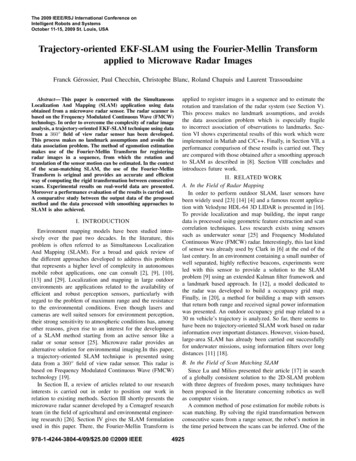
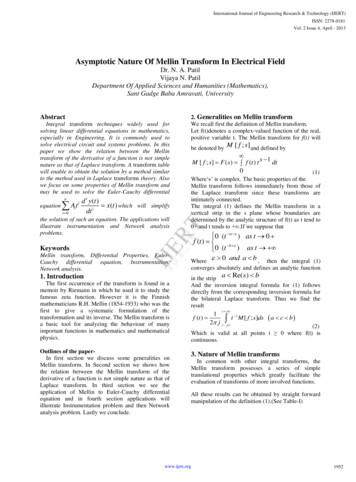
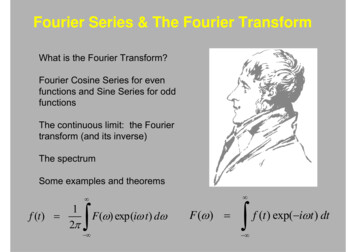
scale invariant transformations are not invariant totranslation, the Fourier transform magnitudeused as the firststepinaissometimespattern matching scheme toachieve shift invariance before the scale invarianttransformationgeometricalinvariant transformationresampling the originalcauses spatialisisperformed.The scaleachieved in practice byThis resampling processimage.distortion, e.g. warping,sometimes called space variant.Figureand1isthereforeshows the processused to achieve Mellin-Fourier (scale and shift invariant)correlation betweenareference image andasensed image.The first step is to calculate the magnitude of the Fouriertransform of the reference and sensed images.transformisnotThe Mellininvariant to object translation, so patternrecognition using Mellin transforms is usually done usingthe magnitude of the Fourier transform of an object.Thistechnique uses the shift invariance of the Fourier transformto provideresampling.acentered image for later exponentialThe magnitude of the Fourier transform isequivalent to the diffraction pattern obtained when an imageisused as the apertureof anopticalsystem.Thiscontains no phase, i.e. position, information, and aspatternaresult is invariant to the position of the pattern withinthe system field of view.The next step in the Mellin-Fourier correlation processisto perform the geometricaltransformation necessary to
111r- ,]-- iD-f1.—1— Q- :ri— -l11—1— :z u J ct uLlJ1— :C31— 13U- - 1—LUU-ooCOI/)(UAAs-Q.CD C3CDCX uo-z. — t—CC QQ-Qi O'QCCi s:Z&s-ouz.o1—hCC100 UJ LUoo CsL e3CC cCQioos:o o *—s0)10)O)AALUt 3Qz.LlJDi UJLlJ CDU ctUJ s:Qi —t11LUooz.LUOOLUCDa:s:t—(UCT
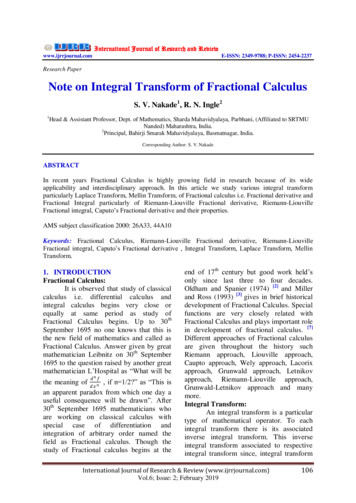
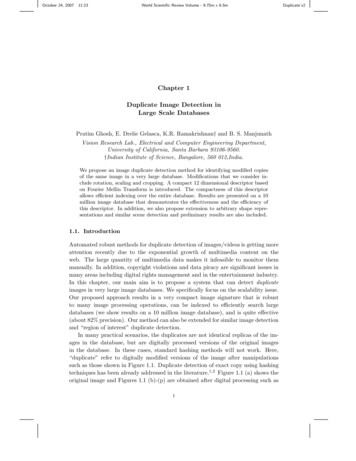
create an image which haschangesinusefularelationship to scaleThe geometric transformationthe input image.used in this research maps the Fourier transform polar planeintoarectangular plane.The orthogonalaxesthe newinrectangular coordinate system are defined as the logarithmof radialdistance and the polar angleThese axes are denoted as In (R)Fourier transform plane.and 0,respectively.The quantityfrom the zero frequency,logarithm ofRisor d.c.Rterm.the horizontalisdistanceThe naturalused in the transformation becausetransform plane causes9the radialismultiplicative scale change occurringThe quantitythe originalinainthe Fourierlinear shift in the In (R) axis.the angle measured counterclockwise fromaxis.WhenaFourier transform imagemapped using this geometric transformation,acorresponding to one or more locationsplane whenaFigure10X102isplanethe Fouriershows what happens in the ln(R),9scale change occurs in the originaltop image in Figurea2inisnew imageplane is created with each location in the In (R),9transform plane.aimage.Thethe ln(R),9 image generated byreference square.The ln(R),9 images below it aresensed images with various scale changes present.Asthescale of the sensed image changes, the pattern in theln(R),9 image simply translates.Featuresinthe ln(R),9
CDECDa:e0)-C4- coCO(UCDcf8x:( )(UreU(/) - Odlen
image do not change size as they would in the Fouriertransform image.of theItisthis scale-to-translation propertyln(R),9 mapping that is exploited in the scaleinvariant Mellin-Fourier correlator.The finalstep in Mellin-Fourier correlation isastandard cross correlation calculation performed with theln(R),Q reference and sensed images as inputs.correlatorinthis work is implemented withaThecomputersimulation, and cross correlation is performed usingtransform techniques rather than by direct calculation.This technique requires fewer calculations than crosscorrelation performed directly.Mellin-Fourier correlatorapeak value whoseXisaThe output of thecross correlation image withcoordinate reveals the amount of scalechange between the reference and sensed images. TheYcoordinate of the cross correlation peak gives the amount ofrotation difference between the reference and sensed images.This work is concerned with considerations in sampling theln(R),9 image and the scale invariance expected ofusing the sequence of operations describedinasystemFigure 1.addition, the effects of noise added to the reference andsensed images on the shape and amplitude of the crosscorrelation image are determined.In
Results Obtained by Other WorkersCassasent and Psaltis (3) have shown how space variantprocessors can be used to perform scale invariantWith their technique,correlation.changes inscale and rotationsensed pattern were converted intoaatranslation by use of the logarithmic coordinatetransformation described above.Standard shift invariantcorrelation methods, i.e., Fourier transform methods, werethen used for pattern recognition of the scaled function.Ananalysis performed by Cassasent and Psaltis showedthat the spatialdistortion introduced by the logarithmictransformation resultedrequirements.inincreased space bandwidthThe logarithmic coordinate transformationisequivalent to resampling an image at exponentially spacedintervals, and the increasesamples)smallisinspace bandwidth (number ofcaused by the oversampling which takes place atvalues of the input coordinate.Their analysisconsidered the increased sampling requirements imposed byfunction which moved partially out of the sampled domainwhen scaled byafactor A.rise to inaccuracies.said to increase by(A 2)awas accommodatedThis loss of information gaveSpace bandwidth requirements werefactor of 5.3 when 100% scale change(3).a
Analysis done by Anderson and Callary (4)involvedafunction which remained entirely within the sampled domainwhen scaled byafactor A.Inthis case, there were noinaccuracies introduced because the function was defined tobe zero outside the domainofinterest, and no informationabout the function was lost when scale changes occurred.They showed that the increaseinspace bandwidth could beminimized by careful choice of the constants usedlogarithmic coordinate transformation.oversampling at smallvalues of radialIntheintheir scheme,distance was governedby meeting the Nyquist criterion at the widestsamplinginterval, and by oversampling only to the extent necessaryto accommodate the predicted scale change.Using thisscheme, space bandwidth requirements increased byof only 2.7 when accommodatingaafactor100% scale change.Variations of this geometricaltransformation schemehave been reported by other researchers (5).Inthosestudies, the location of the correlation peak in theMellin-Fourier correlation plane was used to identify theactualscale change and rotation of the sensed image.Then,new reference image was synthesized at the properascale and rotation angle for application of traditionalcorrelation schemes.
.AreasInvestigatedthis WorkinThis study evaluates the success ofapatternrecognition system which attempts to recognize objects inasensed image which differ in scale and rotation from theThe intent is to establish the limits ofreference image.use for the Mellin-Fourier correlation techniquesthan to designratherspecific algorithm for pattern recognition.aExperience has shown that such algorithms are very dependentuponasystem application.The approach used here was to calculate samplingrequirements based onand then to useaadesired range of scale invariance,computer simulation of the correlationprocess to calculate system performance.The scale of thesensed image was then allowed to exceed the design limits ofthe system to find the effect on the correlation peak.Thecorrelation coefficient and the shape of the correlationpeak were used as figures of merit to judge the success ofeach trialThis study applies the theory of Mellin-Fouriercorrelation to imagery collected byahelicopter.asensor carried aboardThe correlator modeled here is intended torepresent an opticalimplementation ofascale invariant
10Such an opticalsystem.signalprocessing system can bemodeled realistically by numericaldynamic range of opticalisThe limitedsystems is simulated by scaling allimagery amplitudes betweentransformationexperiments.performed.and 255 each timeaThe response to high noiselevels is used to evaluate the immunity to backgroundTrials conducted with realclutter.arealistic test forasensed imagery providescale invariant pattern recognitionsystem intended for tacticalapplications.These trialsshow that the scale and rotation invariance predicted bytheory can be applied in practice.The space bandwidth ofthe correlator is varied, and the effects on the correlationimages suggest design approaches for equipment usingMellin-Fourier principles.Experimentaltechniques for both zooming anddownsampling the reference image are developed to be able toprovideasensed image of exactly the proper scale andorientation for Mellin-Fourier correlation.Inthis way,the Mellin-Fourier correlator is evaluated with respect tosmallscale differences in the input.The effect ofdifferent amplitude distributions of added noiseisthe peak value and shape of the correlation image.noted on
11The Mellin-Fourier image correlation process istwo-dimensionalinnature, but insight into the ln(R),9mapping operation and the correlation energy distributionisgained when results are presented in the form ofone-dimensionalplots.Inthis research, photographs takenfrom the television monitor of animage processing computerare used to portray the nature of the entire Melprocess, but one- dimens onaliofthe energy distributionare characterized byin1in- Fou ri erplots are used to show detailsthe correlationimage.Imagesplot of the intensity values alongaaline passing through the peak value of the image.Additionalexperimentaltechniques, such as rangeadaptive bandpass, are applied to extend the normalinvariance of the Meland Callarypeak asa(4)1in-Fouri er type correlator.scaleAndersoncalculated only the value of the correlationfigure of merit for the Mellin-Fourier correlator.This investigation calculates the entire correlationplane.imageUsing this technique, the advantages of spatialfiltering are made clear.
i.CHAPTER IIBACKGROUNDInthe course of this investigation,that use of the Melrequire carefulTransform (DFT).1itwasrecognizedn-Fouri er correlation principle wouldapplication of the Discrete FourierThe paragraphs that follow discuss severalaspects of the DFT and show how to properly apply it toevaluateapattern recognition system.Experimental TechniquesMethods Used to Calculate Accurate DFTsAsmentioned earlier,inapattern recognition systemwhich uses transform techniques to achieve invariance totranslation, scale, and rotation, the Fourier transformisusually used initially to provide translation invariance.Actualpattern recognition is performed on the magnitude ofthe Fourier transform of an object rather than the objectitself.When the Fourier transform is computed, thespectralresolution achieved may be insufficient forreliable pattern recognition even though the Nyquistcriteria have been met.The two issues of spectralresolution and Nyquist sampling must be consideredseparately12
13InaDFT algorithm, the input record consists ofpoints, each point representingspatialNunits,producingrecordaThe output of the DFT algorithm willlength NT units long.also containTdataNdata points, each point representingafrequency intervaldeltaf 1/MTThe discrete frequency spectrum is repeated periodically atinteger multiples of the sampling frequencythe magnitude of the spectrum beingf 1/T,withsymmetric about thefolding frequency(N/2) fThis folding frequency isadeltaf 1/2Tdirect result of sampling theinput signal, and gives rise to the Nyquist requirement ofsampling at twice the highest spatialinput signal.thesamplingIfisfrequency present indone at less than theNyquist rate, an effect called aliasing causes inaccuraciesinthe computedspectrum.The DFT of an input record may be calculated withresolution ofnotwillusebeen met.deltafeven though the Nyquist condition hasHowever, the values computed for the spectrumnot be accurate because of aliasing,for patternaand anyfurtherrecognition may produce misleading results.
14Alternatively, the number of data points, N, may be so smallthat the widely spaced samples do not completely describethe shape of the spectraleven though the Nyquistcurve,condition has been met and the samples are numericallyaccurate.Thus, two considerations apply to allrecognition schemes which use digitalSpectral1.invariant patterntransform techniques:resolution must be sufficient to showidentifying features of the pattern.Nyquist conditions must be met to assure2.numericalaccuracy of spectralsamples.Windowing and TruncationPracticalapplication of the principles above involvesdata windowing and truncation.manifestinthe spatialrespectively.These two effects aredomain and spatialfrequency domain,Windowing of input data must be performed tominimize the effects on the Fourier transform ofinput record length.alwaysafiniteThe DFT produces an output thatiscombination of the actual data spectrum and thewindow spectrum (6).The window is usuallyfunction of unity amplitude whichThe DFTaisarectangularmultiplied by the data.results in the convolution of the spectrum of thewindow with the spectrum from the pattern of interest.
15the DFT is periodic, Nyquist conditionshighest spatialbe N/2frequency presentaNsamplesthe spectrum. These spectralincomponents can be significantaliasing errors to occur.N/2record ofrectangular window cause very high spatialfrequencies to occurataThe abrupt transitions at thecycles per frame.edges ofinrequire that thecyclesisN/2cycles and can causeOne way to reduce the componentsthe edge transitions less abrupt byto makeusing one of the wellatknown smoothing windows such as theHamming, Manning, or cosine functions.condition alldata withaThe need towindow before computing the OFTProperstems directly from the Nyquist sampling condition.windowing assures numerical accuracy of all Fouriertransform samples computed using the DFT (6).usedinthis research tapered allvalue at each edge,The windowimages to 1/2 the originalreducing the frequency components at theedge of the Fourier transform plane.Inofaway completely analogous to windowing, truncationFourier transform records avoids errorscross correlation of two functions.InIfcomputing theone dimension,cross correlation of two records of lengthvalid data points.inNtheresults in 2Ntransform techniques are used toperform the cross correlation, each Fourier transformcomputed must be truncated to one-half its originalbefore multiplication and inverse transforming.sizeOtherwise,
16aneffect called cyclic correlation causes errors in thecross correlation plane (7).This effect is similar toaliasing, but occurs in the cross correlation domain insteadof thefrequency domain.spatialConsiderations for Geometric TransformationsThe spatialfrequency characteristics of the Fouriertransform magnitude of the input pattern must be consideredifsystem space bandwidth is to be used most effectively.The symmetry of the Fourier transform magnitude may be usedtoreduce space bandwidth requirements by taking allsamplesfrom the upper half plane of the diffraction pattern.Theupper half plane of the diffraction pattern contains allthe recoverable shape information about an object,though position information is lost.bandwidth (sampling capability)Allofevenavailable spaceshould be devoted to thisregion when the geometric transformation is done. Onlyaportion of the Fourier transform plane carries relevantshape information, andageometric transformation thatadapts to that frequency band and devotes fullthe mostrelevant spatialfrequenciesprovide the discrimination desired.toisInresolution tomost likely tothis way,invariancescale may be extended to cover more than the rangeobtained withafrequency band.transformation which maps overafixed
17Previous investigators have designed the polartransformation to operate overafixed spatialbandpassinthe Fourier transform plane, thereby limiting the inherentscale invar iance of the geometricaltransform (8).size information about the expected objectavailable,itisSinceoftenmay be used to select the most appropriatearea in the Fourier transform plane and thereby extend thenormalscale invariance of the Mellin-Fourier correlator.ChoosingInaFigure of MeritevaluatingMellin-Fourier correlator,aafigure ofmerit must be used which reflects the pattern recognitionability of the system.the tendency of manyExperimentalconsiderations such assensors to drift or change the averagevalue of an image over time may cause the cross correlationpeak value to decrease even though the pattern match withreference imagespatialisnearly perfect.frequency filterthe center,or d.c.,inIncases where thethe correlation plane includespoint, the correlation coefficienta
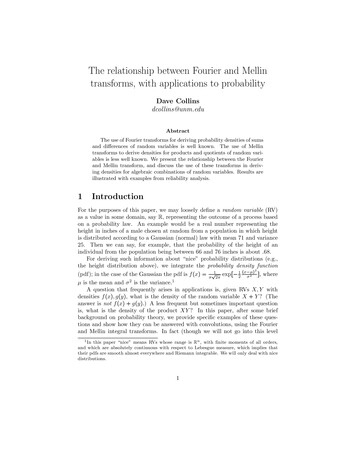
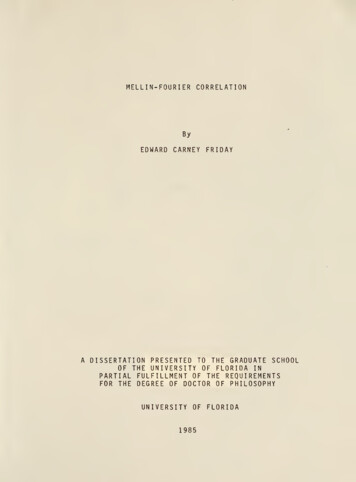
18should be normalized to the energy in the reference imageusing the expression/C(X,Y)[S(X'/[S(X'[,Y',Y') R(X X' ,Y Y)] dX'dY' ')]dX' dY/[R(X',Y'')] dX'dY']] / whereC(X,Y) correlation image planeR(X,Y) reference imageS{ X sensed image,YX',Y') coordinates used as dummy variablesincomputing the cross correlationThis expression was used for calculation of the correlationcoefficient throughout this work.Theory for Extending the NormalScale Invar ianceUse of the Mellin transform for pattern recognitionwould seem to require more space bandwidth,i.e., moresamples, than required to obtain the originalpattern.referencebrief analysis of the resampling process willAshow how the requirements for increased space bandwidth maybe minimi zed.The theory developed to make fullcapabilitydimension.spacinginisuse of samplingbest illustrated by an example in oneFigure3shows the relationship between samplethe Fourier transform plane,designated asspace, and sample spacing in the In (R),9 plane,Xdesignated
P'19asX'space.The samples inspace occur at equallyX'The coordinatespaced intervals of the variable X'.transformation that achieves scale invariancebyacurve that follows the functional 'k- k h'''isrepresentedformK n whereX,sJ.X',X„.m1 insample inknam pieXspaceuX'spaceminimum value of spatial frequencies in Fourier planeThe sampling in the Fourier transform plane extends over anbetween X„ „ and X„.„,and the samples havem nmaxintervala' 1non-uniform spacing along theXXaxis.The widest spacing inoccurs at X„, and the closest spacingoccurs at X„.K3max(J,Since the sample spacing inXis mostdense atX-,.1itisbest to assure that this part of the sampling curve hassamples inbandwidththeXisintervaldistanceinthe originalXmaxisthat are as far apart as possible if the systemto be mostateffectively used.Atthe same time,must be no greater than the NyquistXorder to preserve allthe information presentinThe slope of the logarithmic curve atimage.JJ1determined by the Nyquist requirement, and the spacefbandwidth ofX'spacethe sampling curve atlargely determined by the slope ofisX-1.
.20When Mellin-Fourier correlationdimensions, theaxisinX'axis in Figurethe ln(R),9 plane.Thefrequency coordinate, or R,the chosenIf3isdonetwoinrepresents the ln(R)axis represents the radialXthe Fourier transform plane.inregion in the Fourier transform plane does notchange position and adapt to the new object spatialfrequencies as the object scale changes, information mayenter or leave the annulus defined by earlier sizeestimates.image willThe new information appearingcause the cross correlation withpattern to be reduced.To preventtheinaIn(R),9referencethe reduction ofthecross correlation peak, the chosen region in the Fouriertransform plane must adapt by changing position whenchange occurs in the object.(1)sscaleSpecifically, system spacebandwidth may be conserved by using range adaptationwayaintwo:using expected object range to select the annulus ofspatialfrequenciesthe Fourier transform plane overinwhich resampling willbe doneand(2)using the analysis developed for minimizing the slope ofthe resampling curve atX.m1nto modify thetransformation equations to map the spatialannulus into the fullpianefrequencyspace bandwidth of the ln(R),9
21QAN D/1IIK !i\IVANJH V'QpAQPDATA CQMP ESSiQN -ND C;L-T!QN.-ei3-f. -i-- -i2-J1.5- 1H /. '3. -X '0.5 H/DFigureplane,3X.X SPACE Sample po;ntLN(X/.1j LN'(X/.S)Samole spacing in the Fourier transformspace, and in the ln(R),9 plane, X' space,
.22These steps willassure Nyquist sampling over the chosenregion in the Fourier transform plane,minimizeand willoversampling at the smallest value of the input coordinateAdapting The Coordinate TransformationThe upper curve in FigureusingX .anarepresents sampling done3fixed set of transformation equations in whichThe lower curve represents sampling done with.10.adaptive tranformation equation withrelevant information remains withinscale change occurs,shows that samplingi.e.,aX.inXspace are less severe,samples are further apart, than if the transformationgenerate sample coordinatessamples inX'inXspace.isused toThe number ofspace necessary to meet the Nyquist conditionskeep oversampling toand stillXathe lower curveequations are left fixed and the upper curveinIf thefixed domain whenand only translates,requirements.50. aminimumatXdetermines the space bandwidth requirements of the scaleinvariant correlation system.The theory developed byAnderson and Callary makes use of the assumption that noinformationandXallowed to leave the intervaliswhenascale change occurs (9).there are no "accuracy"inX.This means thatproblems such as the onesanalysis of Cassasent and Psaltis (10).for the savingsbetweenintheThis is the basisspace bandwidth claimed in Reference 9.
23Sample Adaptive CalulationAntoaspecific pattern to derivefor use inisashow how range adaptation may be appliedexample willaafrequency filterspatialMellin-Fourier correlation scheme.The filterwindow applied to the Fourier transform plane, definingThe width and boundary values ofthe area to be resampled.the region are determined by the nature of the object to berecognized and the expected range at whichencountered.willbe twoInthe Fourier plane,itwillbethe filter specificationvalues determined from calculations ofradialexpected object size in the sensor field of view.Theresampling scheme will then be applied to the region tominimize overs am plingFor this example,itthe Mellin-Fourier correlation.inassumed that other sensors haveisprovided approximate range asRmeters, and that the imageand Fourier transform are made up ofsensor field of view ispixels, P, occupied byInareference image,first spectralNarrays.If thedegrees, then the number offeature of size(NS)ax/(RSistan (F))square feature of sizePproducesalobe which goes to zero at N/P pixels fromthe center pixelincrossing definesaresampling.a PFNthe Fourier plane.The first zeroboundary value for the region chosen forTwo boundaries of the spatialfrequencybandpass may be established from estimated object feature
i24The two cutoff frequencies willsizes in the image plane.bandpassthen define an annulus of spatialinthe Fouriersensor withafield of view ofdegrees, the cutoff frequencies fora5transform plane.Formeter features ataameter object with.5range of 500 meters areupper frequencylower frequency N/Ptan(F))/S (R (500/. 5) 52tan(3)cycles/frametan(500/6) (3)cycl es/f name4space bandwidth of the MelThe full31n-Fouri er correlationresampling system may then be applied to an annulus between4pixels from the center or d.c. term in the Fourierand 52The transformation equation necessary fortransform plane.optimalresampling may be written in terms of radialdistancesinthe Fourier transform plane:R' ln(R)ln(R .J-where min ' maxThis equation is used to generate sample coordinates in theln(R),9 plane where the value of R „ is the lower spatialfrequency limit derived for the specific pattern,and the value ofRis,of 52Rpixels.4pixels,extends to the upper frequency limit,The region in the Fourierplane thatoversampled to construct the logarithmic data record does
25not beginuntilradius ofa4pixels has been reached in theFourier plane, thereby minimizing the overs am pling thatvalues of the Fourier radialoccurs at smallSince no data of interest lie beyondinthe Fourier plane,acoordinate.radius of 52 pixelsthe sampling that occurs atpixels52from the center can be made to just meet the Nyquistrate.The analysis above has shown how system space bandwidthdefine themay be conserved by using range adaptation toproper annulusthe Fourier plane and then adapting theintransformation equations to map the annulus into the ln(R),9plane.When range adaptation is performed asof signalanormalpartprocessing, like proper windowing, the spacebandwidth requirements ofbe expressedapattern recognition system mayterms of spectralinresolution in the Fourierplane rather than sampling bandwidth in the ln(R),9 plane.It maybeargued that knowledge of range for the sensedimage would allow the sensed Fourier transform to be scaledappropriately, thus making scale invariant , however,usually only approximate, making the sensedfrequency annulus poorly defined.valuable becauseerrorsinrangeitmakesaRange adaptation iscorrelator more tolerant tosize estimates for the sensed image.Evidence ofthis tolerance is shown in the examples of the next chapter.
.CHAPTER IIIAPPLYING OPTIMUM SAMPLING TECHNIQUESExamples of Optimum SamplingThe Fourier transform patterns in Figuresand4have5been generated to illustrate the technique of designingatransformation which maps the Fourier transform space intoanother space with coordinatesFigures4and5RThe patterns inrepresent the magnitude of the Fouriertransform of squares of sizes 10respectively.and 9.X10and 20X20,The Fourier transform image is represented byaplot of intensity along the center of the image.6andare from the R,9 mapped images.7of thefeaturesinFigures6and7FiguresStudy of the sizeshows that these featureschange size and position with the object scale change, justasthey do in the Fourier transform image before mapping.Inthis case the scale change encountered s8simply translate tothey do not change size.DistortionisHereanewHowever, newintroduced from the right in Figurepresent in Figure 8.9whichalso introducedboth figures because of the many-to-one mapping thatoccurs at smallpi9;factor of 2.(R),9 mapped images.are from the Inthe features present in Figureavalues of radialane26di
mellin-fouriercorrelation by edwardcarneyfriday dissertationpresentedtothegraduateschool oftheuniv