Transcription
White PaperA Guide to Preparing YourData for TableauWritten in collaboration with Chris Love, Alteryx Grand Prix Champion
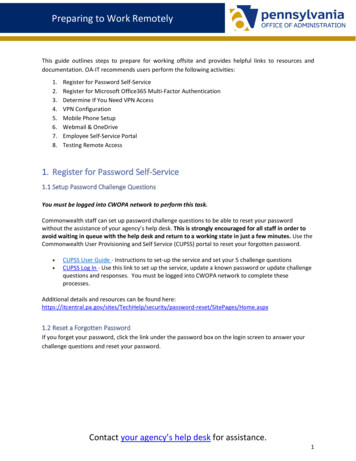
Consumer Reports, which runsIntroductionmore than 1.8 million surveysIf you’re like most data analysts today, creating rich visualizations of your datais a critical step in the analytic process. Visualizations let you pinpoint thetrends, discover the risks, and uncover the opportunities hidden in your dataso you can find the answers you need—and make the right data-driven decisionsfor your business.annually, saved thousandsof hours of manual labor byautomating its survey preparationand data reshaping processin Alteryx.But creating beautiful and elegant data visualizations that wow business usersrequires a significant amount of behind-the-scenes work to prepare the data—work that can take longer than creating the visualizations themselves.First, to get the most complete and accurate view of your business problemin context, you need to gather, blend, and cleanse data from an ever-growingnumber of disparate sources. Next, even when you’ve wrapped your armsaround your internal data sources, you don’t have the whole story. Thatrequires enriching your internal data with third-party data sources—such asdemographic or location information—and then running sophisticated spatialor predictive analytics. And finally, once you have generated your analyticapplication, the output may not be easily consumable for visualization andextra work may be required to get it ready for “prime time.”1. Gather andblend disparatedata sources4. Exploreand enablediscoveryin Tableau2. Enrich internaldata with thirdparty data andrun analyticsTo effectively leveragethe power of richvisualizations inmaking data-drivendecisions, you mustsignificantly reducefront-end datapreparation time3. Shape datafor visualizationAs a data analyst, you’re familiar with all of these challenges, and until nowyou’ve probably overcome them with manual workarounds. But thoseworkarounds are no longer enough, thanks to the rapidly changing nature ofdata as well as the speed at which business users ask questions and expectanswers. You’re still feeling overworked and scrambling to meet deadlines.In order to create visualizations that lead to answers quickly, you need toprepare your data in the right way. Together, Alteryx and Tableau can help.This paper will show you how.2
“Analysts spend a significantGather and Prepare Your Dataamount of time, over two-thirdsAlteryx makes it simple to gather all your relevant data sources into a singleworkflow so you can analyze your business problem in context. Whether yourdata is in a data warehouse, Excel spreadsheets, social media apps, Big Dataplatform, cloud apps, or any combination of these, you can quickly and easilycreate the data set you need in the intuitive drag-and-drop workflow ofAlteryx, without needing any special tools or programming skills.(69%), in data-related tasks in theanalytics process, comparedto the analytic ones where theirtime should be spent.”Mark Smith, CEO and Chief ResearchOfficer, Ventana ResearchOnce you have all the relevant data that’s required to answer the businessquestion at hand and you have your data set in front of you, you’re ready togo, right? Wrong! You still need to make sure your data set is free of duplicates,extraneous characters, trailing zeroes, and other data noise. How can youdetermine how much of your main product you have really sold if you have10 or 15 different product names that represent the same SKU? And howwill you know who your best customers are if your data has three differententries for a single company’s name, for example, one with “Inc.,” one without,and one that looks like another company but is really the subsidiary of yourlargest customer?Using Alteryx to blend and analyze data and then visualize analytic resultsin Tableau, Discovery Communications monitors its video editing processes,tracking its edit bays and which film clips are edited on which machine andby whom. Thanks to Alteryx and Tableau, operators can pinpoint the exactmachines or bays in which problems may have occurred, quickly recalibratingmachines and remediating errors. What’s more, by blending error informationwith editing information, the company can also determine if a particular editorgenerates an unacceptable number of errors, and then provide retraining onediting processes.For more information, please see http://bit.ly/DiscoveryComm.With Alteryx, creating standardized product and company name taxonomies,for example, is a snap. Thanks to built-in tools that automatically deduplicate,parse, and eliminate extraneous data, you can easily create the cleanestpossible data set.Plus, with Alteryx, you only have to define your cleansing process once.Every time you introduce or update your data, Alteryx automatically cleansesthe data set according to the rules you defined the first time. The result?A truly automated data preparation process.You can also use Alteryx in this step to ensure the data fits your specificpurpose, whether you plan to run predictive models or generate rich datavisualizations. For example, predictive modeling requires a narrow data setwith just a few specific variables to establish causality and then use thisdata to predict future outcomes. In contrast, when creating a visualization,you want as much data at hand as possible so you can recombine, compare,and view the data from different perspectives: by gender, by income level,by geography, by purchase level, and more.3
“All levels of my team, from dataEnrich Your Data and Run Analyticsscientists to business analysts,In some cases, you might not have all the information you need; your internaldata just needs more. More what? More context. With third-party data that’savailable with Alteryx, you can get the big picture in minutes.found they could use Alteryxwithin a couple of hours, to produceresults that would have takendays or weeks to get from IT.We can automate jobs in seconds,and spend more time analyzingdata instead of getting it.”Kim Carrico, Director of Marketing Planningand Analysis, Optimum LightpathNeed to determine how your customers stand out from the rest of thepopulation? No problem. Just use Experian Mosaic categories in Alteryx tosegment your customers. Then match your customers to these categoriesso you can target prospects with similar attributes.Which potential store locations will be the most profitable? Using theExperian data in Alteryx, you can answer that question by discovering howmany customers live within a certain distance or drive time from the store.Run Powerful Predictive AnalyticsConventional wisdom says that only highly trained data scientists andprogrammers with Ph.D.s can run predictive analytics, creating complexalgorithms to predict, for example, which product a customer will purchasenext and when. Conventional wisdom has changed, thanks to Alteryx.Using Alteryx, business analysts can harness the power of predictive analyticsby merely dragging and dropping pre-built predictive analytics macros andconfiguring those macros with a few items in a dialog box. Market-basketanalysis, linear regression, A/B testing, decision trees, and forest models are alljust a few keystrokes away for every business user, making them self-reliantand able to iterate quickly to answer new business questions.Based on previous data from other similar customers, you can use Alteryxpredictive analytics to determine the most likely next purchase, along with adegree of certainty for that prediction. You can also use predictive capabilitiesto determine which offers to give to which customers and whether to offerthem by mail or live on your website.What’s more, any predictive analytic model can be easily represented andvisualized in Tableau. You can use bar charts to represent treatment vs. nontreatment items in A/B tests. Or use bubble charts to represent market-basketanalysis and show how a customer’s purchase of one item can influence hispurchase of others.Leverage Spatial AnalyticsWhile retailers, supply chain managers, and transportation managers havelong known and leveraged spatial analytics, any organization that usesmobile technology is waking up to the power of spatial. With spatial analytics,you can track how traffic flows inside a store, the physical location of a buyerwhen she makes an online purchase, and even where the customer is physicallylocated when she expresses a sentiment about your product.What’s more, if you are planning to create any type of map in Tableau,Alteryx spatial analytics can help you create the relevant data set for yourbusiness decisions. Using Alteryx, you can create polygons that capture datawithin a specific area and then output that data directly to Tableau for visualrepresentation in a drive-time map, cell tower coverage area, disease outbreakarea, flood zone, and more.4
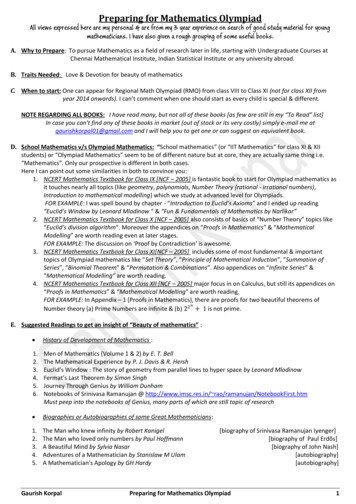
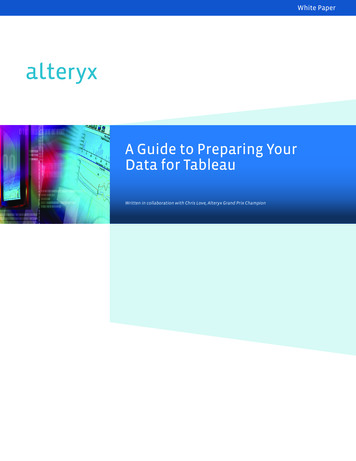
“Alteryx significantly enhances ourShape Your Data and Visualize in Tableauability to help people make senseEven though you’ve blended and enriched a clean data set and performed theright spatial and predictive analytics in Alteryx, your data might not be in theright format for visualization. Maybe you need to transpose rows and columnsor regroup the data in a different way that makes sense.of data. When used in combinationwith Tableau, the ease with whichcomplex data sets can first beprepared in Alteryx and thenvisualized in Tableau is incredible.”Craig Bloodworth, Tableau Zen Masterand CTO, The Information LabUsing Alteryx, you can reshape your data to make it easily consumable inTableau. For example, many companies work with survey data, which isgenerally stored in long rows of responses per respondent. If you try to usesurvey data in this format as the underlying data for a visualization, you’ll endup with gibberish. Instead, visualizing survey data requires a reshaping of thedata into columns that relate to each question. Alteryx makes this type ofreshaping easy and automatic, eliminating hundreds and even thousandsof hours of manual effort to reformat the data for Tableau.And, with the ability to output TDE files directly to Tableau, Alteryx enablesa near-instant iteration process. Just add a new data source, run Alteryx,and view the results in Tableau. Or change your analytics model, run it inAlteryx, and visualize and discover the results in Tableau. It’s that simple.No need to re-cleanse and reshape your data every time you update—it’s all automated and repeatable.What’s more, Alteryx can launch Tableau Workbooks, which also use TableauTDE files. This means you can not only launch your Tableau file when youupdate your content, but you can also launch it in the context of yourTableau Workbook and see how it impacts existing formatted visualizations.Experian Mosaic DataERP Sales SystemTomTom Geospatial DataCRM SystemDrivetime AnalysisERP Sales DatabaseVisualizing blended data in Tableau5
ConclusionCreating visualizations are a big part of your job as a data analyst—and it isonly becoming more important. But if you are spending 50 to 75 percent of yourtime preparing your data for visualization instead of creating the visualizationitself, you’re not giving business users what they need to pinpoint trends,discover risks, and take advantage of time-critical opportunities when theyneed it.About AlteryxAlteryx is the leader in data blendingand advanced analytics software.Alteryx Analytics provides analystswith an intuitive workflow for datablending and advanced analyticsthat leads to deeper insights in hours,not the weeks typical of traditionalapproaches. Analysts love the Alteryxanalytics platform because they candeliver deeper insights by seamlesslyblending internal, third-party, andcloud data, and then analyze it usingspatial and predictive drag-anddrop tools. This is all done in a singleworkflow, with no programmingrequired. More than 400 customers,including Experian, Kaiser, Ford,and McDonald’s, and 200,000 usersworldwide rely on Alteryx daily. Visitwww.alteryx.com or call 1-888-836-4274.Alteryx is a registered trademark ofAlteryx, Inc.230 Commerce, Ste. 250, Irvine, CA 92602 1 714 516 2400www.alteryx.comTo create the rich visualizations that lead to answers quickly, you need Alteryxand Tableau. Pull together all the relevant data for the most complete, accurateview of your business problem in Alteryx. Use Alteryx to enrich your internaldata with third-party data source and run powerful predictive or spatialanalytics to get the big picture. Shape your analytic results in Alteryx for easyoutput to and consumption in Tableau. And do all the heavy lifting once andautomate the process for future content updates. The result? Less time spentpreparing data for visualization and more time actually exploring the data andenabling discovery in Tableau.For more information, please go to alteryx.com/tableauAlteryx is a registered trademark of Alteryx, Inc. 6/14
A Guide to Preparing Your Data for Tableau Written in collaboration with Chris Love, Alteryx Grand Prix Champion. 2 Introduction If youÕre like most data analysts today, creating rich visuali