Transcription
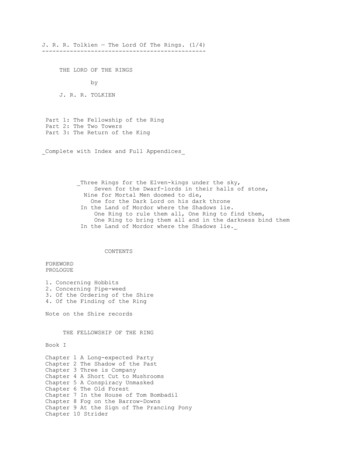
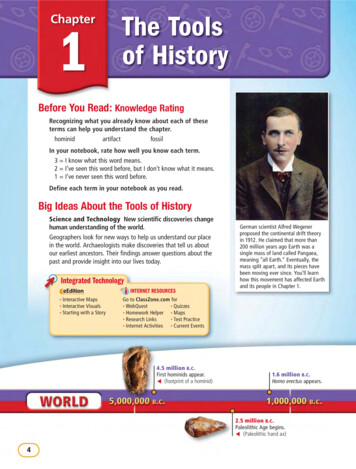
Chapter1The Toolsof HistoryBefore You Read: Knowledge RatingRecognizing what you already know about each of theseterms can help you understand the chapter.hominidartifactfossilIn your notebook, rate how well you know each term.3 I know what this word means.2 I’ve seen this word before, but I don’t know what it means.1 I’ve never seen this word before.Define each term in your notebook as you read.Big Ideas About the Tools of HistoryScience and Technology New scientific discoveries changehuman understanding of the world.Geographers look for new ways to help us understand our placein the world. Archaeologists make discoveries that tell us aboutour earliest ancestors. Their findings answer questions about thepast and provide insight into our lives today.Integrated TechnologyINTERNET RESOURCESInteractive Maps Interactive Visuals Starting with a Story German scientist Alfred Wegenerproposed the continental drift theoryin 1912. He claimed that more than200 million years ago Earth was asingle mass of land called Pangaea,meaning “all Earth.” Eventually, themass split apart, and its pieces havebeen moving ever since. You’ll learnhow this movement has affected Earthand its people in Chapter 1.Go to ClassZone.com for WebQuest Quizzes Homework Helper Maps Research Links Test Practice Internet Activities Current Events4.5 million B.C .First hominids appear.(footprint of a hominid) 1.6 million B.C .Homo erectus appears. 2.5 million B.C .Paleolithic Age begins.(Paleolithic hand ax)4
Continental Drift TheoryPA200 million years agoEarth was a single mass ofland surrounded by water.NORTHAMERICANGAPANTHALASSAOCEANTethysSeaEAA S I A65 million years agoSOUTHAMERICAThe mass split apart, and the partsmoved in different AAfricanPlateA S I APacificPlateIndoAustralianPlateAUSTRALIAAntarctic PlateANTARCTICA8000 B.C .Neolithic Age begins.(Neolithic clay mask) 200,000 B.C .Neanderthals appear.40,000 B.C .Cro-Magnons appear.(Cro-Magnon skull) The continents continueto drift apart.EUROPEEurasianPlate5
Background: On September 12, 1940, fourteenage boys explored a cave in the Frenchcountryside. It looked as if no one else had been therefor years. But the walls were covered with strangepaintings of animals in vivid colors of red, yellow, andbrown. The boys had stumbled across a cave filled withmasterpieces by prehistoric artists.Now step inside the Lascaux (la SKOH) Cave anddiscover the paintings with the teenage explorers. Painting in the Lascaux Cave6 Chapter 1
Starting with a Storyn September 8, Marcel went on a treasure hunt. For years, peoplehad talked about a secret underground passage in the countrysidearound their French village. They said that the passage led tohidden treasure. The French teenager thought he had found it whenhe discovered the opening to a long vertical shaft. Four days later, onSeptember 12, Marcel and three of his friends returned to explore it.This time, Marcel brought an oil lamp to light the way. One after theother, the boys wriggled down the long passageway. Finally, they tumbledinto a huge cavern, and Marcel held up the lamp. By its flickering light,they noticed a narrow, high passage. The friends entered the passage,and Marcel shone the light on its walls. What the French teenagers sawamazed them.Herds of horses, oxen, and deer stampeded across the curving cavewall. The colorful animals seemed to leap off the walls. Excitedly, theteenagers ran through the cave and found room after room of paintings.They had found the real treasure of Lascaux.At first the four teenagers promised to keep their great discovery asecret. But this secret was too hard to keep. They told their teacher, whocontacted an expert. The expert said that the boys were probably the firstmodern people to lay eyes on this art. The paintings had been sealed inthe Lascaux Cave for at least 17,000 years.The cave walls are covered with more than 1,500 pictures of animals.Many of the animals include those that the early people of Lascaux hunted.Historians believe that the people told stories about the animals and sang asthe artists painted them. But these oral stories are lost forever.What do these cave paintings tell you aboutthe people who painted them?1. READING: Speaker This story is told by a third-personnarrator. How would the story be different if Marcel orone of his friends told it?2. WRITING: Explanation Research to find out what hashappened to the Lascaux Cave, and write a paragraphexplaining your findings.7
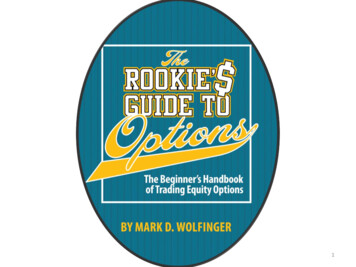
Lesson1MAIN IDEASGeography Continents, landforms, and bodiesof water shape our planet.Geography Geographers organize informationinto five themes.Geography Where people live has an impacton how they live.TAKING NOTES Earth This “blue marble”Reading Skill: SummarizingWhen you summarize, you supply only main ideasand important details. Identify the main ideas andimportant details in each section of Lesson 1. Thenput them in your own words and record them in adiagram like the one below.image of Earth was put togetherusing a collection of satellitepictures taken in 2001. It is themost detailed true-color imageever produced of Earth.Looking at EarthMain IdeadetaildetailSkillbuilder Handbook, page R3Words to KnowUnderstanding the following words will help you read this lesson:theme topics ofdiscussion (page 11)precise very definite orexact (page 11)The themes studentsaddressed in their firstclass were all related togeography.She used a special map toidentify the precise locationof the valley.8 Chapter 1interaction when twoor more things affect eachother (page 11)Clothing styles sometimesreflect the interactionbetween humans and theirenvironment.influence to havean effect or impact onsomething (page 12)The climate influenced thetypes of shelters people built.
TERMS & NAMESgeographyThe onBuild on What You Know How would you describe yourtown? Is the land flat or hilly? Does a river run nearby?Who lives in your town? When you answer these questions,you describe your town’s geography. Your town is part of theworld’s geography.Looking at EarthESSENTIAL QUESTION What do geographers study?Scientists study the land and water that cover Earth. Theyalso study how people live on Earth. The study of Earth andits people is called geographygeography.Continents Earth is divided into seven large landmassescalled continentscontinents. You can see the continents on the mapbelow. From largest to smallest, the continents are Asia,Africa, North America, South America, Antarctica, Europe,and Australia.ARCTIC OCEANContinents of the WorldArctic Circle60 NASIAEUROPENORTHAMERICA30 NTropic of CancerPACIFICOCEANPACIFICOCEANAFRICA0 SOUTHAMERICAATLANTICOCEANEquatorINDIANOCEANTropic of CapricornAUSTRALIAN30 SEWS60 SAntarctic CircleANTARCTICA150 W120 W90 W60 W30 W0 30 E60 E90 E120 E150 EThe Tools of History 9
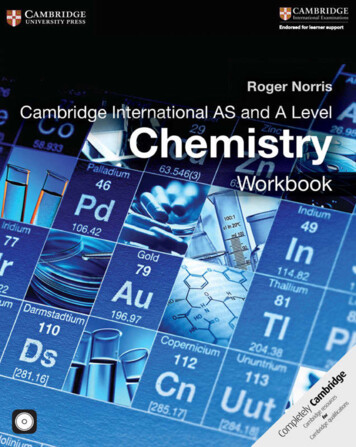
EarthquakesAt about 5:12 A.M. on April 18, 1906, the groundshook along the west coast of the United States.The earthquake was centered around San Franciscoand destroyed much of the city, as shown in thephotograph on the upper right.The San Francisco earthquake was causedby plates sliding along a fault line, or break inEarth’s crust. The diagram on the lower rightshows their movement.1 Plate A slides in one direction.Fault Line2 Plate B slides in the opposite direction.323 The plates move past each other at thefault line, causing an earthquake.GEOGRAPHY SKILLBUILDERINTERPRETING VISUALS HumanEnvironment Interaction Basedon the photograph above, what aresome of the effects of earthquakes?Plate A1Shifting Plates Scientists believe that the continents lie on largemoving plates. Plate movements form mountains and volcanoesand cause earthquakes. The movements slowly but continuallyreshape Earth. (You can learn more about the plate movementsthat cause earthquakes in the Geography feature above.)Landforms and Bodies of Water Two continents—Australiaand Antarctica—are islands. An island is a landformlandform, or naturallyformed feature on Earth’s surface. Mountains are also landforms.Other landforms include plateaus, which are high, flat areas, andplains, which are large, level areas of grassland.Although Earth has many kinds of landforms, water coversabout three-fourths of our planet. The largest bodies of water onEarth are called oceans. The four major oceans are the PacificOcean, the Atlantic Ocean, the Indian Ocean, and the ArcticOcean. Smaller bodies of water include rivers and lakes.What are Earth’s largest landmasses and bodies of water called?10 Chapter 1Plate B
Themes of GeographyESSENTIAL QUESTION What are the five themes of geography?Geographers use five themes of geography to describe Earth. Thefive themes help us understand our world and how we fit into it. Location The geographic question, Where is it?refers to location. Location can identify a precisespot or tell where one place is in relation toanother. Place The question, What is it like? refers to place.Place includes physical characteristics as well ashuman ones, like language, religion, and politics. Region The question, How are places similaror different? refers to region. Region comparesphysical and human characteristics. Movement The question, How do people, goods,and ideas move from one location to another?refers to movement. Human-Environment Interaction The question,How do people relate to the physical world?refers to human-environment interaction. PeopleConnect to Todaylearn to use and change what the environmentHurricanes Naturaloffers them.disasters have a greatWhich two geographic themes are most concernedwith people?How EnvironmentAffects Peopleimpact on peopleand their homes. Thisphotograph shows peoplefleeing during a 1998hurricane in Florida. ESSENTIAL QUESTION How doesclimate affect people’s lives?You probably wear a coat incold weather and dress in lightclothing in warmer weather.Of course, different peoplemay develop different ways ofadapting to the same area. Butyour environment—particularlyits climate—has a big impacton the way you live.11
Climate Weather refers to the temperature and conditions in aparticular place at a particular time. ClimateClimate, on the other hand,describes the weather conditions in a place over a long period oftime. Climate can influence where people live. For example, theharsh conditions of a cold, wet climate may prevent people fromsettling in that region.Climate also has a big impact on the type of vegetationvegetation, orplant life, that grows in a location. For instance, thick junglevegetation grows well in a tropical climate with heavy rainfall,while crops may be difficult to grow in a hot, dry climate.How does environment affect people?Lesson Summary Earth’s largest landmasses, called continents, aresurrounded by oceans. The five themes of geography help us explain ourplace in the world. Climate can affect how and where people live.Why It Matters Now . . .Geography helps us learn more about our neighbors and theways we affect the world we share.1Homework HelperClassZone.comTerms & Names1. Explain the importance ofgeographylandformcontinentclimatevegetationUsing Your NotesSummarizing Use your completed diagram toanswer the following question:2. What are Earth’s main geographic features?Looking at EarthMain IdeadetaildetailMain Ideas3. Name three examples of landforms and threeexamples of bodies of water.4. How do the five themes of geography helpgeographers?5. How does the climate where you live affectyour life?Critical Thinking6. Understanding Cause and Effect What mightbe the result if the climate of a region suddenlybecame much colder?7. Making Inferences Since more people live onAsia than on any other continent, what can youinfer about Asia’s environment?Planning a Mural Work with a group of classmates to plan a mural that represents the physicalfeatures, climate, and vegetation in your town.12 Chapter 1
Extend Lesson 1Make a GeographyThemes PosterGoal:To understand that the five themes of geography relateto people’s everyday livesMaterials & Supplies poster board magazines scissorsPrepare1Reread “The Five Themes of Geography” on page 11.2Think about pictures that would illustrate each theme’s question. tape or glue pen or pencilDo the Activity1Get together with a group of four other classmates. Eachmember should choose a different geography theme.2Look through magazines and cut out a picture that illustratesyour theme. Note that the group member who selects region willneed to find and compare two pictures to illustrate the theme.3After all members of the group have found their pictures,arrange all five illustrations on a poster.4Label each picture with its theme. Write a caption explaininghow the picture answers the theme’s question.Follow-Up1What does the picture illustrating movement show?2What similarities and differences do the picturesillustrating region show?ExtensionMaking a Brochure Use the five themes ofgeography to make a brochure about yourcommunity. Find or draw pictures thatillustrate the themes.13
Lesson2MAIN IDEASGeography Geographers use maps and globesto measure and describe Earth.Geography We use maps to see natural andhuman-made features and to understand patterns.Geography Maps have changed over timeto reflect people’s increasing understandingof the world.TAKING NOTES Compass Early navigatorsReading Skill: Comparing and ContrastingWhen you compare and contrast two things, you lookfor ways in which they are similar and different. InLesson 2, compare maps and globes, two types ofmaps, and two periods of mapmaking. Record theirsimilarities and differences in a Venn diagram like theone below.MapsonlyBothused compasses, like thisearly Chinese one, to figureout where they were.Invented by the Chinese,the compass opened up theworld to exploration andhelped geographers makemore accurate maps.GlobesonlySkillbuilder Handbook, page R4Words to KnowUnderstanding the following words will help you read this lesson:prefer to like bettersymbol a thing thatindicate show or point(page 15)stands for something else(page 16)out (page 16)The geographer said shewould prefer to see the siteherself.14 Chapter 1They were unable toidentify the meaning orpurpose of the symbols.On the map, arrowswere used to indicate thedirection in which the watercurrents flowed.
TERMS & NAMESHow Maps HelpUs Study Historylongitudelatitudehemispherepolitical mapphysical mapthematic mapBuild on What You Know You probably use maps whenyou visit the mall, get on a bus, or take a trip with yourfamily. The skills you use to read those maps can be appliedto read any map.The Geographer’s ToolsESSENTIAL QUESTION What are the geographer’s tools?Geographers use both globes and maps to represent Earth.Both tools have advantages and disadvantages.Globes One advantage of a globe is that it looks more likeEarth, since both are round. A globe shows the viewer exactlyhow continents and oceans appear on Earth’s curved surface.A globe also shows the true shapes,locations, and relative sizes of Earth’slandforms and bodies of water.Globes Onedisadvantage of usinga globe is that you canview only half of Earthat a time. This globeshows parts of Northand South America. Maps A map, on the other hand,is a flat representation of Earth’ssurface. It can be drawn to any size.No flat map can ever be as accurateas a globe. That is because Earth’ssurface is distorted somewhat when itis flattened to create a map. In otherwords, a map can alter how Earthreally looks. But most people preferto use maps because they do haveseveral advantages. For one thing, amap lets you measure distances muchmore easily. For another, a map letsyou see the world at a glance. Mostimportant, it’s much easier to carry amap because you can fold it up!The Tools of History 15
1Annual Rainfall in Australia2INDIANOCEANNEW9S1Title2Compass rose3Symbols4Legend5Lines of longitude6Lines of latitude7Scale8Labels9Colors10 S20 STropic of Capricorn3National capital8 AUSTRALIAOther city4Annual Rainfallin InchesBrisbanePerthSydneyAdelaideCanberraOver 40 (100 cm)20–40 (50–100 cm)5710–20 (25–50 cm)6Under 10 (25 cm)0500050030 SMelbourne1000 milesCoralSea1000 kilometers40 STasmania100 E110 E120 E130 E140 E150 E160 EReading a Map Most maps have nine features, as shown in themap above. These features, described below, help you read andunderstand maps. Title The title tells the subject of the map andgives you an idea of what information is shown. Compass rose The compass rose showsdirections: north, south, east, and west. Symbols Symbols represent such items as capitalcities and natural resources. The map legendexplains what the symbols mean. Legend The legend, or key, lists and explains thesymbols and colors used on the map. Lines of longitude These are imaginary linesthat measure distances east and west of theprime meridian. Lines of latitude These are imaginary linesthat measure distances north and south ofthe equator. Scale A scale can be used to figure out thedistance between two locations on a map. Labels Labels indicate the names of cities,landforms, and bodies of water. Colors Colors represent a variety of informationon a map. The map legend explains what thecolors mean.16 Chapter 1170 E
Map Projections As you have already learned, flat maps distortEarth’s surface. Mapmakers try to control this distortion byusing different projections. A projection is a way of showingthe curved surface of Earth on a flat map. Compare the threecommon projections shown below.GreenlandMercator Projection TheMercator (muhr KAY tuhr)projection shows most of thecontinents as they look on aglobe. However, the projectionstretches out the lands nearthe north and south poles.For example, the island ofGreenland is actually one-eighththe size of South America.South AmericaHomolosine Projection Thehomolosine (hoh MAHL uh SYN)projection divides the oceans.This projection fairly accuratelyshows the sizes of landmasses.But distances on the map arenot correct.Robinson Projection TheRobinson projection is oftenused in textbooks. It showsall of Earth with nearly thetrue sizes and shapes of thecontinents and oceans. However,the shapes of the landformsnear the poles appear flat.The Tools of History 17
Hemispheres To study Earth, geographersThe Geographic GridNorthernHemispheredivide the globe into equal halves. Each half iscalled a hemispherehemisphere. An imaginary line called theequator divides the globe into north and southhalves. The half of Earth north of the equator iscalled the Northern Hemisphere. The half southof the equator is called the Southern Hemisphere.Geographers use another imaginary line todivide Earth east from west. This line is calledthe prime meridian. The half of Earth westof the prime meridian is called the WesternHemisphere. The half east of the primemeridian is called the Eastern Hemisphere.As you can see in the diagram on the left, theUnited States is located in the northern andwestern hemispheres.ORTH 0OLE%QUATORSouthernHemisphere3OUTH 0OLEWesternHemisphereThe Geographic Grid The diagram alsoEasternHemisphere.ORTH 0OLE ª ª% ª7 ª%0RIME -ERIDIANLongitude ª7 ª7Lines ª% ª ª7 ª% ª7 ª%.ORTH 0OLE ª. ª.LatitudeLines ª. ª%QUATOR ª3 ª3 ª33OUTH 0OLEshows two globes marked with lines of latitudeand longitude. As you have already learned,latitude lines lie to the north and south of theequator. Longitude lines go around Earth overthe poles. These lines run east and west of theprime meridian.Geographers use a grid system to find thepoint where a latitude line and a longitudeline cross. This point identifies an absolutelocation—the exact place on Earth where acity or other geographic feature can be found.Remember that location is one of the themesgeographers use to describe Earth.Absolute location is expressed using thecoordinates, or set of numbers, of the latitudeand longitude lines. These coordinates aremeasured in degrees. Every place on Earth hasonly one absolute location. For example, asyou can see on the map on the following page,the absolute location of Rio de Janeiro, Brazil,is 23º south latitude, 43º west longitude.How do the latitude and longitude lines ona map help geographers?18 Chapter 1
Different Maps for Different PurposesESSENTIAL QUESTION What different maps do we use to see natural andhuman-made features and to understand patterns?Different maps help us see different things. The three basic typesof maps are political maps, physical maps, and thematic maps.You have probably used all of these different types of maps.Political Maps Political maps show the features peoplehave created, such as cities, states, provinces, territories, andcountries. State and country boundaries can also be outlined onthese types of maps. A political map of a smaller area, such as astate, often shows county boundaries.Here are some of the questions the features of a politicalmap, like the one below, might help you answer: Where on Earth’s surface is this area located? What is the size and shape of the area? Howmight its size or shape affect its people? Who are the area’s neighbors? How populated does the area seem to be?Political Map: OMBIAECUADORaAmW0E0400400800 miles800 kilometersSInternationalboundariesrz on R i v eEquator0 National capitalOther �liaBOLIVIAverraPARAGUAYTropic of CapricornnáRi20 SPaSão PauloRio deJaneiroINTERPRETING MAPSLocation In what part of Brazil isCHILEARGENTINA80 WGEOGRAPHY SKILLBUILDER60 WRio de Janeiro located?Pôrto AlegreURUGUAY40 WThe Tools of History 19
Physical Map: BrazilFRENCHGUIANA(Fr.)GNA NDSAH UVENEZUELA IGHL IACOLOMBIANegro RiverECUADOREquatorn R i ve rerCapeSão RoqueivAMAZONBASINPERUzoA maATLANTICOCEANMadeiraRRecifeBRAZIL400400800 miles800 kilometersElevation13,100 ft. (4,000 m)6,600 ft. (2,000 m)1,600 ft. (500 m)650 ft. (200 m)0 ft.(0 m)Below sea level0 National capitalANOther cityDESRiverNBrasíliaWEuayRragiverS20 SranáPaaAltacaemDes rtPARAGUAYPaSão PauloTropic of CapricornRio deJaneiroRiverGEOGRAPHY SKILLBUILDERUruguayCHILEARGENTINA80 W0BRAZILIANHIGHLANDSMATO GROSSOPLATEAUBOLIVIAPACIFICOCEAN060 WINTERPRETING MAPSRegion What is the elevation of thePôrto AlegreURUGUAYland around the Amazon River?40 W20 W40 SPhysical Maps On a physical map, you can see what Earth’ssurface might look like from space. Physical maps show thelandforms and bodies of water found in particular areas.Colors are often used to show elevations. On the map above,for example, brown indicates higher, more mountainous areas.Green shows areas that are relatively flat.Political and physical features are often shown on one map.When this information is combined, you can use it to help youbetter understand the region. For instance, find the cities shownon the physical map of Brazil above. Notice that many of thesecities are located near the coast.Like political maps, physical maps can help you understandspecific characteristics of places. Here are some questions thefeatures of a physical map might help you answer: Are there mountains or plateaus in the area? Near what physical features do most people live? What is the area’s range of elevation? How mighthigher and lower elevations affect people’s lives? In which direction do the rivers flow? How mightthis affect travel and transportation in the area?20 Chapter 1
Thematic Maps A thematic map includes certainVocabulary Strategyinformation about a place or region. For example, theThematic and themebelong to the samethematic map on this page shows the climates in Brazil.Thematic maps can use colors, symbols, lines, or dots to word family. Bothwords refer to a topic.help you see patterns. The map’s title and legend will helpyou understand the theme and the information presented.In this textbook, you will find thematic maps on such topics ashistorical events, vegetation, and population density.In fact, a thematic map can show just about any kindof information you can imagine. Here are just a few of thequestions different thematic maps can help you answer: Where in the world do people speak Spanish? What are the natural resources of Africa? What is the best route for sailing across theAtlantic? Where and when did key battles take placeduring World War II? Where were the major trade routes in Asia inancient times?Which type of map might help you find the highest mountainin Brazil?Thematic Map: Climates of COLOMBIA400400800 miles800 kilometersETropical wetSTropical wet and dryEquator0 SemiaridECUADORHumid FICOCEANBrasíliaBOLIVIAGEOGRAPHY SKILLBUILDERRio deJaneiroTropic of CapricornPARAGUAYSão PauloDo you think many people live innorthern Brazil, where the country’srain forest lies? Why or why not?CHILEARGENTINA80 W60 W20 SINTERPRETING MAPSHuman-Environment InteractionPôrto AlegreURUGUAY40 WThe Tools of History 21
Map from the Past This map of North and South America was drawn by European mapmakers in1570. As you can see, the mapmakers had only a rough idea of what the two continents looked like.How Maps ChangeESSENTIAL QUESTION How have maps changed to reflect people’sincreasing understanding of the world?Have you ever made a map to show someone how to get to yourhouse? A map you would draw today would probably be muchbetter than one you made in first grade. Maps showing differentparts of the world have also greatly improved over time.Earliest Maps The very earliest maps were probably scratched onthe ground or drawn on tree bark. The oldest surviving maps werecarved on clay tablets by the Babylonians around 2300 B.C.The ancient Greeks made great advances in developingmaps. In the second century A.D., a Greek astronomer andmathematician named Ptolemy (TAHL uh mee) producedan eight-volume work called Geography. This work containedvaluable instruction on preparing maps.Maps in the Middle Ages In the Middle Ages, Arab andChinese mapmakers used their knowledge of astronomy andmathematics to draw accurate maps of parts of the world. Bycontrast, European mapmakers filled empty spaces on theirmaps with pictures or warnings. This was partly becausePtolemy’s work was not available to Europeans until about 1405.22 Chapter 1
European maps greatly improved after 1569, when a Flemishmapmaker named Gerhardus Mercator showed the curvedsurface of Earth on a flat map. His Mercator projection,which you learned about on page 17, helped explorers plotstraight routes on maps.Today’s Maps Many modern maps are made with thehelp of the satellites of the Global Positioning System(GPS). You will learn more about this system in theConnect to Today feature on page 24.What were some of the results as maps improved?Lesson Summary Maps and globes have different advantages astools used to measure and describe Earth. Political, physical, and thematic maps show usdifferent things about the world and our place in it. Over time, maps have become more accurate. Ptolemy Ptolemy’sGeography remained oneof the most importantgeographical works until1496, when explorersbegan to prove some of hisstatements wrong.Why It Matters Now . . .We still use maps to find our way around and to learn moreabout familiar and unfamiliar places.2Homework HelperClassZone.comTerms & Names1. Explain the importance oflongitudehemispherelatitudepolitical mapphysical mapthematic mapUsing Your NotesComparing and Contrasting Use your completedVenn diagram to answer the following question:2. How are maps and globes similar?MapsonlyBothGlobesonlyMain Ideas3. Would you use a map or a globe to see acontinent’s exact shape? Explain why.4. Describe the three types of maps.5. Why were European maps in the Middle Ages soinaccurate?Critical Thinking6. Drawing Conclusions Why did Europeanmapmakers in the Middle Ages sometimes leaveempty spots on their maps?7. Making Inferences What impact do you thinkimproved mapmaking had on explorers?Making a Map Create a thematic map of your neighborhood or school, showing, for example,populations, buildings, or numbers of people who own pets. Be sure to include a legend to explainany colors or symbols on your map.The Tools of History 23
Research LinksClassZone.comExtend Lesson 2Navigation and the GlobalPositioning SystemPurpose: To learn about Global Positioning System, whichis used to determine locations on EarthThroughout history, people have tried to figure out where they wereand how they could find their way to another place. The earliestexplorers and sailors navigated by the stars. However, this methodwasn’t much use on a cloudy night. Today, navigators still lookto the sky to find their location. But now they are guided by theorbiting satellites of the Global Positioning System, or GPS. Thesesatellites can pinpoint any spot on Earth in any weather.PastThe Sextant For several hundred years,sailors used sextants, like the one shown below,to navigate. A sextant is a device that measuresthe angle between two objects. A navigatorused the mirrors on a sextant to sight thehorizon and the sun or a star. The angle betweenthe two appeared on the sextant’s scale. Thenavigator in the illustration at the right is usinga sextant.24 Chapter 1
PresentGPS Satellites Twenty-four GPS satellites, such as the oneshown here, orbit Earth. Receivers detect their signals anddetermine location within about 30 feet. GPS was originallydeveloped for the military, but the system can also be usedto create maps, track threatened wildlife, and help firetrucks and ambulances respond to an emergency.Tracking Vehicles Monitoring the locations ofcars is one of the fastest-growing GPS applications.Drivers can also use GPS map displays to plan trips.Tracking Children Receivers mounted onwatches help parents keep track of wanderingchildren. The system finds a child
Continents of the World The Tools of History 9. Shifting Plates Scientists believe that the continents lie on large moving plates. Plate movements form mountains and volcanoes and cause earthquakes. The movements slowly but continually res