Transcription
1Coronavirus Contact Tracing: Evaluating ThePotential Of Using Bluetooth Received SignalStrength For Proximity DetectionDouglas J. Leith, Stephen FarrellSchool of Computer Science & Statistics,Trinity College Dublin, Ireland6th May 2020Abstract—We report on measurements of Bluetooth Low Energy(LE) received signal strength taken on mobile handsets in avariety of common, real-world settings. We note that a keydifficulty is obtaining the ground truth as to when people are inclose proximity to one another. Knowledge of this ground truthis important for accurately evaluating the accuracy with whichcontact events are detected by Bluetooth LE. We approach thisby adopting a scenario-based approach. In summary, we find thatthe Bluetooth LE received signal strength can vary substantiallydepending on the relative orientation of handsets, on absorptionby the human body, reflection/absorption of radio signals inbuildings and trains. Indeed we observe that the received signalstrength need not decrease with increasing distance. This suggeststhat the development of accurate methods for proximity detectionbased on Bluetooth LE received signal strength is likely to bechallenging. Our measurements also suggest that combining useof Bluetooth LE contact tracing apps with adoption of newsocial protocols may yield benefits but this requires furtherinvestigation. For example, placing phones on the table duringmeetings is likely to simplify proximity detection using receivedsignal strength. Similarly, carrying handbags with phones placedclose to the outside surface. In locations where the complexityof signal propagation makes proximity detection using receivedsignal strength problematic entry/exit from the location mightinstead be logged in an app by e.g. scanning a time-varying QRcode or the like.I. I NTRODUCTIONThere is currently a great deal of interest in the use of mobileapps to facilitate Covid-19 contact tracing. This is motivatedby the hope that more efficient and scalable contact tracingmight allow the lockdown measures currently in place in manycountries to be relaxed more quickly [1].In this report we take a first step in evaluating the potential for using Bluetooth Low Energy (LE) received signalstrength to detect periods of close contact between people. Wepresent measurements taken on mobile handsets in a varietyof common, real-world settings. We also measure the effecton received signal strength caused by the human body, bydifferent types of indoor wall, the relative orientation of mobilehandsets and so on.The basic idea of a contact tracing app is that if two peoplecarrying mobile handsets installed with the app spend significant time in close proximity to one another (e.g. spending 15minutes within 2 metres1 ) then the apps on their handsets willboth record this contact event. If, subsequently, one of thesepeople is diagnosed with Covid-19 then the contact eventslogged on that person’s handset in the recent past, e.g. overthe last two weeks, are used to identify people who have beenin close contact with the infected person. These people mightthen be made aware of the contact and advised to self-isolateor take other appropriate precautions. For this approach to beeffective it is, of course, necessary that the app can accuratelydetect contact events.Almost all modern handsets are equipped with Bluetooth LEwireless technology and there is currently much interest inusing this as the means for detecting contact events. TheSingapore TraceTogether contact tracing app [2], [3], [4] isperhaps the first widely used app that uses Bluetooth LE fordetecting contact events. More recently, Apple and Googlehave formed a partnership to develop contact event detectionbased on Bluetooth LE [5].TraceTogether uses the Bluetooth LE received signal strengthto estimate proximity, and likely the Apple/Google API willdo the same. In general, a radio signal tends to get weaker asit gets further from the transmitter since the transmit poweris spread over a greater area. Bluetooth LE devices can beconfigured to transmit beacons at regular intervals and theidea is that the signal strength with which a beacon is receivedprovides a rough measure of the distance between transmitterand receiver. Namely, when the received signal strength issufficiently high then this may indicate a contact event and,conversely, when the received signal strength is sufficientlylow then this may indicate that the handsets are not in closeproximity.However, the propagation of radio signals in practice isoften complex, especially in indoor environments where walls,floors, ceiling, furniture etc can absorb/reflect radio waves andso change the received signal strength. A person’s body alsoabsorbs Bluetooth LE radio signals so that the received signal1 Ideally, what counts as a contact event should be informed by theconditions under which the virus is actually spread e.g. perhaps there isless risk of infection when people are 1m apart but facing away rather thantowards each other, or perhaps contact with surfaces is more important thantransmission through the air. However data to inform more refined definitionsof a contact event currently seems to be lacking.
2strength can be substantially reduced if their body lies on thepath between the transmitter and receiver.radio signals and so leakage of these signals between adjacenthouses/buildings is likely to be small.With this in mind, we report here on measurements of Bluetooth LE received signal strength taken on mobile handsetsin a variety of common, real-world settings. A key difficultyin evaluating proximity detection accuracy in real-world settings is establishing ground truth i.e. recording when contactevents actually happened. This ground truth is needed so thatthe contact events flagged by a contact tracing app can becompared against the actual contact events and so allow theaccuracy of the app at detecting contact events to be assessed.To address this we generally adopt a scenario-based approach.For example, we take measurements as two people walk acircuit in city streets side by side while maintaining a 1metre distance between them. This has the great advantagethat (i) ground truth is clear (to within experimental error,e.g. people will not be able to maintain an exactly 1 metredistance while walking) and (ii) data is collected in real-worldsettings with all their associated complexity. The disadvantageof course is that this limits our study to fairly simple, wellstructured scenarios. However, by selecting scenarios that aimto capture some of the key elements in common activities wecan still gain useful insight into the real-world performance ofBluetooth LE received signal strength for proximity detection.While we consider a much wider range of real-world scenariosand our focus is on contact tracing, our observations areconsistent with previous measurement studies on the use ofBluetooth for proximity detection for other purposes. Forexample, [6], [7], [8], [9] in the context of measuring socialinteraction and [10], [11], [12] in the context of indoorlocalisation. These previous studies have generally foundsimple thresholding of received signal strength to be highlyerror prone and therefore found it necessary to use machinelearning methods trained on data collected from the particularenvironment of interest in order to obtain accuate proximitydetection. These methods depend upon the availability ofground truth data, and the ability of the developed methods togeneralise beyond the specific setting considered is not clear.We present measurements for four real-world scenarios: peoplewalking outdoors in city streets, people sitting around ameeting table, people sitting in a train carriage and peoplegrocery shopping in a supermarket. In addition we presentsupporting measurements evaluating the impact of the relativeorientation of handsets on received signal strength, and on thesignal attenuation caused by the human body, by a woman’shandbag and by different types of indoor wall.In summary, we find that (i) the Bluetooth LE receivedsignal strength can vary substantially depending on the relativeorientation of handsets and on absorption by the human body.This means that, for example, the received signal strength isconsiderably higher when people are walking side by sidecompared to when they walk one behind the other at the samedistance. Similarly, we find that when people are sitting arounda meeting table with their phones in their trouser pocketsthe received signal strength is low even when the people aresitting less than 1m apart. When they place their phones onthe table the received signal strength is much increased. Wealso find that (ii) within complex indoor environments thereceived signal strength need not decrease with distance andindeed may increase with distance (recall that we generallyexpect signal strength to decrease with increasing distance,not to increase). For example, for two people walking arounda large supermarket we find that the received signal strengthis much the same when they walk close together and whenthey walk 2m apart. We observe increases in signal strengthwith increasing distance within a domestic house and withina train carriage. On a more positive note we find that (iii)outdoors the received signal strength indeed tends to decreasewith increasing distance thus facilitating proximity detection,also that blockwork walls strongly attenuate Bluetooth LEThis suggests that the development of accurate methods forproximity detection based on Bluetooth LE received signalstrength is likely to be challenging. Apps based on BluetoothLE are therefore probably not a panacea but rather are bestviewed as a potentially useful addition to existing contacttracing methods. Our measurements also suggest that combining use of Bluetooth LE contact tracing apps with adoptionof new social protocols2 may yield benefits although thisrequires further investigation. For example, placing phoneson the table during meetings is likely to simplify proximitydetection using received signal strength. Similarly, carryinghandbags with phones placed close to the outside surface. Inlocations where the complexity of signal propagation makesproximity detection using received signal strength problematic,one might consider logging entry to/exit from the area in anapp. This would allow the Bluetooth data collected in that areato be flagged as being less reliable, hopefully reducing therate of contact tracing errors. Logging of entry/edit might, forexample, be achieved by scanning a time-varying QR code,tapping a handset on a near-field tag (similar to contactlesspayment) or by placing a dedicated Bluetooth beaconingdevice at the entry/exit point whose beacons can be logged3 .II. B RIEF OVERVIEW OF B LUETOOTH LEBluetooth Low Energy (LE) was standardised in 2010. Thelow energy moniker refers to the reduced drain on the devicebattery compared to the older Bluetooth Classic technology.The first mobile handsets using Bluetooth LE appeared in2011-12 (e.g. the iPhone 4S) and today almost all modernhandsets come equipped with it.2 Such social protocols should, however, not be used to effectively make itmandatory for people to carry a handset with a contact tracing app installed,e.g. employers should generally not make this mandatory for all employees.3 Such entry/exit logging is compatible with existing decentralised contacttracing architectures. Namely, a record of the codes associated with theseentry/exit events plus the times when they occurred could be stored locallyon a user’s handset. Upon a person being discovered to be infected theirrecorded codes could be uploaded and other people can check these againsttheir own locally stored record. The codes used should be changed fairlyfrequently to avoid linking of codes with locations. Entry/exit logging may,however, require modification of app APIs
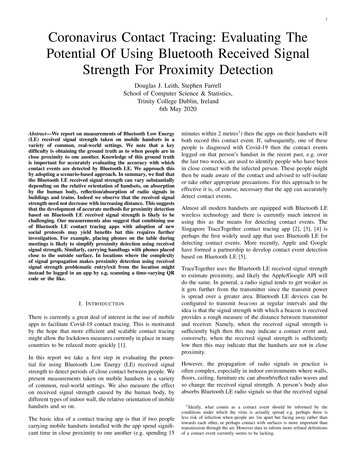
3Bluetooth LE operates in the same 2.4GHz unlicensed radioband as WiFi and other devices (including microwave ovens).Bluetooth LE devices advertise their presence by periodically(typically once per second) broadcasting short beacon messages. To mitigate the effects of interference from other usersof the 2.4GHz band each beacon is broadcast simultaneouslyon three widely spaced radio channels.Each beacon essentially consists of a short fixed preamble,followed by a small beacon payload. The payload contains anidentifier of the device making the boadcast (in modern devicesthis identifier is usually randomised and changes frequently toimprove privacy) plus a short message (generally up to 31bytes long). This message is typically used to indicate thatthe beacon is associated with a particular app or service, e.g.to associate it with a contact tracing app.A device equipped with a Bluetooth LE receiver scans thethree beacon radio channels listening for beacon transmissions.When the start of a transmission is detected the receiver usesthe fact that the beacon preamble is fixed and known to finetune the radio receiver to the incoming signal. As part ofthis fine tuning process a received signal strength indicator(RSSI) is output, which is an estimate of the radio power in thereceived signal. It is worth noting that this RSSI measurementis intrinsically noisy, with fluctuations of 5dB or greatercommon even in situations with simple line-of-sight radiotransmission, e.g. see [10] and Figure 1 below. If the receivedsignal strength is too weak either the transmission is simply notnoticed or this fine-tuning process fails. Typically this occurswhen the received signal strength is below around -90dB (thenoise floor of the receiver). Upon successful fine-tuning of thereceiver the payload of the beacon is decoded and passed upto the operating system and then on to relevant apps.The received signal strength is affected by the transmit powerused by the device broadcasting the beacon. Bluetooth LEdevices generally use a relatively low transmit power (to saveon battery drain) and a rough guideline is that beacons cannotbe decoded at distances beyond about 10 metres from thetransmitter. In practice the received signal strength is, however,also greatly affected by the way in which the radio signalpropagates from transmitter to receiver. In general the radiosignal gets weaker as it travels further since the transmitpower is spread over a greater area. However, many complexeffects can be superimposed upon this basic behaviour. Inparticular, obstacles lying on the path between the transmitterand receiver (furniture, walls etc) can absorb and/or reflect theradio signal and cause it to be received with higher or lowersignal strength. A person’s body also absorbs radio signalsin the 2.4 GHz band and so the received signal strength canbe substantially reduced if their body lies on the path betweenthe transmitter and receiver. In indoor enviroment walls, floorsand ceilings can reflect radio signals even when they are noton the direct path between transmitter and receiver, and soincrease or decrease the received signal strength.Metal, in particular, strongly reflects radio waves and this canbe an important factor in radio propagation in environmentswith a lot of metal. In buses and trains the walls, floor andceiling are mainly metal and the seats often contain metalparts. In supermarkets not only are the shelving, fridges andfreezers typically made of metal but also tinned groceriesetc located on the shelving. We can therefore expect thatradio propagation in these environments will be complex, andin particular due to reflections the signal strength may notdecrease as quickly with distance as in other environmentse.g. see [13], [14].III. BASELINE M EASUREMENTSA. Hardware & Software UsedIn our tests we used two pairs of mobile handsets: a pairof Google Pixel 2’s and a pair of Samsung Galaxy A10’s,both running Android 9. Since we only acquired the GalaxyA10’s after our measurement study had already started most ofour measurements were made using the Pixel 2’s, and unlessotherwise stated the measurements that we report below arePixel 2 data.We used the OpenTrace app [3] to collect measurements. Thisis an open source version of the TraceTogether [4] contact tracing app used in Singapore. We slightly modified OpenTrace to(i) dump the measured receive signal strength values to disk incsv format and (ii) to scan/advertise Bluetooth beacons morefrequently (allowing us to collect data more quickly, albeit atthe cost of an increased drain on the handset battery which iswhy these settings would not be used in a production contacttracing app). Note that in our initial experiments we used thedefault scan/advertise settings of OpenTrace, which yields areceives signal strength measurement roughly every 10s. Thechange (ii) above increases the sample rate to a measurementroughly every second. We verified that this caused no otherchange to the collected received signal strength values.B. Signal Attenuation With DistanceTo provide a baseline we collected measurements of receivedsignal strength vs distance. We placed two handsets at thesame height and collected measurements of received signalstrength as we varied the spacing between them. At eachdistance the handsets are held in a fixed position for at least 10minutes while the measurements are taken, giving around 80signal strength observations (one for each advertised beacondetected) at each distance. The handsets are placed flat withthe screen facing upwards (as we will see later the relativeorientation of the handsets can affect the received signalstrength).The solid line in Figure 1(a) shows the measured receivedsignal strength vs distance for our pair of Google Pixel2 handsets placed in an open space outdoors (the locationis shown in Figure 1(b)). It can be seen that the receivedsignal strength decreases steadily with increasing distance, asexpected. Also shown are error bars indicating one standarddeviation of the measured signal strength at each distance.It can be seen that the standard deviation is around 5dB,consistent with previous observations in the literature, e.g.see [10].
4-50Google Pixel 2Samsung Galaxy A10-60RLRSSI (dB)R-70LLLRR-80-90-10001234distance (m)(b) Garden location(a) RSSI vs distanceFig. 1: (a) Measured received signal strength (RSSI) vs distance. Pixel 2 measurements were collected at the outdoorlocation shown in (b), the Galaxy A10 measurements werecollected in a different but similar outdoor location.(b) SetupFig. 3: Measured received signal strength as a person rotatesand changes their orientation relative to a handset held fixedat 1m distance.space. We have also observed similar effects outdoors. Suchbehaviour has obvious implications for the use of receivedsignal strength to measure proximity, and confirms that cautionis needed when interpreting received signal strength.-55-60RSSI (dB)(a) Received signal strength-65-70-75C. Signal Attenuation By Human Body-80-850123distance (m)4(b) Indoor location(a) RSSI vs distanceFig. 2: (a) Measured received signal strength vs distance.Measurements collected in a domestic indoor space shown in(b). Note the narrowing of the space at the top of the photo.Since the received signal strength depends on the transmitpower and antenna gain of the transmitter and also on the antenna gain at the receiver it can be expected that the measuredreceived signal strength may vary with the handset model. Thedashed line in Figure 1(a) shows received signal strength vsdistance for a pair of Samsung Galaxy A10 handsets. Observethat the received signal strength is lower than with the Pixel 2’s(presumably their transmit power and/or antenna gain differs)and also the standard deviation is somewhat higher at around10dB. We also collected measurements for a Huawei P10 andthe RSSI vs distance curve (not shown in the figure to avoidclutter) is almost the same as that for the Pixel 2 but againwith somewhat higher standard deviation.It is also important to note that due to reflections fromwalls, furniture etc wireless signal propagation indoors isusually more complex than it is outdoors. Figure 2(a) showsmeasurements of received signal strength vs distance taken in arelatively open domestic indoor space (shown in Figure 2(b)).Observe the increase in received signal strength in Figure2(a) as the distance increases from 2 to 2.5m. This effect isconsistent and reproducible using multiple devices, it is nota measurement error. We believe that it is associated withthe narrowing of the indoor space that can be seen towardsthe top of Figure 2(b), with the walls (formed from concreteblockwork covered in plaster) acting to focus the wirelesssignal and so increase the received signal strength as thehandset is moved from the open room into this narrowerWe also expect that attenuation of Bluetooth LE wirelesssignals by the human body (Bluetooth LE transmits at 2.4GHz,a frequency which is absorbed by water molecules hence whyit is also used in microwave ovens) may affect received signalstrength, and that the relative orientation of handsets maymatter. Figure 3(a) shows measurements of received signalstrength as a person rotates around a fixed point 1m awayfrom a mobile handset places flat on a wooden table. Theperson carries a second handset in their left trouser pocket.Figure 3(b) shows the experimental setup schematically.It can be seen from Figure 3(a) that the received signal strengthvaries by around 20dB as the person rotates. The receivedsignal strength is slightly higher (around -75dB) when theperson’s left side is oriented towards the fixed handset thanwhen their left-side is oriented away from the handset (around-80 dB), as might be expected since in the latter case theperson’s body lies between the phone in their left pocket andthe fixed handset. Observe also that the received signal strengthis substantially higher (around -60dB) when the person isfacing the fixed handset than when they have their back toit (around -80dB), again presumably due to signal absorptionby the person’s body (the pocket is located towards the frontof their trousers).In Figure 3(a) both the signal path between the two handsetsand their relative orientations change. To separate out theseeffects we also took measurements with two handsets heldin fixed positions at a 1m distance and roughly waist height(1m above the ground). Figure 4 shows the measured receivedsignal strength as a person takes up various positions close toone of the handsets. Perhaps unsurprisingly, it can be seen thatwhen the person stands close in front of the handset (roughlymimicking a handset being in a rear trouser pocket) thereceived signal strength is around 15dB lower than when theperson stands closely behind the handset (roughly mimickinga handset being in a front trouser pocket).
5D. Signal Attenuation By Woman’s Handbag(b) SetupFig. 5: Measured received signal strength between a phoneplaced within a cloth handbag and a second phone at a 1mdistance. The phone is located at the left-hand side of thehandbag and measurements are collected with (i) the sideof the bag containing the phone oriented towards the secondphone, (ii) the side of the bag containing the phone orientedaway the other phone (i.e. with a 180 rotation of the bag fromthe initial position (i)) and (iii) with the handbag edge on tothe second phone (i.e. a 90 rotation from the initial position(i)).-60-60-65-65-70-70RSSI (dB)We also took measurements with a person holding a phone in afixed position and orientation at chest height at a 1m distancefrom a fixed handset. The received signal strength with theperson facing the fixed handset, so with an unobstructed pathbetween the two handsets, was observed to be around 10dBhigher than when the person faced away from the fixed handsetso that their torso lay on the signal path.(a) Received signal strengthRSSI (dB)Fig. 4: Measured received signal strength between two handsets spaced 1m apart as a person changes position relative tothe handsets (the positions of the handsets remains fixed). Inthe left-hand section of the plot nobody is near the handsets,in the centre-left section a person stands closely behind oneof the handsets (mimicking a handset being in a front trouserpocket), in the centre-right section they stand closely in frontof the handset (mimicking a handset being in a rear trouserpocket) and in the right section they stand beside the handset.-75-80-85-90-75-80-85-90Figure 5(a) plots received signal strength measurements for asimilar setup to the previous section but now with one handsetplaced inside a handbag rather than in a trouser pocket. Thehandbag contains other items (purse, cosmetics, hairbrush etc)and the phone is located within a pocket inside the left sideof the bag. A second phone is placed 1m from the handbagand the measurements are taken as the handbag is rotated, seeFigure 5(b) for a schematic of the setup.Fig. 6: Impact of two types of wall on measured receivedsignal strength. Handsets are placed approximately 1m apartwith wall in between, (a) measurements for a wooden studwall surfaced with plasterboard and (b) shows measurementsfor a blockwork wall approximately 15cm thick.In section (i) of Figure 5(a) the handbag is orientated so thatleft-hand side is facing the second phone and a signal strengthof around -68dB is observed. The handbag is then rotated 180so that the right-hand side of the bag now faces the secondphone, section (ii) of the plot. It can be seen that the signalstrength falls by about 10dB to around -75dB. The handbag isnow rotated by 90 so that it is end on to the second phone,section (iii) of the plot, and this change increases the signalstrength to around -65dB.therefore suggest there is little danger of Bluetooth signalstrength data triggering a false alarm regarding proximitybetween people located in adjacent houses/apartments. Studwalls, however, are widely used internally within buildingsand our measurements indicate that they have little effecton Bluetooth received signal strength. Hence, false alarmsregarding proximity between people located in adjacent roomswithin the same building may be a concern.E. Signal Attenuation By Walls In A BuildingFigure 6 illustrates the impact of walls on signal propagation. Measurements are shown for a plasterboard stud walland for a 15cm thick blockwork wall in a 1930s Dublinhouse. Comparing Figure 6(a) with the 1m point in Figure1(a) it can be seen that the stud wall creates little signalattenuation. In contrast, it can be seen from Figure 6(a) thatthe blockwork wall attenuates the signal by around 20dB.Blockwork is commonly used for the party walls separatingsemi-detached houses and apartments. These measurements01002003000100time (s)(a) Stud partition200300time (s)(b) Blockwork wallIV. S CENARIO -BASED M EASUREMENTSA. Scenario 1: Walking In City StreetsOur first scenario seeks to evaluate proximity measurementbetween people walking in city streets. The observations fromthis scenario are probably also applicable to people walkingin parks and large indoor spaces such as shopping centres andairports.We collected measurements of Bluetooth LE received signalstrength for two people walking the same 1.5km circuit along
Unfortunately the situation becomes more complex when otherconfigurations are considered. Figure 7(b) shows measurements taken when walking side by side while maintaining a 1mgap and Figure 7(c) when walking one behind the other with a1m gap. In the first case the received signal strength is around-75db 10dB but in the second case it is much lower at around-92dB 10dB i.e. similar to the signal strength measured whenone behind the other and 2m apart. This indicates that this datacannot readily be used to distinguish between whether peopleare 1m or 2m apart when they are walking behind each other.That is, this data suggests that we cannot reliably distinguishwhether people are located less than 2m of each other whenwalking behind each other in a city street, although we maybe able to distinguish this when people are walking side byside.Further investigation suggests that the substantial difference inmeasured received signal strength at a distance of 1m seen inFigures 7(b) and 7(c) is likely due to the changes in the relativeorientations of the handsets when walking side by side compared to when walking one behind the other. To help gain moreinsight into this effect Figure 8 shows measurements takenwith two handsets placed 1m apart in fixed positions within anopen indoor area. The relative orientations of the handsets areadjusted and the measured received signal strength recorded.It can be seen that when one handset is edge on to the screenof the other (so the two handsets are at a 90 angle to oneanother) the received signal strength fluctuates around -85dB.When the handsets are adjusted to be aligned edge on to oneanother the received signal strength increases by about 10dBto around -75dB, and when the handsets are then both placedface down the received signal strength increases again by about10db to around -65dB.Roughly speaking, when two people are walking one behindthe other with handsets in their pockets then the handsets areorientated edge on, i.e. similarly to the configuration in themiddle section of Figure 8. When the people walk side by sidethe handsets are roughly orientated so that the screens face oneanother. Data for this configuration is not shown in Figure 8,but our measurements indicate that the received signal strength-60-70-70RSSI (db)-60-80-90-80-90-100200400600800-1001000200time (s)(a) Side by side60080010008001000(b) 1m to side-60-60-70-70-80-90-100400time (s)RSSI (db)Figure 7 shows time histories of the measured received signalstrength for each configuration. When the two people are walking close together, Figure 7(a), the received signal strength isaround -65dB 10dB. From Figure 7(d) it can be seen thatwhen walking with a 2m gap the received signal strengthconsistently falls to around -95dB 10dB. That is, there is aclear shift in receive
The basic idea of a contact tracing app is that if two people carrying mobile handsets installed with the app spend signifi-cant time in close proximity to one another (e.g. spending 15 minutes within 2 metres1) then the apps on their handsets will both record this conta