Transcription
75 e y e ,141 (1987) 75-88Elsevier Science Publishers B.V., Amsterdam - Printed in The NetherlandsMechanical aspects of pull-apart basins and push-up swellswith applications to the Dead Sea transformZE?EV FUXHESDepartment of Geology, Hebrew University, Jerusalem (Israel)(Received November 1985;accepted July 2,1986)AbstractReches, Z., 19 .transform.Mechanical aspects of pull-apart basins and push-up swells with applications to the Dead SeaIn: Z. Ben-AvrahamTectono&sics,(Editor),Sedimentary Basins within the Dead Sea and Other Rift Zones.141: 75-88.Pull-apart basins and push-up swells are common features at steps along strike-slip faults. The structure of thesefeatures is examined here for two types of rheology: perfect brittle and perfect ductile. The stress fields derived for thestep area predict that fault patterns, mode of deformationand vertical displacement are different for the tworheologies. These predictions are illustrated for basins and swells developed in laboratory experiments with modellingmaterials.The structure of basins and swells along the Dead Sea transform is discussed here. The pull-apart basins display anintensively faulted southern end and a gently dipping flexure at the northern end. A consistent dissi l tyappearsbetween the structures of the eastern and western boundary faults of the basins. According to the present interpretation, these dissimilarities reflect a relativeiy ductile crust in Arabia and a relatively brittle crust in Sinai-Israel.Introductionpull-apart basins and push-up swells are localzones of depression and uplift along strike-slipfaults. Their development is attributed to thegeometry of the faults: basins and swells formwhere strike-slip faults are bent, discontinuous orstepped (Fig. 1). The models of pull apart basinsand push-up swells predict fault patterns as wellas the relations between the amount of displacement and the dimensions of structures (Fig. 1).The present study examines how these predictionsdepend on the mechanical properties of the crust,and applies the results to the crust along the DeadSea transform.Trevisan (1939) was probably the first to propose that the displacement along two wrenchfaults, which are stepped with respect to eachother, generates local folding and thrusting. Heoo40-1951/87/ 03.508 1987 Blsevier Science Publishers B.V.presented his model as an explanation for theBrenta Mountains in the Lombardy Alps. In recent terminology the Brenta Mountains would beconsidered a push-up swell or a pressure ridge (forterminology see Mmet al., 1983). Quennell(1956), proposed that the Dead Sea is a void in thecrust caused by the overlapping segments of theDead Sea fault system. Quennell was probably thefirst to recognize the pull-apart basin or rhombshaped graben. The concept of pull-apart basinswas formulated later by Burchfiel and Stewart(1966) for the Death Valley, California, by Freund(1965) for the Dead Sea area, and many others(Aydin and Nur, 1982; Mann et al., 1983).Here, the predicted stress dist bution at theproximity of two faults in en-echelon pattern ispresented for two idealized rheologies, brittle andductile. Then, the pull-apart basins (PAB) andpush-up swells (PUS) that form in a series of
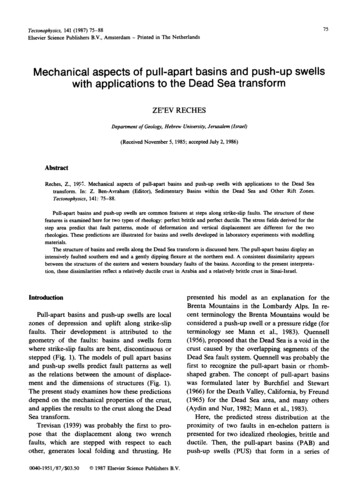
laboratory experiments with wet clay and windowputty are displayed. And finally, the structure ofsome basins and swells along the Dead Sea transform is described, and the corresponding crustalrheology is discussed.Models for pull-apart basins and push-up swellsPull-apart basins and push-up swells are zonesof subsidence and uplift, respectively, in a strikeslip region. While the shape and dimensions of thePAB or the PUS may resemble the shape anddimensions of basins and swells of other environments, their development is linked to the patternsof the master strike-slip faults and the crustalrheology. Therefore, the following account emphasizes the fault pattern and the rheology, eventhough the dominant topographic features may bethe basins and the swells.The simplest model of a pull-apart basin includes two parallel strike-slip faults that areslightly stepped with respect to each other (Fig. 1).After a relatively small slip along the faults theyare connected by at least one cross fault at thestep, dividing the region into two blocks separatedby a stepped fault zone. Additional slip along thestrike-slip faults will open a hole in the step area.Fig. 1. Idealized models of pull-apart basins, in A, B and C,and of push-up swells, D and E. Note coalescing faults in thesubsurface of A and D. Slightly modified after Garfunkel(1981).This hole is the pull-apart basin. Following Sibson(1985), dilutional jog is a right step along a rightlateral fault, or a left step along a left-lateral fault(Fig. 1A) and an anti dilational jog is a right stepalong a left lateral fault, or a left step along aright-lateral one (Fig. 1D). A dilational jog generates a pull-apart basin, whereas an anti dilationaljog generates a push-up swell (Fig. 1E).This model and its modifications (Garfunkel,1981; Aydin and Nur, 1982; Mann et al., 1983)are based, explicitly or implicitly, on the followingassumptions: (1) The volume of the crust is constant during the strike-slip displacement; this issometimes simplified to assume constant area(Figs. lA, B). (2) The deviation of the slip direction from the strike of the fault should yieldvertical displacement, with associated horizontalextension or horizontal compression. The mostconspicuous vertical displacement occurs at thestep, as this is the location of the largest deviationbetween the slip direction and the fault strike. (3)The crust behaves as a brittle-elastic material (notethe rigid blocks in Fig. 1). The third assumption isprobably a simplified one; however, it has somesignificant implications on the model predictions,as shown below.Segall and Pollard (1980) and Rodgers (1980)were the first to analyze the elastic stress field inthe vicinity of a step. They used different approaches: Segall and Pollard analyzed the interaction between the two faults, whereas Rodgerscalculated the superposition of the contributionsof the faults. Their results are generally similar:The mean stress, (a, u3), decreases inside thestep between the faults for a dilational jog (Fig.2a) and decreases outside the step of an antidilational jog (Fig. 2 ). The maximum shearstress, f(u, - u3), behaves differently. For a dilational jog the maximum shear stresses increase atfault ends with a slight larger increase outside thestep (see contours in Fig. 2b). For the anti dilational jog the maximum shear stresses increaseinside the step (Fig. 2d). These modifications ofthe stress fields at the step area should affect thestyle by which the initial faults coalesce in different rheologies.Consider the geometry of PAB and PUS thatdevelops in two idealized rheologies, brittle and
77qeCt,,*ii-.- ::. . .*.*. .I.f:::::3tt3*-1IIIIIFig. 2. The local stress field near a step between two left-lateralfaults due to slip along the faults. Upper diagram indicatesgeneral geometry; e1 and us are maximum and minimumcompressive stresses, respectively; details within the markedsquare are shown below. The marked values of shear and meanstresses are with respect to the far-field value of 1; thus valuessmaller then unit 1 indicate stress reduction and values largerthen unit 1 indicate stress increase. a. Contours of the reducedmean stress, f (at us), near a dilational jog. b. Contours ofincreased shear stresses, i (uI - us), near a dilational jog. c.Contours of reduced mean stress near anti dilational jog. d.Contours of increased shear stresses near anti dilational jog.(After Segall and Pollard, 1980.)Fig. 3. Predicted structures at dilational and anti dilationaljogs. a. Yield envelope of an idealized brittle material (Mohrdiagram). b. Yield envelope of an idealized ductile material(Mohr diagram). c. and e. Predicted structure of a dilationaljog (pull-apart) and an anti dilational jog (push-up), respectively, in a brittle material. d. and f. Predicted structure of adilational jog (pull-apart) and an anti dilational jog (push-up),respectively, in a ductile material (see text). I strike slipfault; 2 reverse-strike-slip fault; 3 normal-strike-slip fault;4 fold axis; 5 subsidence area; 6 uplifted area.ergy release. The brittle material has low strengthin tension, and thus, the reductionof the meanductile. Brittle rheology here means a materialthat tends to yield by extensionfracturing;amaterial in which the yielding strength dependsprimarilyon the magnitudeof the mean stress;and a material that usually develops discreet, narrow faults. Frequentlya brittle material is associated with frictionalstrength according to “Byerlee’s law” (Fig. 3a). Ductile rheology here means amaterial that tends to shear and flow and in whichthe yielding strength is independentof the meanstress (Fig. 3b). Shear faults form in this ductilestress increases its tendency to yield (Fig. 3a). Onthe other hand, the ductile materialmaintainsequal strength under tension or compression,and,thus, only an increase of the shear stresses increases its tendency to shear (Fig. 3b).This differencein yielding behaviorbetweenthe two rheologies produces a difference in thestyle of faulting in the step area. Faults in thebrittle material should propagate into the regionsof lower mean stresses. Thus, the initial faultsshould propagatetoward one another in a dilational jog (Fig. 3c), whereas in an anti dilationalmaterial; however, the slip along these faultscurs by creep without stress drop and elasticjog the initial faults should propagateaway fromone another (Fig. 3e) (Segall and Pollard, 1980).ocen-
78These predictions are supported by field evidence(Segall and Pollard, 1980) as well as laboratoryresults (Horii and Nemat-Nasser, 1985).Faults in the ductile material should propagateinto the regions of high maximum shear stresses.Thus, in a lation jog the initial faults propagate away from each other (Fig. 3d) and in theanti dilational jog the faults propagate toward oneanother (Fig. 3f). Furthermore, the propagatingsections of the faults are different for the twotypes of rheologies. In the brittle material, thepropagating portions of the initial faults are mixednormal and strike-slip faults (Figs. 3c, e), whereasin the ductile material they are mixed reverse andstrike-slip faults (Figs. 3d, f).The zone between two faults arranged in adilational jog is subjected to extension; the modeof yielding to this extension depends on the localcrustal rheology. If one considers a brittle crustthe two master strike slip faults would link by twoextensional branches and a basin bounded byfaults would develop (Figs. 1, 3 ). This modepredicts that the length of the basin is equal to orlarger than the amount of displacement along themaster strike-slip faults (Fig. 1). The length of thebasins can then be used to determine the minimum amount of slip G fu el,1981), or todistinguish between basins of different ages(Garfunkel et al., 1981).However, if one considers a ductile crust, thedisplacement along the master faults may beaccommodated by other mechanisms. For example, accommodation by continuous extension inside the basin (Fig. 3d) as well as by continuouscompression of the crust outside the basin. There-fore, the length and width of a basin in a ductilecrust cannot be easily predicted as summarized inFig. 3 and Table 1.The development of pull-apart basins and push-upswells in experimentsThe nucleation and growth of PAB and PUS insamples of wet clay and window putty are presented here. The structures initiated and grew as aresult of interaction between faults that were eitherprecut into the samples or that formed spontaneously during the experiments. The samples wereup to 57 mm thick and up to 210 x 210 mm inarea. They were loaded laterally in a constantstrain rate. No “basement” with precut faults orstepped faults was used; thus, the observed basinsand swells reflect the response of the samplematerial to the applied deformation. Details of theapparatus and the experimental conditions appearin Reches (1987). Figures 4-7 show portions ofthe surface of samples deformed under equal areaconditions, by loading parallel to the picture plane.In all figures maximum compression is in a N-Sdirection.Figure 4 displays a sample of window puttybefore and after deformation. Two pairs of faults,with a right step and with a left step, were cut intothe sample prior to deformation. All four faultsare left lateral with some extension perpendicularto them. A zone of intense minor faulting indicates the direction of propagation at the termination of the large fault. Figure 4A shows that theleft fault of the left step pair (marked a) bendsaway from its counterpart; the right fault in thisTABLE 1Relationship between crustal rheology and the structure of pull-apart basins and push-up swellsPropertyFault bending(1) pull-apart basins(2) push-up swellsType of faultingLength/slip relationsExtension parallel topull-apart basinsStyle of deformationBrittle rheologyDuctile rheologyToward each otherAway from each otherOblique-normal and strike-slip faultsLength of basin is equal to or larger than total slipAway from each otherToward each otherOblique-reverse and strike-slip faultsLength of basin has no simple relation to slipExtension equal to total slipFaultingExtension is smaller than total slipContinuous deformation and faulting
79Fig. 4. Propagation of left-lateral faults in window putty. Maximum compression in N-S direction. A. Initial, precut faults. B. After21% shortening; note the faults propagate toward each other at the left step and away from each other at the right step (see text).pair bends only slightly. The left fault of the rightstep pair (marked b, Fig. 4B), bends toward itscounterpart; the right fault in this pair did notbend. The zones inside the steps underwent extension in the left stepped pair and compression inthe right stepped pair (Fig. 4B). The observedbending directions of faults a and b as well as thecontinuous deformation of the step zones, fit thepredictions for a ductile material (Fig. 3d, f).The development of a push-up swell in a wetfTt*-lcmclay sample is shown in Fig. 5. Two large leftlateral faults with a left step, were precut into thesample (marked a and b, Fig. 5A). This configuration should have generated a PAB between aand b; however, these faults did not interact witheach other, presumably due to the large spacingbetween them. Instead, fault a interacted with anew fault, c, which formed spontaneously at thesouthwest corner of the picture (Figs. 5B, C). Thetwo interacting faults are connected by NE-SW2cm1Fig. 5. Push-up swell development between left-lateral faults in wet clay. Maximum compression in N-S direction. Note initiation ofPUS in B and lack of interaction between the two faults on the right side. Note in C the mixed reverse-strike-slip faults that boundthe swell.
80trending faults, which are oblique, strike-slip-reverse faults, and they enclose an uplifted area. Thefeatures that develop between faults a and c arein agreement with the predictions for an antidilational jog in a ductile material (Fig. 3f).According to the predictions in the sectionabove, a shear fault in a brittle material shouldpropagate into the region of the most reducedmean stress. Figure 6 tests this prediction for asingle crack subjected to left lateral slip, precutinto a hardened mixture of sand and gypsumpowder (2.5%). Here, as in many other experi-Fig. 6. PropagationMaximumof an open crackcompressionin N-Ssubjecteddirection.to left lateralments with brittle materials, the sample yieldedunstably, and the fault extended as predicted(Horn and Nemat-Nasser, 1985).The spontaneous development of pull-apartbasins is rare in the present series of experiments.Figure 7 shows one case of a spontaneous PABformed in a wet clay sample. The basin appearsinitially as an unfaulted topographic depressionbetween two right-lateral faults (Fig. 7A). Thedepression is cut later by an extension fracture atits center (Fig. 7B). Afterwards, the PAB grows bytwo simultaneous mechanisms: the continuousshear, in a brittleslab (sand cementedby 2.5% of gypsumEntire crack in center figure and details of both ends are in side figures.powder).
81Examination of basins and swells along the deadsea transformsubsidence of the depression and the opening ofthe extension fracture (Figs. 7C, D). As the deformation increases, the PAB lengthens, maintains itswidth and rotates together with its boundary faults(Figs. 7B, C, D). The PAB of Fig. 7 shows themodes of the two rheologies: continuous extension(ductile) and extension fracturing (brittle).The experiments described above present somestructures associated with PAB and PUS withtheir mechanical interpretation. These experimentsare not models of field cases; rather, they areillustrations for the analysis proposed here.0The models of PAB and PUS which were presented above, provide a method of estimating therheology of the crust in transform regions. Thismethod is applied here to some of the betterdocumented basins and swells along the Dead Seatransform.The Dead Sea fault system is a leaky transformfault extending from the Red Sea to the TaurusMountains between the Arabian plate and theSinai-Africansubplate (Fig. 8) (Freund andGarfunkel, 1976; Garfunkel, 1981; Garfunkel etlcmPcmFig. 7. Development of a pull-apart basin between right-lateral faults in wet clay. Note: in A, subsided area precedes the PAB; in B,connecting fault forms in lowest part of the subsidence; in C and D growth of the basin (see text).
82al., 1981). The Dead Sea transform is discontinuous and includes more than ten PAB’s and a fewPUS’s at its steps. The structural discussion belowis based on the following characteristics: (a) Leftlateral displacement of about 105 km has occurredalong the Dead Sea transform since the MiddleMiocene (Freund and Garfunkel, 1976). (b) Thestress field that exists along the transform can berepresented by stresses determined from smallMediterranean0Fig. 8. Generalfaultsare markedmumcompression,view of the Deadand lines markeddirectionsof the maximumaccordingto small1983); small framesFigs. 9-13.Sea transform.in heavy lines; small arrowsscalealongO, andand minimumstructures(afterthe transformStrike-slipindicatemaxi-O, s,locationsofscale structures by Eyal and Reches (1983) (Fig.8). (c) The deformation along the Dead Sea transform is the result of dominant horizontal displacement parallel to the transform and minor extension normal to it.The Bir Zreir graben in eastern Sinai is probably the best documented PAB anywhere (detailsin Eyal et al., 1985). The well exposed crystallinebasement is crossed by several Miocene dikes, andthus, the fault traces and their displacements areaccurately mapped (Fig. 9A). The Bir Zreir grabenis bounded by fault systems on the west and theeast. Both systems are longer than the graben andpart of the displacement along them is not relatedto the formation of the graben. By omitting thedisplacements and the fault segments which seemunrelated to the graben, the simple map of Fig. 9Bis produced. The extension along the line AA(Fig. 9A) due to the three NW-SE trending faults(Fig. 9B) is calculated by Eyal et al. (1985) to be 1km. This value is based on the measured dip ofthe northern fault and assumed dips of 60” forthe other two faults. According to the model of aPAB in a brittle crust the extension along AA’(Fig. 9A) should be 2 km, equal to the strike-slipdisplacement along the eastern and westernboundary faults (Fig. 1). Eyal et al. (1985) rejectthe PAB model because of this mismatch betweencalculated and predicted values of extension. Theypropose that the Bir Zreir graben was formed by acombination of left-lateral slip and block rotation.According to the present study, however, theextension mismatch contradicts only a PAB modelin a brittle crust, whereas in a partly ductile crustthe apparent mismatch may be explained by thefollowing mechanisms. The maximum subsidencein the Bir Zreir graben is about 1 km (Eyal et al.,1985) and thus, the graben is not a “hole” throughthe entire crust. It is likely therefore, that thewestern and eastern boundary faults coalesce atdepth (Fig. 1A). Such coalescence reduces theamount of extension. Another mechanism to reduce extension within the graben, is shorteningoutside the graben, for example, shortening byreverse-strike slip motion along the diagonal faultthat splays northeastward from the eastern fault,north of the graben (Fig. 9A). It is proposedtherefore, that the Bir Zreir graben is a pull-apart
LEGEND-NORMAL FAULT STRIKE-SLIPWith measuydFAULT(and l ted)dts acemen-STRUCTURALCONTCXJR(base Cambrian) DATUM POINT:BASEMENT ROCKS\-A: GEOLOGrCALCROSS-SECTION03 kmFig. 9. Bir Zrier graben, eastern Sinai (location: frame a in Fig. 8). A. Structural map after Eyal et al. (1985). B. Simplified tectonicmap produced by omitting faults and displacements unrelated to the pull-apart.basin in partly ductile crust.The Elat Deep studied by Ben-Avraham et al.(1979) is the northern basin of the Gulf of Elat. Itis about 40 km long with a water depth of up to900 m (Fig. 10). Both the western and easternfaults of this basin are do nat by verticaldisplacements (Ben-Avraham et al., 1979), whereasthe southern fault appears as a strike slip fault(Ben-Avraham, 1985). The last observation doesnot fit the predictions of the PAB model of crossfaults with normal slip (Fig. 1) (Ben-Avraham,1985). Similarly to the position in Bir Zreir, faulting occurs only on the southern side of the ElatDeep and the northern boundary of this basin isnot faulted (Ben-Avraham et al., 1979); most likelyit forms a southward dipping flexure. The westernfault of the Elat Deep continues northward as theElat fault (Fig. 10) (Reehes et al., 1987). The Elatfault displays a continuous bend that forms thesouthern boundary of a new, small PAB. Thedirection of bending of the Elat fault is consistentwith the predicted direction for the brittle crust(Fig. 3 ). However, the eastern fault of the ElatDeep bends differently; it continues northeastward, away from the transform zone {Fig. 10).This new bending direction is typical north of the
O-10 kmal., 1979; G&burg and Kashai, 1981; Kashai andCracker, 1984; Arbenz, 1984). These studies indicate that the basin is bounded on the south by afew large list& faults, dipping toward the northeast, and on the north by a gentle flexure, dippingto the south (Fig. llA, B). The large faults at thesouth are associated with many smaller faults ofunclear pattern (Ginzburg and Kashai, 1981). Arbenz (1984) proposed that a large detachmentsurface extending from the listric faults under theentire Dead Sea basin (Fig. 11B). Garfunkel(l981)calculated 35 to 40 km of extension along theDead Sea basin; he attributed this extension to theyoung slip phase, of Pliocene to Recent age. NoPAB which is associated with the older phase(60-65 km slip), has been recognized at the proximity of the Dead Sea basin. Thus, Garfunkel(1981) proposed that either the older PAB’s wereobliterated during the young phase or that theplates motion during the old phase was parallel toAFig. 10. The Elat Deep and the Elat fault (location: frame b inFig. 8). Note: sense of slip along the margins of the Elat Deep,the lack of E-W faulting at the northern end of the basin, thenortheastward continuation of the eastern fault and the bendin the center of the Hat fault. After Ben-A (1985) andReches et al. (1986).BDead Sea, as described below.The Dead Sea itself is the largest and moststudied pull-apart basin in this transform system(Quennell, 1956; Freund, 1965; Neev and Hall,1979; Garfunkel et al., 1981). According to mostinterpreters since Quennell (1956), both the eastand west sides of the Dead Sea basin are delineated by large, oblique strike slip faults, as well asmany subparallel normal faults. Some details ofthe internal structure of the basin have been revealed recently by deep seismic data (Ginzburg etLONGITUDINAL SECTIONFig. 11. Schematic presentation of the structure of the DeadSea basin (location: frame c in Fig. 8). Modified after Arbenz(1984). A. Block diagram, L-list&faults at the south end; A-Arava fault; J-JordanValley fault; OJ-Aoj’a fault system. B. Cross sections. Note crustal thickness difference between east and west.
85the Dead Sea transform without extension normalto it.However, the extension within the Dead Seabasin may be only a portion of the whole deformation. As mentioned above, compression andthickening of the bounding plates outside the basin(Fig. 3d) are equivalent to extension inside thebasin. For example, the thickening of Arabia implies less northward displacement of this plate,and the reduction of the total extension requiredfor the Dead Sea basin. Indeed, recent seismicrefraction profiles in Trans-Jordanindicate acrustal thickness of about 40 km along the deadSea transform (Makris, 1985). On the western sideof the transform, from north of Elat to north ofthe Dead Sea, the crustal thickness is 30 km orless (G&burg et al., 1979; Ginzburg et al., 1981).As the thinner western crust extends more than100 km south of the Dead Sea, the greater thickness of the eastern side cannot be explained by arigid displacement of 105 km of the Arabian plate.The thickening of Arabia and the accompanyingisostatic compensation are consistent with theelevation difference between the two sides of theDead Sea transform (see Discussion).It is speculated here that the crust of theArabian plate became thicker as the result ofcontinuous ductile deformation. This suggestionagrees with the bending of the Arava fault to thenortheast, propagating into the Arabian plate (Fig.11A); this bending direction fits a ductile rheology(Fig. 3d).A new zone of normal faults, the Aog’a system,appears northwest of the Dead Sea (Fig. 11A).This zone seems to splay gradually from themarginal faults of the rift: its trend varies fromabout N-S close to the rift to about NW-SEaway from it. Similar zones occur along the westem side of the rift from the Dead Sea to theHermon.In the east the thickening of the crust and bending of the Arava fault suggest a ductile rheology;within the transform zone the listric faults in thesouth and the flexure in the north indicate mixedrheology; and in the west the normal northwest faultsystem reflects a more brittle rheology. These differences in rheology indicators from one side ofthe transform to the other become even moreconspicuous north of the Dead Sea.The three larger PAB’s in the northern JordanValley (Fig. 12)-theSea of Galilee, Hula andAyun-displaycommon structural features. Thelarge strike slip faults that bound the basins arebent toward the northeast at their northern portions (Garfunkel et al., 1981; Garfunkel, 1981;Kashai and Cracker, 1985; Hieman and Ron,1987). Many smaller NE-trending bends occuralong some of these large strike-slip faults (Hieman and Ron, 1987) (Fig. 12b). Local upliftsbounded by curved, oblique reverse faults areassociated with these small bends. Most bends inthis region are in the direction predicted for aductile crust (Fig. 3d, ‘f). The surface features andthe limited subsurface data (Kashai and Cracker,1985), do not indicate large normal faults at eitherthe northern or the southern boundaries of thethree basins. The layers at these boundaries aremost likely flexed into the basins, similarly to theflexures in the northern parts of the Bir Zreirgraben (Fig. 9), the Elat deep (Fig. 10) and theDead Sea basin (Fig. 11).A few systems of prominent normal faults,which trend from NWW-SSE to almost W-E, aredeveloped along the margins of the northernJordan Valley (Fig. 12). These faults form a seriesof large blocks, usually tilted to the southwest. Ifthese systems, as well as the Aog’a system mentioned above, are related to the left-lateral slipalong the Dead Sea transform, then they indicateextensional yielding in the zone of reduced meanstresses (see model presentation above); suchyielding fits brittle behavior of the crust. Thus, thewest side of the transform in the north seems tobehave more brittly than its east side, similarly tothe above deduction about the Dead Sea area.The Hermon and Buruk Mountains, farthernorth, form a huge push-up swell along a rightstep of the Dead Sea transform (Fig. 12). Theinternal structure of these mountains is complex.However, the main strike-slip faults display a relatively simple pattern: the Yammuneh fault, whichconnects through this step, as well as the Rachayaand Roum faults, all bend towards the northeastat their northern parts (Fig. 12). Reverse slip islikely to occur along these faults, but there is nodirect field evidence to support or reject this possibility.
nantstrike-slipfaults1). The variousbasinsand swells were demonstratedexperiments4-7).The geometryand a consistentbetween3 andofin laboratoryof a few majorSea transformstructuralbasinsandwas examined,dissimilaritytothemodelpresentedplate on the east is more ductileSinai-Israeldifference(Fig.in a seriesappearedthe west and east sides of the transform.AccordingArabiangeometrieswith wet clay and window putty (Figs.swells in the Deadbare presentedTablesubplateandthehere,thethan theon the west. The structuralcorrespondingference, are recognizablerheologydif-from the Elat deep in thesouth to the Yammunehfault in the north. Thisincludes a segment of the transformalmost 600km long (Fig. 13).It is proposed here that the apparentcontrast-ing rheology reflects a difference in the heat conditions:the Arabianplate is warmer than theSinai-Israelsubplate. The crustal heat regime andthe correspondingstrength of the lithosphere havenot been derived for the region of the Dead Seatransform;thus, only general indicationsmay beconsidered.One expression of the proposed heatcontrast is the marked difference in the abundanceof youngvolcan
features is examined here for two types of rheology: perfect brittle and perfect ductile. The stress fields derived for the step area predict that fault patterns, mode of deformation and vertical displacement are different for the two rheologies. These predictions are illustrated for basin