Transcription
PhD ThesisAnalysis of Power Distribution SystemsUsing a Multicore EnvironmentLuis Gerardo Guerra SánchezBarcelona, March 2016
Analysis of Power Distribution SystemsUsing a Multicore EnvironmentLuis Gerardo Guerra SánchezDissertation submitted to the Doctorate Officeof the Universitat Politècnica de Catalunya inpartial fulfillment of the requirements for thedegree of Doctor of Philosophy by theUNIVERSIDAD DE MALAGAUNIVERSIDAD DE SEVILLAUNIVERSIDAD DEL PAÍS VASCO/EUSKAL ERRIKO UNIBERTSITATEAUNIVERSITAT POLITÈCNICA DE CATALUNYAJoint Doctoral Programme inElectric Energy SystemsBarcelona, March 2016
Analysis of Power Distribution Systems Using a Multicore EnvironmentCopyright Luis Gerardo Guerra Sánchez, 2016Printed by the UPCBarcelona, March 2016ISBN: -Research Project: -UNIVERSITAT POLITÈCNICA DE CATALUNYAEscola de DoctoratEdifici Vertex. Pl. Eusebi Güell, 608034 BarcelonaWeb: http://www.upc.eduUNIVERSIDAD DE MALAGAEscuela de DoctoradoPabellón de Gobierno - Plaza el Ejido s/n(29013) Málaga.Web: http://www.uma.esUNIVERSIDAD DE SEVILLAEscuela Internacional de DoctoradoPabellón de México - Paseo de las Delicias, s/n41013 SevillaWeb: http://www.us.esUNIVERSIDAD DEL PAÍS VASCO/EUSKAL ERRIKO UNIBERTSITATEAEscuela de Master y DoctoradoEdificio Aulario II - Barrio Sarriena, s/n48940- Leioa (Bizkaia) Spain.Web: http://www.ehu.eus/es
AcknowledgmentsI have never been a good writer; I always related more to numbers and equations than Iever did to words, which is probably why I became an engineer. However, as I finishthis chapter of my life, I would like to take a moment to express my appreciation andgratitude towards everyone who has helped or supported me in any way during thistime.I have always seen myself as a man of faith and this faith has been one of the maindriving forces in my adult life. The comfort and solace I find in God has given me thestrength to pursue my goals and the peace of mind to overcome difficult times; His lovemakes everything possible.The completion of this Thesis has required an enormous amount of work and effortfrom my part; however none of it would have been possible without the support andguidance from Professor Juan Antonio Martínez Velasco. It has been a real pleasure andhonor to work with someone so dedicated and committed to his work. I am trulygrateful to him for giving me the opportunity to pursue this path and prove myself.I would also like to thank those whose help has directly contributed to the developmentof my work, Víctor Fuses, Gabriel Verdejo, and everybody at RDLab. Víctor’s help wasinvaluable during the early stages when we were trying to acquire our own computercluster and RDLab provided the much needed technical support to set it up. Their hardwork is one of the reasons behind this Thesis’ success.I cannot see myself being here without my family; I have been blessed with theunconditional love and support of my parents, Mauricio and Betty. They have alwaysencouraged me to be the best person I can be and to look for new horizons; words failme to express the gratitude and love I feel for them. Many people go through their liveswithout really getting to know their siblings, to them they are just strangers who live inthe same house; to me Carlos is not only my brother, he is my best friend and I amreally thankful for having him in my life. Of course I cannot forget my sister-in-lawSamantha, who soon will bless us with the greatest gift of all, my soon-to-be-bornnephew Carlos Fernando.For a long time my life revolved primarily around my work and I couldn’t help feelingthat something was missing; that emptiness was filled when a very special personentered my life, my girlfriend Canan. Her love has been a constant source of inspirationand I can only hope to be there for her as she has been there for me; the uncertainties ofthe future do not scare me if she is with me.No man’s life is complete without friends; as a kid I grew up surrounded by a smallgroup of friends and along the way I was lucky enough to be able to keep them andmeet new persons whom now I am proud to call my friends. The following names aremeant to be a small recognition to the persons I consider true friends and whose supporthas helped me get where I am now: Javier Corea, Víctor Renderos, Carlos Quintanilla,Luis Márquez, Verónica Quintanilla, Isabel Duarte, Gloria Hernández, WendyFlamenco, Víctor Romero, José Segovia, José Quintanilla, Yuri Linares, Rodrigo
Torres, Javier Portillo, Violeta Pastore, Javier Saade, René González, Walter Leiva,Laura Di Raimondo, Alejandra García, Jorge Acevedo, Alberto Canales, and ManoloLópez.Finally, as I embark myself on a new adventure, I cannot help but to feel excited aboutwhat is to come; for I know this is not the beginning of the end but the end of thebeginning.¡Gracias, totales!
“It’s a magical world,Hobbes, ol’ buddy,Let’s go exploring!”Bill Watterson
List of PublicationsJournal Publications:J.A. Martinez and G. Guerra, “A Parallel Monte Carlo method for optimum allocationof distributed generation,” IEEE Trans. on Power Systems, vol. 29, no. 6, pp. 29262933, November 2014.J.A. Martinez and G. Guerra, “A Parallel Monte Carlo approach for distributionreliability assessment”, IET Gener., Transm. Distrib., vol. 8, no. 11, pp. 1810-1819,November 2014.J.A. Martinez-Velasco and G. Guerra, “Analysis of large distribution networks withdistributed energy resources”, Ingeniare, vol. 23, no. 4, pp. 594-608, October 2015.G. Guerra and J.A. Martinez, “Optimum allocation of distributed generation in multifeeder systems using long term evaluation and assuming voltage-dependent loads,”Sustainable Energy, Grids and Networks, vol. 5, pp. 13-26, March 2016.J.A. Martinez and G. Guerra, “Reliability Assessment of Distribution Systems withDistributed Generation Using a Power Flow Simulator and a Parallel Monte CarloApproach,” Submitted for publication in Sustainable Energy, Grids and Networks.Conference Publications:J.A. Martinez and G. Guerra, “Optimum placement of distributed generation in threephase distribution systems with time varying load using a Monte Carlo approach,” IEEEPES General Meeting, San Diego, July 2012.J.A. Martinez and G. Guerra, “A Monte Carlo approach for distribution reliabilityassessment considering time varying loads and system reconfiguration,” IEEE PESGeneral Meeting, Vancouver, July 2013.G. Guerra and J.A. Martinez, “A Monte Carlo method for optimum placement ofphotovoltaic generation using a multicore computing environment,” IEEE PES GeneralMeeting, National Harbor, USA, July 2014.G. Guerra, J.A. Corea-Araujo, J.A. Martinez, and F. Gonzalez-Molina, “Generation ofbifurcation diagrams for ferroresonance characterization using parallel computing,”EEUG Conf., Grenoble (France), September 2015.
Book Chapters:J.A. Martinez-Velasco and G. Guerra, “Allocation of Distributed Generation forMaximum Reduction of Energy Losses in Distribution Systems,” Chapter 12 of EnergyManagement of Distributed Generation Systems, InTech, In editing process.
Table of Contents1.Introduction11.1.Problem Formulation11.2.Power Distribution Systems31.2.1. Power Systems General Structure31.2.2. Distribution System Structure41.2.3. Distribution System Primary Circuits61.2.4. Distribution System Secondary Circuits71.2.5. Distribution System Substations81.2.6. Distribution System Elements1.3.Distributed Generation11141.3.1. Distributed Generation Technologies141.3.2. Distributed Generation and Loss Reduction161.4.Power Distribution Reliability171.4.1. Introduction to Power Distribution Reliability171.4.2. Predictive Analysis181.4.3. Statistical Analysis201.5.Accomplishments211.6.Document Structure231.7.References242.Application of Parallel Computing to Distribution Systems Analysis2.1.Introduction27272.1.1. Serial vs. Parallel Computing282.1.2. Hardware Configuration282.1.3. Types of Parallel Jobs302.2.Multicore for MATLAB Library312.2.1. Job-Task and Input Data312.2.2. Master Function and Main Parameters322.2.3. Slave Function332.2.4. Library Execution in a Computer Cluster332.3.Simulation of Power Distribution Systems Using Parallel Computing342.3.1. Cluster Description352.3.2. MATLAB Sessions and OpenDSS36
2.3.3. Slave Function Execution362.3.4. Master Function and Settings372.3.5. Execution Overview372.3.6. Stand-Alone files382.4.Case Study402.4.1. MATLAB Code412.4.2. Simulation results442.5.Conclusions452.6.References46System Curves493.1.Introduction493.2.PV Generation Curves503.3.2.1. Built-in OpenDSS PV System Element Model503.2.2. Generation of the Yearly Curve of Solar Irradiance513.2.3. Generation of the Yearly Curve of Panel Temperature553.3.Wind Generation Curves573.3.1. Calculate Deterministic Curve of Wind Speed Values583.3.2. Generate Wind Curve’s Stochastic Component583.3.3. Sum of Deterministic and Stochastic Components583.3.4. Final Probability Density Function (PDF) Transformation593.3.5. Height Correction593.3.6. Calculation of Generated Power593.3.7. Air Density Correction603.3.8. Estimation of Curve Generation Parameters603.4.Node Load Profiles613.4.1. Synthetic Generation of Load Curves613.4.2. Generation of Load Profiles653.5.Case Study653.6.Conclusions703.7.References704.Optimum Allocation of Distributed Generation734.1.Introduction734.2.Application of the Monte Carlo Method744.2.1. Introduction744.2.2. Short Term Evaluation75
4.2.3. Optimum Allocation for Longer Evaluation Periods774.2.4. Implementation of the Procedure784.3.Optimum Allocation of Distributed Generation in Radial Feeders794.3.1. Introduction794.3.2. Test System Configuration794.3.3. 100-Node System804.3.4. 500-Node System854.3.5. 1000-Node System874.3.6. Monte Carlo Method Using Multi Core Computing904.3.7. Refinement of the Monte Carlo Method924.4.Optimum Allocation of Distributed Generation in Multi-feeder97Systems4.4.1. Introduction974.4.2. Test System984.4.3. Short Term Evaluation984.5.Optimum Allocation of Distributed Generation Using Long Term103Evaluation4.5.1. Introduction1034.5.2. Long-term evaluation1034.5.3. “Divide and Conquer” liability Assessment of Distribution Systems1175.1.Introduction1175.2.Reliability Analysis Using the Monte Carlo Method1185.2.1. Principles of the Method1185.2.2. Scenarios1195.2.3. Parameters for Reliability Analysis1225.2.4. Reliability Indices1245.2.5. Special Considerations1265.2.6. Implementation of the Procedure1285.3.Test System1295.4.An Illustrative Case Study1345.4.1. Case Study Characteristics1345.4.2. Sequence of Events1345.4.3. Simulation Results135
5.5.Reliability Analysis of the Test System1405.5.1. Simulation Results1405.5.2. Reduction of the Simulation Time1445.5.3. Assessing DG Impact on System .General asic Solution Methods and Models158A.2.1. Solution Algorithm158A.2.2. Element Models159A.3.OpenDSS as Stand-Alone Executable165A.3.1. Quick Command Reference165A.3.2. System Simulation using the Stand-Alone Executable168A.4.OpenDSS – MATLAB Link172A.4.1. COM Server DLL Interface173A.4.2. System Simulation using the COM Server DLL174A.5.References178
List of TablesTable 2.1.Task-function input variables.42Table 2.2.Simulation times comparison.45Table 3.1.Range of optimization parameter variability.61Table 3.2.Summary of solar and wind resources.66Table 4.1.Optimum allocation of two capacitor banks - 100 nodes.82Table 4.2.Optimum allocation of one capacitor bank with time varyingload - 100 nodes.83Table 4.3.Optimum allocation of one generation unit - 100 nodes.84Table 4.4.Optimum allocation of generation units - 100 nodes.85Table 4.5.Optimum allocation of generation units – theoretical resultsin snapshot mode – 100 nodes.85Table 4.6.Optimum allocation of generation units - 500 nodes.86Table 4.7.Summary of solar and wind resources.87Table 4.8.Optimum allocation of PV generation units.89Table 4.9.Optimum allocation of wind generation units.90Table 4.10. Simulation results using multicore computing.91Table 4.11. Simulation results using a refined Monte Carlo method –500-node test system.95Table 4.12. Simulation results using a refined Monte Carlo method –1000-node test system – PV generation.96Table 4.13. Simulation results using a refined Monte Carlo method –1000-node test system – Wind generation.97Table 4.14. Test system information.98Table 4.15. Summary of solar resources.98Table 4.16. Short term evaluation (1 year) – Energy losses withoutdistributed generation.99Table 4.17. Short term evaluation (1 year) – Optimum allocation of PVgeneration units (constant power).100Table 4.18. Short term evaluation (1 year) – Comparison of simulationresults - Constant Power Load Model - 60 cores.101Table 4.19. Short term evaluation (1 year) – Comparison of simulationresults - Constant Impedance Model - 60 cores.101Table 4.20. Short term evaluation (1 year) – Comparison of simulationresults - ZIP Model - 60 cores.102Table 4.21. Short term evaluation (1 year) – Energy loss reduction –Conventional Monte Carlo method.102
Table 4.22. Scenario for long term evaluation.104Table 4.23. Long Term Evaluation (17 years) – Energy losseswithout distributed generation.104Table 4.24. Long Term Evaluation – Comparison of simulation results.105Table 4.25. Long Term Evaluation – Total generation and energy lossreduction.105Table 4.26. Short Term Evaluation (1 year) – Additional reduction ofenergy losses.111Table 4.27. Long Term Evaluation – Percentage reduction of energylosses (%).112Table 4.28. Long Term Evaluation – “Divide and Conquer” procedure.113Table 4.29. Long Term Evaluation – Summary of results with “Divideand Conquer” procedure.113Table 5.1.Summary of solar resources.131Table 5.2.Characteristics of protective devices.131Table 5.3.Interconnection protection of PV plants.132Table 5.4.Failure statistics for overhead line sections.133Table 5.5.Failure statistics for system elements.133Table 5.6.Reliability indices - Sensitivity study.141Table 5.7.Probability distributions of reliability indices – Without DG– 420 runs.141Table 5.8.Probability distributions of reliability indices – With DG142Table 5.9.Probability distributions of reliability indices – WithDG (DG equipment can fail) – 420 runs.142Table 5.10. Simulation times – Scenario 3.142Table 5.11. Reliability indices without switching operations (Scenario3) – With Distributed generation (DG equipment can fail) –1 Run.145Table 5.12. Simulation times – With Distributed generation (DGequipment can fail) – Scenario 3.145Table 5.13. Operating conditions with and without PV generation.147Table 5.14. Simulation results with and without PV generation.147Table 5.15. Comparison of Reliability Indices (Scenario 3) – NewOperating Conditions – 420 Runs.149Table A.1.Load object properties.160Table A.2.Generator object properties.161Table A.3.Line object properties.161Table A.4.Transformer object properties.161Table A.5.Capacitor object properties.162Table A.6.PVSystem object properties.162
Table A.7.Vsource object properties.163Table A.8.Fuse object properties.163Table A.9.Relay object properties.164Table A.10. Recloser object properties.164Table A.11. Loadshape object properties.165
List of FiguresFigure 1.1.Power delivery system structure [1.10].4Figure 1.2.Typical distribution system configuration [1.10].5Figure 1.3.Single feeder configuration [1.11].6Figure 1.4.Open-loop configuration [1.11].7Figure 1.5.Distribution secondary circuit configuration.8Figure 1.6.Network configuration [1.11].9Figure 1.7.Distribution substation configuration [1.11].10Figure 1.8.Urban substation configuration.11Figure 1.9.Feeder current profile.17Figure 1.10.Element Up/Down history [1.31].20Figure 2.1.Serial execution [2.6].28Figure 2.2.Parallel execution [2.6].29Figure 2.3.Shared memory configuration [2.6].29Figure 2.4.Distributed memory configuration [2.6].30Figure 2.5.Library input parameters.32Figure 2.6.Output variables collection.32Figure 2.7.Virtual machines configuration.35Figure 2.8.Shared folder and virtual machines.36Figure 2.9.Block diagram of OpenDSS-MATLAB interaction.38Figure 2.10.slavefun function.39Figure 2.11.Deploytool user interface.39Figure 2.12.Execute stand-alone file from Windows prompt.40Figure 2.13.Diagram of the test system.41Figure 2.14.Settings for “Multicore for MATLAB” library.41Figure 2.15.Data input and master function execution.42Figure 2.16.Task-function code.43Figure 2.17.Output data retrieval.44Figure 2.18.Energy required from the HV system.44Figure 2.19.Energy losses.45Figure 3.1.Scheme of the OpenDSS PV generator model.51Figure 3.2.Wind turbine power vs. wind speed.60Figure 3.3.Generation of yearly curve shapes for distribution systemanalysis.66
Figure 3.4.Curve shapes for node loads and renewable generation.67Figure 3.5.Diagram of the test system.68Figure 3.6.Impact of DG on the minimum voltage values.69Figure 3.7.Energy required from the HV system (measured at thesecondary substation terminals).69Figure 3.8.Energy losses (without considering substation losses).69Figure 4.1.Block diagram of the implemented procedure.78Figure 4.2.Test system configuration and data.79Figure 4.3.Optimum location of one capacitor bank. Test system with100 nodes; 1000 runs.81Figure 4.4.Optimum location of two capacitor bank with compensationratio of 80%. Test system with 100 nodes; 1000 runs.82Figure 4.5.Optimum location of a single capacitor bank with a timevarying load. Test system with 100 nodes; 1000 runs.82Figure 4.6.Profiles of load and generation (not with the same scale).83Figure 4.7.Optimum location of a single generation unit. Test systemwith 100 nodes; 1000 runs.84Figure 4.8.Optimum location of a single generation unit. Test systemwith 500 nodes; 5000 runs.86Figure 4.9.Optimum location of a single PV generation unit. Testsystem with 1000 nodes; 10000 runs.88Figure 4.10.Optimum location of a single wind generation unit. Testsystem with 1000 nodes; 10000 runs.88Figure 4.11.Profiles of load and generation.91Figure 4.12.Generation of random values for energy loss calculations –One generation unit.93Figure 4.13.Pairing of n PV generation units in the Monte Carlo methodto obtain the minimum distance between random values.93Figure 4.14.Pairing of PV generation units to obtain the distancebetween two Monte Carlo runs.94Figure 4.15.Test system configuration.99Figure 4.16.Configuration of a PV generator.99Figure 4.17.Load growth.103Figure 4.18.Sequential connection of optimum rated PV generators –Conventional Monte Carlo method.106Figure 4.19.Simulation results – Conventional Monte Carlo method –ZIP Model.109Figure 4.20.Power losses – First year.111Figure 5.1.Sequence of events after a failure.121Figure 5.2.Actual energy not supplied during an event.125
Figure 5.3.Block diagram of the implemented procedure.129Figure 5.4.Test system configuration.130Figure 5.5.Time-current curves of protective devices.132Figure 5.6.Faulted element location.135Figure 5.7.Sequence of the system configurations after the occurrenceof the fault.136Figure 5.8.Sequence of events after the occurrence of the fault.137Figure 5.9.Status of protective devices and switches after theoccurrence of the fault.137Figure 5.10.Power measured at the substation terminals duringprotection system operation.138Figure 5.11.Power measured at the substation terminals duringcomplete simulation.139Figure 5.12.Power injected by the PV generation units.139Figure 5.13.Power consumed from some affected load nodes.140Figure 5.14.Reliability indices – Probability density functions.144Figure 5.15.Location of failed element.146Figure 5.16.Failure of the voltage regulator located within the leftside feeder – Total load power.148Figure 5.17.Reliability indices – Probability density functions.150Figure A.1.OpenDSS structure [A.1].159Figure A.2.OpenDSS element model [A.1].159Figure A.3.Default solution loop [A.2].160Figure A.4.OpenDSS user interface.165Figure A.5.Test system diagram.168Figure A.6.Master.dss file.169Figure A.7.List.dss file.170Figure A.8.Circuit solution commands.170Figure A.9.Run script on user interface.170Figure A.10. Show and Plot examples.170Figure A.11. Show Losses report file.171Figure A.12. Show Powers report file.171Figure A.13. Output Plot Circuit Power.172Figure A.14. MATLAB - OpenDSS communication.172Figure A.15. DSSStartup function.172Figure A.16. Circuit solution command from MATLAB.172Figure A.17. Test system diagram.175Figure A.18. Yearly solution MATLAB script.176
Figure A.19. System information plots.177Figure A.20. Load SA701 information plots.178
Chapter 11. Introduction1.1. Problem FormulationCurrently it is widely accepted that the construction of large generation centers is nolonger the best option to supply the increment of electric load. High costs related to theconstruction of new generation centers, state policies aimed at reducing the productionof greenhouse gases, and legal issues, such as obtaining environmental permits for theconstruction of new transmission lines, are some of the main reasons that have driventhe growth of small scale generation located close to actual load consumption, alsoknown as Distributed Generation (DG). Distributed generation can also be encompassedwithin a much larger scope, the Distributed Energy Resources (DER) concept. DERrefers to a variety of small, modular electricity-generating or storage technologies thatcan be aggregated to provide power necessary to meet regular demand and are installedat distribution level; distributed energy resources also includes demand-sidemanagement (i.e. energy efficiency and demand response) [1.1].The introduction of distributed energy resources can provide great benefits for systemoperation. However, construction and connection of distributed generators cannot bemade without considering the impact they will have on the system. Different planningstudies must be carried out in order to ensure maximum benefits, normal operation, andforesee any eventual issues. The connection of distributed generation under non-optimalcircumstances can have a negative impact on the system conditions and put normaloperation at risk.The optimum allocation of distributed generation will depend on the target functionused to evaluate the different options. The target function can comprehend bothtechnical and economic aspects. It is typically not possible to find a solution that canoptimize all factors considered in the evaluation; it is the target function that mustbalance the benefits obtained from every single option and determine the best solution.
Analysis of Power Distribution Systems Using a Multicore EnvironmentIn recent years many new methodologies have been developed to determine theoptimum allocation of distributed generation [1.2]. Some of these methodologies rely onanalytical approaches and assume many model simplifications [1.3]-[1.5], whereasothers apply highly complex optimization algorithms [1.6]-[1.8]. The accuracy of thesemethods will depend on the solution approach and also the model used forrepresentation of the distribution system.Most current methods pursue the optimum allocation of distributed generators thatconstantly operate at rated capacity; therefore generation based on renewable resources(such as photovoltaic or wind generation) cannot be evaluated using thesemethodologies. Moreover, these methods fail to take into account the temporal nature ofelectric load (i.e. load behavior over time); consequently the optimum allocation ofdistributed generation is performed for one specific moment in time, rather thancontemplating a larger evaluation period (e.g. one year). These are some of the aspectsthat need to be considered when developing new methods for the optimum allocation ofdistributed generation; furthermore, these new methodologies must be accurate, with astraightforward implementation, and time-efficient.One aspect that can be improved with the introduction of distributed generation is thereliability of the distribution system. Distribution reliability is assessed through theestimation of system and load-point reliability indices [1.9]. Reliability indices can becalculated in a predictive or statistical manner; a predictive approach allows thevalidation of the reliability of a system design, whereas the statistical method can beused to monitor system performance over a determined period of time.It is important for reliability methods to be able to cope with the possibility of systemreconfiguration; that is, modifying the system topology in order to restore service toaffected customers in the shortest time possible. The introduction of distributiongeneration further complicates the evaluation of reliability indices. Moreover, randomnature of system failure causes reliability indices to show a varying behavior (i.e. theydo not present constant values); therefore a proper analysis must be carried out in orderto estimate this variation. The use of detailed system element models allows a moreaccurate calculation of reliability indices.As a conclusion, it is clear that new methods for the evaluation of distribution reliabilitymust be developed. These new methods must take into account the random nature ofsystem failure, reconfiguration processes, the presence of distributed generation, and theresponse of system protection devices. Additionally, the new methods must be able toestimate the probability density function of reliability indices.This Chapter is summarized as follows. Section 1.2 details the common structure ofdistribution systems and lists some of the most common elements found in them.Section 1.3 makes a brief introduction to distributed generation and the maintechnologies, and analyzes the impact DG can have on system losses. In Section 1.4 asummary of reliability evaluation of power distribution systems is presented. Section1.5 presents the main accomplishments achieved as a result of the work carried out forthis Thesis. Finally, Section 1.6 presents the structure of the Thesis and provides a shortdescription of the following Chapters.2
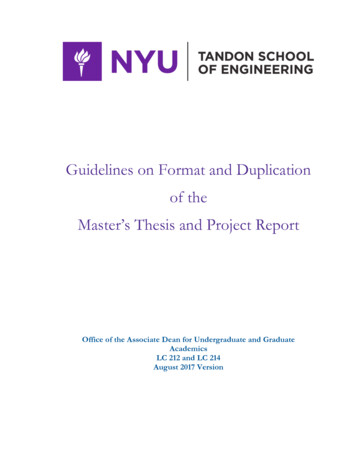
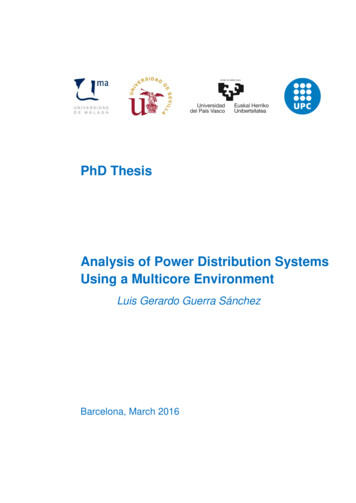
Chapter 1: Introduction1.2. Power Distribution Systems1.2.1. Power Systems General StructurePower delivery systems are designed to collect electrical energy produced in largegeneration centers and transport it to the final load points where costumers demand it.Power delivery systems are comprised by other subsystems; in a deregulated marketeach subsystem is owned by a different company and free competition is permitted ineach of them. The main subsystems in the power delivery system are presented in thissub-Section. Figure 1.1 shows the general structure of power systems [1.10]-[1.13].Large Generation CentersThe great majority of electrical energy is produced using large generation unitsclustered in remote sites, far from final consumption points. Different technologies havetraditionally been used to produce electrical energy in a large scale, such as nuclear,natural gas, coal, hydro, etc. Many of these plants were constructed in the past when theentire power system was owned by one company; lower costs and economies of scaleallowed these companies to construct large yet still profitable plants.Transmission SystemThe transmission system consists of a set of lines, substations, and equipment designedto connect large generation plants and consumption centers, power consumption ismainly carried out in cities and industrial areas. Lines belonging to the transmissionsystem span over long distances and transport large quantities of energy; therefore,these lines operate at high-voltage levels (e.g. 400 and 220 kV).Subtransmission SystemThe subtransmission system is an intermediary link between the transmission and thedistribution system. The lines that compose the subtransmission system cover shorterdistances than those in the transmission system; for that reason they operate at lowervoltage levels (e.g. 132, 66, and 45 kV). An initial voltage reduction is required due tothe difference in voltage level with respect to the transmission system. Large loads(such as big factories and other high consumption facilities) can be directly connected tothe subtransmission system.Primary Distribution SystemThe first component of the primary distribution system is the distribution substation,where the energy delivered by the transmission and subtransmission system is receivedand a new voltage reduction is performed. From the distribution substation one or moremedium-voltage distribution lines (e.g. 25 and 11 kV) take this energy one step closer to3
Analysis of Power Distribution Systems Using a Multicore Environmentthe final customers. As in the subtransmission system, large loads can be connected tothe primary distribution system.Secondary Distribution SystemThe secondary distribution system consists of step-down (MV/LV) distributiontransformers and low-voltage lines (e.g. 400 and 230 V) that deliver the energy to lowpower customers, such as commercial and residential loads.Large onsystemFigure 1.1. Power delivery system structure [1.10].1.2.2. Distribution System StructureThe distribution substation is the interconnection element between the distributionsystem and the upstream power delivery system. At the substation the step-down(HV/MV) transformer reduces the subtransmission voltage level to an appropriate value4
Chapter 1: Introductionfor primary distribution lines. Different protection, switching, and measurementequipment is installed at the substation to ensure a safe operation. The primarydistribution lines spread across the consumption area served by the substation, theseprimary distributions lines are also known as feeders. One or more lateral lines (orlaterals) branch from distribution feeders and extend until they reach the step-down(MV/LV) distribution transformers, which are responsible for performing the finalvolta
Distribution System Structure 4 1.2.3. Distribution System Primary Circuits 6 1.2.4. Distribution System Secondary Circuits 7 1.2.5. Distribution System Substations 8 1.2.6. Distribution System Elements 11 1.3. Distributed Generation 14 1.3.1. Distributed Generation Technologies 14 1.3.2. Distributed Generat