Transcription
European Leveraged Loan Chart Book – 1H20Fitch Ratings’ European Leveraged Loan Chart Book series illustrates recent trends in leveraged loan issuance,maturities and default rates31 July 2020
Leveraged FinanceEMEAEuropean Leveraged Loan Chart Book –1Q20Edward EyermanContentsManaging DirectorEuropean Leveraged FinanceT: 44 20 3530 1359E: edward.eyerman@fitchratings.comAnthony Elia, CFADirector1Primary Market Trends2Portfolio Quality343Default and Recovery Outlook584Appendices673European Leveraged FinanceT: 44 20 3530 1807E: tony.elia@fitchratings.comEdouard PorcherAssociate DirectorEuropean Leveraged FinanceT: 44 20 3530 1270E: edouard.porcher@fitchratings.comEuropean Leveraged Loan Chart Book31 July 2020fitchratings.com1
Leveraged FinanceEMEARecent Trends in the European Leveraged Loan MarketThe data and analysis provided in this chart book are based on Fitch Ratings’ portfolio ofprivate Credit Opinions (COs), and on the private and public ratings of 374 Europeanleveraged credits (as of 30 June 2020), primarily leveraged buyouts (LBOs). Within thisportfolio, 68% of entities are leveraged loan-only borrowers, 25% have both loans – revolvingcredit facilities (RCF) or term loans –and high-yield bonds in the capital structure, and 7% areprivate debt or unitranche borrowers. The total portfolio represents about EUR377 billion ofoutstanding senior and junior debt. COs are private point-in-time assessments of credit riskprincipally based on confidential information supplied by asset managers – mainly collaterisedloan obligation (CLO) investors – on individual borrowers. Fitch regularly updates COs butdoes not monitor them as private monitored or public ratings, and there is no formalrelationship between Fitch and the borrower’s management or owners. The ratings of COs areidentified by lower-case letters and an asterisk. Data and charts fall into three categories:Primary Market Trends, Portfolio Quality, and Default and Recovery Outlook. We alsohighlight market cohorts by distinguishing sponsor and non-sponsor deals, broadly syndicatedand privately placed issues, covenanted and covenant-lite structures as well as borrowers bydebt size (below EUR200 million, in the range of EUR200 million-500 million, and aboveEUR500 million).Primary Market TrendsPrimary markets returned in volume in June, with pre-coronavirus crisis underwritten dealsmeeting cross-border demand. Historically high enterprise value (EV) multiples in 1H20primary market LBOs reflect sponsor and arranger bias toward secular growth and Europeanchampions, notably in healthcare and telecommunications. High EVs imply substantial equitycushions which further supported a rise in pre-coronavirus crisis senior and total debtmultiples. Total leverage in 1H20 primary deals exceeded 7.0X while 55% of primary marketissuers exhibited senior leverage greater than 6.0x. Issuer count remains low, with only 14primary market LBOs, secondary buyouts (SBOs) and tertiary buyouts (TBOs) recorded in1H20, in comparison to 43 for full-year 2019. However, large volumes support the revision ofour 2020 total issuance forecast back to our pre-pandemic estimate of EUR55 billion, from theEUR45 billion revision in May. Primary recovery in June and July reflected a strong seconda rymarket rally, reverse inquiry from actively managed legacy CLOs preferring large, liquidnames and pent-up supply from pre-pandemic underwritings. Pricing adjustments appearmodest in primary, and we observe few covenant adjustments in comparison to pre-pandemictransactions, although smaller issuers offering less secondary market liquidity or characterisedas credit stories will likely require adjustments.European Leveraged Loan Chart Book31 July 2020Portfolio QualityDowngrades and the shift toward Negative Outlooks accompanied the spike in leverage forthose credits that entered the crisis with low rating headroom and near-term maturities, andthose in sectors directly affected by social-distancing and travel restrictions mandated bygovernments and businesses. Expedited reviews, which began in March 2020, applied to asubstantial part of the portfolio as the longer-term economic impact to demand and supplydynamics for multiple sectors required ne w assumptions on top-line revenue and operatingprofit forecasts, as well as expected issuer measures to contain costs and conserve cash. Inmore than 250 committees since end-March, Fitch downgraded more than 100 borrowers andapplied a Negative Outlook or Rating Watch Negative (RWN) to more than 50 credits whichwe affirmed at their pre-crisis rating level. Net downgrades since early 2018 reached 130 atend-1H20. Affirmations applied to credits mostly in technology, healthcare and stay-at-homesub-sectors, and most leveraged credits benefit from low legacy debt costs and have longdated maturity profiles. The portfolio reflects a longstanding financial-sponsor asset selectionbias toward European global champions and domestic incumbents with substantial marketshares and brand positioning, such that an economic recovery will support a return to cashgeneration. The recovery of the base-level metrics of many credits placed on Negative Outlookor downgraded in1H20 may take longer than that of more resilient credits affirmed with aStable Outlook.Default and Recovery OutlookAt the end of 1H20, Fitch observed 2.4% trailing 12-month (TTM) default rates for high-yieldbonds and 1.7% for loans. We affirm our full year 2020 forecast for 4.5% default rates in bondsand 3.8% in loans. The proportion of at-risk credits in Fitch’s portfolio that are ‘B-’/‘b-*’ onNegative Outlook/RWN or lower spiked to 26% at end-1H20. These exceed levels observedduring the eurozone crisis years of 2011-2012 yet remain below the historical peak set duringthe global financial crisis in 2009, when almost 40% of the portfolio was rated ‘b-*’/Negative orlower. We expect the at-risk portion of the portfolio to stabilise as we have completed ourreviews of credits with low headroom and in sectors we consider highly exposed to pandemicrelated disruption. Recovery estimates have principally remained steady as expected postrestructuring EBITDA and distressed EV multiples already reflected stressed operating andfinancial-market conditions. Our median expected senior recovery for the portfolio remains inthe region of 55%-60%.fitchratings.com2
Leveraged FinanceEMEASection1Primary Market TrendsEuropean Leveraged Loan Chart Book31 July 2020fitchratings.com3
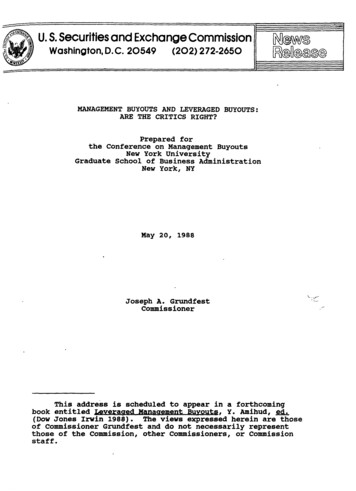
Leveraged FinanceEMEAPrimary Market European CLO and Leveraged Loan Issuance CLO issuance has adjusted to repricing in liabilitiesand collateral. However, ne w CLO formation willrequire new loan issuance to materially increase. We expect 2020 European leveraged loan issuance(excluding US borrowe rs) to match our precoronavirus crisis expectation of EUR55 billion. Pre-crisis unde rwritte n deals led to the return ofnew issuance in 2Q 20. Resilient cre dits conti nuewith incremental debt-funded acquisitions. A re turn to pre-crisis new issuance tre nds may takelonger as vendors remain reluctant sellers.Underwriting terms may vary as arrangers andinvestors distinguish post-pandemic narratives.European CLO Issuance1999-1H20EUR notion al (LHS)(EURbn)Fitch F Y p ro jection (LHS)Number of CLOs (RHS)(No)3590308070256020501540301020510001999 2000 2001 2002 2003 2004 2005 2006 2007 2008 2009 2010 2011 2012 2013 2014 2015 2016 2017 2018 2019 1H20Source: Fitch Ratings, BloombergWestern European Leveraged Loan Issuance (excluding US Borrowers and Repricings)2001-1H20(EURbn)Spons or (LHS)Spons orless (LHS)Fitch p ro jection (LHS)(No)Number of deals 017201820191H20Source: Fitch Credit Opinions DatabaseEuropean Leveraged Loan Chart Book31 July 2020fitchratings.com4
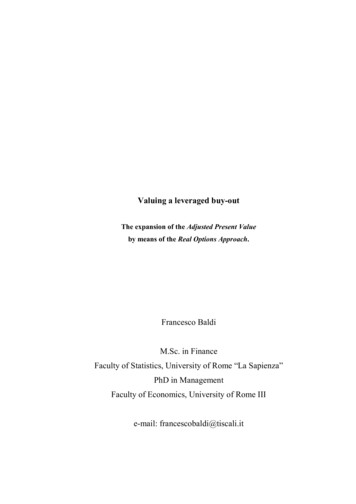
Leveraged FinanceEMEAPrimary Market Enterprise Value, Debt Multiples and Credit EV multiples on the 14 primary market LBOs weobserved in 1H20 hit an all-time high of 16x EBITDA(median). Pre-coronaviruscrisisprimary-ma rketdealstructures reflected the limited set of secular growthtargets on which sponsors are willing to paypremium valuations. Median total leverage andsenior leverage rose towa rds 7x and 6x EBITDA,respectively. High equity premium in 1H20 deals have resulted inan equity cushion of more than 60% , which is muchhigher than the levels of around 30% in 2006-2007. A sponsor bias towa rds se cular growth championswith high EBITDA and free cash flow (FCF) marginssupports high debt mul tiples. Initial cre dit profilesare nonetheless constrained to the middle of the ‘b*’category by aggressive use of pro forma EBITDA,incremental debt facilities to fund acquisitions andopportunistic dividend payments.EV, Leverage and Interest Coverage Multiples at Closing (Median)Primary-market LBO/SBO/TBO/QBOa in 2001-1H20(EBITDA x)1816141210864202001(56)EV /EBITDA2002(67)2003(51)2004(96)2005(103)Total gross 4)Senio r gross debt/EB Year (no. of deals))Note: Multiples are based on a Fitch EBITDA which may differ from the reference EBITDA used in information memoranda and marketing materials.aLeveraged Buy-Out/Secondary Buy-Out/Tertiary Buy-Out/Quaternary Buy-OutSource: Fitch Credit Opinions DatabaseDistribution of Issuer Default Credit Opinions (IDCOs) in New IssuanceProportion of primary-market LBO/SBO/TBO/QBObb *bb*bb-*b *b*b-*ccc 0Source: Fitch Credit Opinions DatabaseEuropean Leveraged Loan Chart Book31 July 2020fitchratings.com5
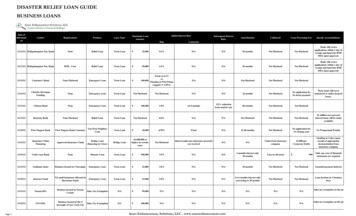
Leveraged FinanceEMEAPrimary Market Buyout and Refinancing Deals Greater than 6x Total Gross Leverage There is a threshold of 6x EBITDA, beyond whichregulated banks have to report ne w transactionsunder the ECB’s leveraged lending guidelines (LLG)for eurozone banks introduced at end-2017. We observed that 55% of primary-ma rkettransactions were above 6x EBITDA in 1H20. We anticipate more floating-rate note issuance asthese borrower-f riendly instruments remain eligibleCLO collateral, which are unconstrained by LLG, andbond-marke t investors revisit their search for yieldin senior secure d instruments of high-quality single‘B’ issuers.Proportion of Transactions with Loan Debt Multiples Greater than 6x – Entire PortfolioPrimary-market LBO/SBO/TBO/QBO and refinancings in 2004-1H20Issuers with loan debt multiples greater than 6x (RHS)(EBITDA x)Total fully draw n loan debt/EBITDA (median, all po rtfolio)Total fully draw n debt/EBITDA (med ian, all portf 16(91)2017(137)2018(96)2019(62)1H20(29)(Year (no. of deals))Note: Multiples are based on a Fitch EBITDA which may differ from the reference EBITDA used in information memoranda and marketing materials.Source: Fitch Credit Opinions DatabaseProportion of Transactions with Loan Debt Multiples Greater than 6x by CountryPrimary-market LBO/SBO/TBO/QBO and refinancings in 2004-1H20France (RHS)Germany (RH S)Total fully draw n loan debt/EBITDA (median, all po rtfolio)(EBITDA x)Other (RHS)UK (RHS)Total fully draw n debt/EBITDA (med ian, all portf 16(91)2017(137)2018(96)2019(62)1H20(29)(Year (no. of deals))Note: Multiples are based on a Fitch EBITDA which may differ from the reference EBITDA used in information memoranda and marketing materials.Source: Fitch Credit Opinions DatabaseEuropean Leveraged Loan Chart Book31 July 2020fitchratings.com6
Leveraged FinanceEMEAPrimary Market Buyout and Refinancing Deals Greater than 6x Total Gross Leverage (Cont.) The majority of transactions with reporte d de btgreater than 6x total gross leverage have debt ofmore than EUR500 million. The majority of these a rein service and asset-light sectors. Prior to the coronavirus crisis, mid-ma rket deals withtotal debt of more than EUR200 million coul d issuein both the leveraged loan and high-yield bondmarkets and pa rticipated in the trend of risingleverage profiles. Smaller borrowers with less than EUR200 million indebt represent a small proportion of deals exceeding6x total gross leverage as this cohort primarilyconsists of borrowers in loan-only “club-style” dealsor unitranche financings, with smaller EV multiplesyet higher debt-service costs.Proportion of Transactions with Loan Debt Multiples Greater than 6x by IndustryPrimary-market LBO/SBO/TBO/QBO and refinancings in 2004-1H20Indus trials (RHS)Technology, media and telecommu nications (RHS)Total fully draw n loan debt/EBITDA (median, all po rtfolio)(EBITDA x)Utilities (RHS)Co nsumer and healthcare (RHS)Total fully draw n debt/EBITDA (med ian, all portf 16(91)2017(137)2018(96)2019(62)1H20(29)(Year (no. of deals))Note: Multiples are based on a Fitch EBITDA which may differ from the reference EBITDA used in information memoranda and marketing materials.Source: Fitch Credit Opinions DatabaseProportion of Transactions with Loan Debt Multiples Greater than 6x by loan sizePrimary-market LBO/SBO/TBO/QBO and refinancings in 2004-1H20Greater than EUR500 million (RHS)Less than EUR200m (RHS)Total fully draw n debt/EBITDA (med ian, all portf olio)(EBITDA x)8EUR200 millio n-500 millio n (RHS)Total fully draw n loan debt/EBITDA (median, all po 2016(91)2017(137)2018(96)2019(62)1H20(29)(Year (no. of deals))Note: Multiples are based on a Fitch EBITDA which may differ from the reference EBITDA used in information memoranda and marketing materials.Source: Fitch Credit Opinions DatabaseEuropean Leveraged Loan Chart Book31 July 2020fitchratings.com7
Leveraged FinanceEMEAPrimary Market EV, Debt Multiples and CO Distribution in Healthcare and Pharmaceuticals The Fi tch COs and ratings assigned to healthcare and pha rmaceutical (pha rma) transactions in 2017-1H20 reflect a balanced portfolio of ‘b*’ and ‘b- *’, as opposed to the strong biastowards ‘b-*’ in the pre-global financial crisis period of 2004-2007. Despite more conservative valuations and credit metrics post-global financial crisis, business models are more ni cheand tend to lack product or geographical diversification. However, high valuation multiples in the sector reflect anti cipated benefits and cost savings, which may include highe r ma rgins,stronger cash generation and a higher multiple at exit. The healthcare and pha rma sector stands out as the most aggressive on leverage in the post-global financial crisis pe riod. About 65% of all transactions (incl uding refinancings)completed since 2017 in the sector have crossed the 6x total loan debt-to-EBITDA threshold on a fully drawn basis.Distribution of IDCOs in New Issuance – Healthcare and PharmaTotal Debt and EV Multiples (Median) – Healthcare and PharmaProportion of primary-market LBO/SBO/TBO/QBO and refinancings in sectorPrimary-market LBO/SBO/TBO/QBO and refinancings in sector in 2004-1H20bb *bb*bb-*b *b*b-*ccc *ccc*cc*Loan debt multip le 6x (RHS)Total fully draw n debt/EBITDA(EBITDA x)Total fully draw n loan debt/EBITDAEV 2010-132017-1H200%2004-07(56)2008-09(4)ᵃ Applies to LBO, SBO, TBO, QBO onlySource: Fitch Credit Opinions DatabaseSource: Fitch Credit Opinions DatabaseEuropean Leveraged Loan Chart Book2014-1631 July 20202010-13(23)2014-16(46)2017-1H20(32)(Year (no. of deals))fitchratings.com8
Leveraged FinanceEMEAPrimary Market EV, Debt Multiples and CO Distribution in Industrials Borrowers in the broad industrials sector maintain a higher equity cushion and lower leverage level than in 2004-2007. In the pre-global financial crisis (GFC) 2004-2007 period, confidence in profit growth and the ability of companies to generate FCF and deleverage supported a majority of ‘b*’ COs. In the post-e urozone-crisis period of 2014- 2016, the more conservative leverage metrics (only 29% of transactions exceede d 6x total debt to EBITDA on a fully dra wn basis) we re offsetby slower revenue growth and weaker margin expansion prospects that limit deleveraging potential and lead to high refinancing risk at maturity in most cases. The share of ‘b-*’ COs hasgrown since 2014. Industrial companies with niche applications and defendable market positions and stable profitability commanded high valuations.Total Debt and EV Multiples (Median) – IndustrialsDistribution of IDCOs in New Issuance – IndustrialsPrimary-market LBO/SBO/TBO/QBO and refinancings in sector in 2004-1H20Proportion of primary-market LBO/SBO/TBO/QBO and refinancings in sectorbb *bb*bb-*b *b*b-*ccc *ccc*cc*Loan debt multip le 6x (RHS)Total fully draw n debt/EBITDA(EBITDA x)12100%90%Total fully draw n loan debt/EBITDAEV 00%2004-07(186)2008-09(12)ᵃ Applies to LBO, SBO, TBO, QBO onlySource: Fitch Credit Opinions DatabaseSource: Fitch Credit Opinions DatabaseEuropean Leveraged Loan Chart Book2014-1631 July 2020100%2010-13(49)2014-16(73)2017-1H20(56)(Year (no. of deals))fitchratings.com9
Leveraged FinanceEMEAPrimary Market EV, Debt Multiples and CO Distribution in Retail, Lodging and Restaurants Completed legacy transactions in the retail, lodging and restaurants se ctor since 2014 exhibited lower leverage and a higher e quity cushion than obse rved in pre-2007 transactions. Only41% of transactions exceeded 6x total debt to EBITDA on a fully drawn basis in 2017-1Q20 compared to 33% in 2008-2009. The eurozone crisis and technological disruption contributed to a more cautious approach to transactions in this sector. The ratings were consistently in the single ‘B’ category. This is supported by the fact that non-food retailers are largely confined to their core ma rkets with fe wer benefits from scale than the manufacturing sector, resulting in less-strategicM&A in retail than in other segments. Moreover, the differences in cultural practi ces and their contribution to high integration risk is also a constraint to cross-border non-food retailM&A. The three segments (retail, lodging and restaurants) face severe challenges from an uncertain post-pandemic operating environment.Distribution of IDCOs in New Issuance – Retail, Lodging and RestaurantsProportion of primary-market LBO/SBO/TBO/QBO and refinancings in sectorbb *bb*bb- *b *b*b-*ccc *ccc*cc*Total Debt and EV Multiples (Median) – Retail, Lodging and RestaurantsPrimary-market LBO/SBO/TBO/QBO and refinancings in sector in 2004-1H20Loan debt multip le 6x (RHS)Total fully draw n debt/EBITDA(EBITDA x)Total fully draw n loan debt/EBITDAEV 0-132017-1H200%2004-07(71)2008-09(3)ᵃ Applies to LBO, SBO, TBO and QBO onlySource: Fitch Credit Opinions DatabaseSource: Fitch Credit Opinions DatabaseEuropean Leveraged Loan Chart Book2014-1631 July 2020100%2010-13(40)2014-16(44)2017-1H20(37)(Year (no. of deals))fitchratings.com10
Leveraged FinanceEMEAPrimary Market EV, Debt Multiples and CO Distribution in Business Services Business services companies exhibit more conservative leverage in the present cycle, with 65% of transactions exceeding 6x total loan debt to EBITDA on a fully drawn basis in 20171H20 compared with 78% in 2008-2009. Many of these businesses are asset-light and have higher-than-average FCF margins. Higher equity contributions often reflect sponsor comfort in the high-margin, high barrier-to-entry and growth profiles of multiple service sub-sectors. The better balance between financial risk and business risk in the recent transactions is reflecte d in a highe r proportion of ‘b*’ and above credit profiles. Business model stability reflectslong-term customer relationships, low churn rates, stable profitability and low cash flow volatility, all of which underscore confidence in deleveraging forecasts.Total Debt and EV Multiples (Median) – Business ServicesDistribution of IDCOs in New Issuance – Business ServicesPrimary-market LBO/SBO/TBO/QBO and refinancings in sector in 2004-1H20Proportion of primary-market LBO/SBO/TBO/QBO and refinancings in sectorbb *bb*bb-*b *b*b-*ccc *ccc*cc*Loan debt multip le 6x (RHS)Total fully draw n debt/EBITDA(EBITDA x)14100%90%Total fully draw n loan debt/EBITDAEV 17-1H200%2004-07(58)2008-09(9)ᵃ Applies to LBO, SBO, TBO, QBO onlySource: Fitch Credit Opinions DatabaseSource: Fitch Credit Opinions DatabaseEuropean Leveraged Loan Chart Book2014-1631 July 20202010-13(39)2014-16(42)2017-1H20(85)(Year (no. of deals))fitchratings.com11
Leveraged FinanceEMEAPrimary Market EV, Debt Multiples and CO Distribution (Debt Less than EUR200 million) A majority of ne w deals with total debt committed below EUR200 million carry a ‘b-*’ or below Issue r Default Credit O pinion (IDCO) due to their small operating scale, lack ofdiversification and key-person risk. Private equity spons ors faced lowe r competition for smaller ta rgets, although their efforts to combine portfolio companies and emphasise synergies from size and scale have contributedto an increase in valuations since 2014. While leverage at issuance for this category of borrowe rs re mained lower than new issuance across the portfolio as a whole (around 44% of transacti ons exceeded 6x total de bt toEBITDA on a fully drawn basis in 2017-1H20), the high proportion of ‘b-*’ IDCOs reflects the idiosyncratic business risks facing smaller borrowers.Total Debt and EV Multiples (Median) in New Issuance Below EUR200m DebtDistribution of IDCO in New Issuance with Debt Below EUR200mPrimary-market LBO/SBO/TBO/QBO and refinancings in segment in 2004-1H20Proportion of primary-market LBO/SBO/TBO/QBO and refinancings in segmentbb *bb*bb-*b *b*b-*ccc *ccc*cc*100%Loan debt multip le 6x (RHS)Total fully draw n debt/EBITDA(EBITDA x)Total fully draw n loan debt/EBITDAEV -132017-1H200%2004-07(133)2008-09(15)ᵃ Applies to LBO, SBO, TBO, QBO onlySource: Fitch Credit Opinions DatabaseSource: Fitch Credit Opinions DatabaseEuropean Leveraged Loan Chart Book2014-1631 July 20202010-13(58)2014-16(50)2016-1H20(43)(Year (no. of deals))fitchratings.com12
Leveraged FinanceEMEAPrimary Market EV, Debt Multiples and CO Distribution (Debt of EUR200 million -500 million) New transactions with committed debt of EUR200 million-500 million carried higher leverage than those with less than EUR200 million, but a higher proportion is rated ‘b*’. The larger debt amount often implies that the underlying businesses enjoy the benefits of scale and incumbent status in their sectors. Geographical and product diversification typically helps medium-sized credits absorb adverse market or ope rating conditions be tter than smaller issue rs, hence supporting a highe rIDCO for a given leverage profile.Distribution of IDCO in New Issuance with Debt Between EUR200m-500mProportion of primary-market LBO/SBO/TBO/QBO and refinancings in segmentbb *bb*bb-*b *b*b-*ccc *ccc*cc*Total Debt and EV Multiples (Median) in New Issuance Between EUR200-500m DebtPrimary-market LBO/SBO/TBO/QBO and refinancings in segment in 2004-1H20Loan debt multip le 6x (RHS)Total fully draw n debt/EBITDA(EBITDA x)Total fully draw n loan debt/EBITDAEV 10-132017-1H200%2004-07(219)2008-09(14)ᵃ Applies to LBO, SBO, TBO, QBO onlySource: Fitch Credit Opinions DatabaseSource: Fitch Credit Opinions DatabaseEuropean Leveraged Loan Chart Book2014-1631 July 20202010-13(81)2014-16(124)2016-1H20(129)(Year (no. of deals))fitchratings.com13
Leveraged FinanceEMEAPrimary Market EV, Debt Multiples and CO Distribution (Debt More than EUR500 million) IDCOs of larger transactions – with committed debt above EUR500 million – more often reach ‘b *’ and above levels. Larger transactions are often international or domestic champions with proven market positions, prici ng power and cash generation profiles that imply the ability to se rvice debt andreduce leverage on a gross basis.Total Debt and EV Multiples (Median) in New Issuance Above EUR500m DebtDistribution of IDCO in New Issuance with Debt Above EUR500mPrimary-market LBO/SBO/TBO/QBO and refinancings in segment in 2004-1H20Proportion of primary-market LBO/SBO/TBO/QBO and refinancings in segmentbb *bb*bb-*b *b*b-*ccc *ccc*cc*100%(EBITDA x)1490%Loan debt multip le 6x (RHS)Total fully draw n debt/EBITDATotal fully draw n loan debt/EBITDAEV 17-1H200%2004-07(317)2008-09(29)ᵃ Applies to LBO, SBO, TBO, QBO onlySource: Fitch Credit Opinions DatabaseSource: Fitch Credit Opinions DatabaseEuropean Leveraged Loan Chart Book2014-1631 July 20202010-13(93)2014-16(150)2016-1H20(226)(Year (no. of deals))fitchratings.com14
Leveraged FinanceEMEAPrimary Market EV and Debt Multiples by Size and Ownership Financial sponsor-led deals contribute d tohistorically high leveraged loan volumes, butcompetition from s trategic buyers and IPO marketshave driven up EVs for larger, established Europeanmarket leaders since 2014.Total Debt and EV Multiples (Median) by Ownership and Debt Size at Issuance in EURLBO/SBO/TBO/QBOTotal debt/EBITDA xEV/EBITDA x(x)16 Large equity cushions in recent spons or transactionsreflect demand for companies in growth- relatedtechnology and services actionsSpons or lessSpons orSpons or lessSpons orSpons or lessSpons orSpons or lessSpons orSpons or lessSpons orSpons or lessSpons orSpons or lessSpons orSpons or lessSpons orSpons or lessSpons or0 200mBetw een200mand 500m 500m 200mBetw een200mand 500m 500m 200mBetw een200mand 500m 500m(44)(48)(39)(25)(69)(66)(15)(48)(88)Source: Fitch Credit Opinions DatabaseEuropean Leveraged Loan Chart Book31 July 2020fitchratings.com15
Leveraged FinanceEMEAPrimary Market Use of Proceeds and Size of Transactions Extending a trend firmly established in 2019, the rewas high issuance f rom select se cular growth LBOsand take-private transactions where sponsors foundvalue in familiar listed companies in 1H20. These offset declines from carve-out LBOs assponsors remain sensitive to valuations for ce rtainprimary assets where synergies can be difficult torealise. They therefore rely heavily on recyclingcredits via S BOs, TBOs, dividend recapitalisationsand bolt-on acquisitions.Median Committed Debt at Issuance for First-time 3)2016(22)2017(24)2018(28)2019(30)1H20(8)(Year (no. of deals))Source: Fitch Credit Opinions DatabaseUse of Proceeds in Fitch Rated TransactionsLBO(No. of deals)80SBO/TBO/QBODiv-RecapOther Ref ce: Fitch Credit Opinions DatabaseEuropean Leveraged Loan Chart Book31 July 2020fitchratings.com16
Leveraged FinanceEMEAPrimary Market EV, Debt Multiples Comparison Between LBOs and SBO/TBOs The level of first-time L BO EV multiples exceededthat of 2007 although on materially lower issuancevolumes, reflecting sponsor valuation concerns oncyclical targets and a preference for companiesachieving secular growth.Comparison of EV Multiples in LBOs and SBO/TBOs (Median)LBO(EBITDA (96)2005(102)2006(122)2007(130)2008(34)2009(9)2010 2011 2012(34)(35)(22)(Year (no. of 46)2018(42)2019(41)1H20(12)Source: Fitch Credit Opinions DatabaseComparison of Total Debt Multiples in LBOs and SBO/TBOs (Median)(EBITDA )2011(35)2012(22)2013(41)(Year (no. of deals))Source: Fitch Credit Opinions DatabaseEuropean Leveraged Loan Chart Book31 July 2020fitchratings.com17
Leveraged FinanceEMEAPrimary Market EV, Debt Multiples Comparison Between LBOs and SBO/TBOs Comparing separate market phases, transactionsbetween 2014 and 2016 showed inte rest marginsrising in tandem with leverage, with senior securedmargins reaching a peak of 500bp for fi rst-time LBOsin 2016 However, leverage has continued to rise whilespread ma rgins decline d for first- time LBOs andrecycled buyouts. Prevailing conditions of assetscarcity and strong funding conditions continue tosupport issuer bargaining power, evident inunpre cedented borrowe r-friendly documentationand repricing trends.Debt Amounts, Margin, Tenor and Leverage by PeriodFirst-time (years)Drawndebt t 05.36.7177.04.
Jul 31, 2020 · European Leveraged Loan Chart Book fitchratings.com 2 Leveraged Finance EMEA Recent Trends in the European Leveraged Loan Market Portfolio Quality Downgrades and the shift toward Negative Outlooks accompanied the spike in leverage for those credits that entered the cris