Transcription
Country profile – South SudanVersion 2015
Recommended citation: FAO. 2015. AQUASTAT Country Profile – South Sudan.Food and Agriculture Organization of the United Nations (FAO). Rome, ItalyThe designations employed and the presentation of material in this informationproduct do not imply the expression of any opinion whatsoever on the part of theFood and Agriculture Organization of the United Nations (FAO) concerning the legalor development status of any country, territory, city or area or of its authorities,or concerning the delimitation of its frontiers or boundaries. The mention of specificcompanies or products of manufacturers, whether or not these have been patented,does not imply that these have been endorsed or recommended by FAO inpreference to others of a similar nature that are not mentioned.The views expressed in this information product are those of the author(s) and donot necessarily reflect the views or policies of FAO.FAO encourages the use, reproduction and dissemination of material in thisinformation product. Except where otherwise indicated, material may be copied,downloaded and printed for private study, research and teaching purposes, or foruse in non-commercial products or services, provided that appropriateacknowledgement of FAO as the source and copyright holder is given and that FAO’sendorsement of users’ views, products or services is not implied in any way.All requests for translation and adaptation rights, and for resale and othercommercial use rights should be made via www.fao.org/contact-us/licencerequestor addressed to copyright@fao.org.FAO information products are available on the FAO website (www.fao.org/publications) and can be purchased through publications-sales@fao.org. FAO 2015
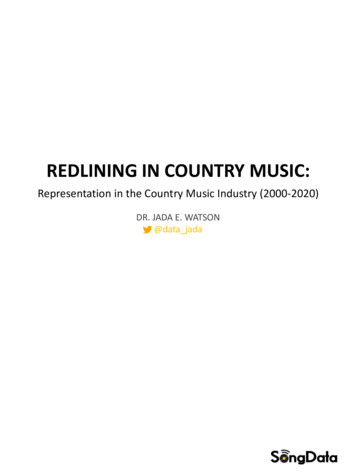
1South SudanGEOGRAPHY, CLIMATE AND POPULATIONGeographySouth Sudan is the newest country in Africa. It became independent from Sudan in 2011 after a civilwar and a referendum in favour of secession. South Sudan has an area of about 644 330 km2 (the exactarea still needs to be confirmed), representing around 30 percent of pre-2011 Sudan. It is a landlockedcountry bordered by Sudan in the north, Ethiopia and Kenya in the east, Uganda and the DemocraticRepublic of Congo in the south, and the Central African Republic in the west. South Sudan is constitutedby 10 States, corresponding to three regions of pre-2011 Sudan: Bahr el Ghazal, Equatoria and GreaterUpper Nile. Each State is further divided into counties, payams and bomas.The main feature of the country is the White Nile river extending over clay plains and slopes graduallyrising southward to mountains up to 3 000 meters above sea level in the Imatong Hills. The Suddwetland is the inland delta of the White Nile and one of the largest swamps worldwide. It consists oflakes, marshes and extensive floodplains, some parts of which are infested by insects which arehazardous to humans and livestock.The cultivable area is estimated at about 2.76 million ha (4 percent of the total land area) (Table 1) andnearly 50 percent is found in Upper Nile, Jonglei, and Warrap states. The forest resources of SouthSudan cover approximately one third of the total area of the country. Natural forests are diverse includingrainfall savannah, woodlands and special areas of mountainous vegetation in the Imatong mountains,making it one of the richest areas of concentrations of biodiversity in Africa. Shrubs cover around 39percent of the country and herbaceous vegetation around 22 percent (AfDB, 2013).TABLE 1Basic statistics and populationPhysical areas:Area of the country*Agricultural land (permanent meadows and pasture cultivated land) As % of the total area of the country Permanent meadows and pasture Cultivated area (arable land area under permanent crops)- As % of the total area of the country- Arable land (temp. crops temp. fallow temp. meadows)- Area under permanent crops20122012201220122012201164 433 00028 533 2004425 773 2002 760 0004-haha%haha%haha20132013201311 296 000inhabitants%inhabitants/km2201311 804Population:Total population- Of which ruralPopulation density7018Economy and development:Gross Domestic Product (GDP) (current US ) Value added in agriculture (% of GDP) GDP per capitaHuman Development Index (highest 1)Gender Inequality Index (equality 0, inequality 1)20131 045-million US /year%US /year-Access to improved drinking water sources:Total populationUrban populationRural population* The exact area still needs to be confirmed201257201220126355%%%
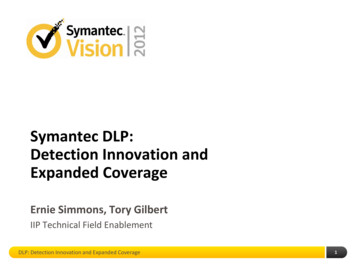
2Irrigation in Africa in figures - AQUASTAT Survey - 2015FIGURE 1Map of South Sudan
South Sudan3ClimateMost of South Sudan has a sub-humid climate. The average annual rainfall is around 900 mm/year, andranges between 700 mm in the lowlands areas of Eastern Equatoria, Jonglei, Upper Nile, and Bahr elGhazal and 2 200 mm/year in Western Equatoria and highland parts of Eastern Equatoria.Depending on the regions, one or two rainy seasons can be distinguished (WB, 2013): Western and Central Equatoria have a bimodal rainfall pattern: The first occurs from April toJune and the second from August to November. This pattern creates a long wet season (withjust July a bit drier), a short dry period (December to March) and long agriculture growingseasons (280–300 days).Other regions have a unimodal rainfall pattern with a wet season (May to October) and a dryperiod (November to April). Their annual growing season is relatively short (130–150 days).The mean temperatures in South Sudan are typically above 25 C and can rise above 35 C, particularlyduring the dry season, which lasts from January to April, and trigger migration for pastoralists. In themore agricultural zones such as the Hills and Mountains zone and the Green belt zone, there are tworainy seasons, April to July and August to December. As a result, potential evaporation decreases froma maximum of 2 400 mm/year in the north to 1 400 mm/year in the south.However, rainfall in South Sudan is decreasing and this is likely a result of climate change, although itis relatively less in comparison to northern part of the country (WB, 2011).PopulationSouth Sudan’s population is 11.3 million in 2013 with an annual growth rate of 4.1 percent (over theperiod 2012-2013), which is the highest in Africa (Table 1). Population density is 18 inhabitants/km2and 70 percent of the total population is rural. At the national level, 57 percent of the population hadaccess to improved drinking water sources in the year 2012 (JMP, 2014). In urban areas this coveragewas 63 percent, while in rural regions it was 55 percent (Table 1). The situation regarding sanitation iseven worse with only 9 percent of the population with improved sanitation facilitation in 2012 (16percent in urban areas and 7 percent in rural areas). The Human Development Index is not yet availablefor South Sudan. However, years of conflict have left South Sudan one of the most underdevelopedregions worldwide, despite its rich natural resources. Poverty in South Sudan is widespread andespecially acute in rural areas, the remote areas of the south and in the Bahr el Ghazal region (GoSS,2011). It has an incidence of 50.6 percent in 2009. In 2013, the life expectancy in the country was 55.3years and the under-five mortality was 104 per 1000 births, progressing from 121 in 2008. Primaryeducation is also lacking behind in South Sudan, as attendance was only 41.3 percent of the children in2011, one of the lowest enrolment rate in the world, even lower for girls (34.3 percent). Consequently,the adult literacy of the over 15 years old in 2010 is very low with 27 percent (GoSS, 2011).ECONOMY, AGRICULTURE AND FOOD SECURITYAlthough endowed with rich natural resources, South Sudan remains comparatively underdeveloped asa result of recurrent conflicts. Its economy is characterized by a strong dependence on oil resources andrevenues, a currently limited domestic production and a high reliance on imports.The GDP of South Sudan was US 11 800 million (current US ) in 2013. The oil sector accounts for 60percent of the total GDP in 2010 (AfDB, 2013). However, oil exports like any other economicopportunities are severely constrained by poor transport infrastructures and unreliable electricity power(USAID, 2007). In particular, the oil sector is highly dependent on pipeline shutdown, but this also Even though the country South Sudan came into existence in 2011, if there is information available specificallyfor South Sudan also before 2011, it has been included in the profile.
4Irrigation in Africa in figures - AQUASTAT Survey - 2015restricts irrigated agriculture, as well as other agricultural processing or storage units that couldstrengthen the agricultural sector.Agriculture has indeed a great potential, however it consists mostly of hand-cultivated subsistencefarming under rainfed conditions on household plots of less than two hectares (FAO et al., 2011), aswell as livestock-rearing. Only 20 percent of cereal farming is mechanized. The Green belt zone, inWestern and Central Equatoria states, is the only area where tropical crops can be grown withoutirrigation (Yongo-Bure, 2007). The livestock population includes cattle, sheep and goats, which areraised in the more arid and semi-arid zones such as Eastern Equatoria. Livestock, estimated at 38.4million heads in 2010 for the 10 Southern States only, which coincide with the present South Sudan, areeither nomadic pastoralist or mixed crop-livestock systems and are a major source of livelihoods,especially in the floodplains of the Upper Nile and the semi-arid pastoral areas. Commercial exploitationof forestry is currently limited only to teak, mahogany and gum Arabic. In total, the agricultural sectoraccounts for around 14.5 percent of the GDP, or 36 percent of non-oil GDP in 2010 (AfDB, 2013).Over half of the population in South Sudan is poor (daily expenditures of less than US 2) with hugeregional disparities (AfDB, 2013). Eighty percent of poor households are dependent on agriculture astheir main source of livelihood, putting therefore the agricultural sector at the forefront of the povertyfighting strategy. Food insecurity concerns 36 percent of the population, of which 9.7 percent areseverely food insecure, and 47 percent of the population is undernourished. South Sudan is dependenton food imports (GoSS, 2011) and food aid with almost 2.4 million beneficiaries of food aid in 2010(GoSS and UNDP, 2012). The situation worsened in 2013-2014 due to conflict resuming, not onlydisplacing people but also preventing livestock to use their usual grazing paths (FAO, 2014).WATER RESOURCESSurface water in South Sudan comprises the Nile river system (nilotic water) and the Rift Valley basin.About 20 percent of the Nile basin lies within South Sudan, while 97.5 percent of Sudan lies in the Nilebasin: The Nile basin, 627 890 km2 (97.5 percent of the area of the country)The Rift Valley basin, in the southeast of the country at the border with Ethiopia and Kenya,covering 16 440 km2 (2.5 percent)The Nile system within South Sudan comprises: The White Nile system, upstream of Sobat river, originating on the Great Lakes PlateauThe Baro/Sobat river system originating in the Ethiopian highlandsThe Bahr El Ghazal basin, an internal basin in the west of South Sudan and also extending toSudan to the northBoth the Sobat and Bahr El Ghazal rivers are seasonal rivers, contrarily to the Nile river which is apermanent river.The major groundwater formation is the Sudd basin, also called the Umm Rwaba basin, the extent ofwhich is currently unknown as well as its relationship with the overlaying surface water, in particularthe swamps.In 2013, the Sudd is the only Ramsar listed wetland of the country. It is an inland delta of the White Nileand is made up of lakes, swamps, marshes and flood plains. Its extent fluctuates from 10 000 km2 tomore than 35 000 km2 depending on rainfall and evaporation, which is exceptionally high. An estimated50 percent of the inflow to the Sudd, mainly through the White Nile system, is lost to evaporation. It isone of Africa’s largest swamps. The Jonglei Canal, between Bahr el Jebel and the White Nile, wasplanned to divert water from upstream of the Sudd to a point farther down the White Nile, thus bypassingthe swamps with the purpose to make more water available for irrigation and hydropower downstream.Works on it were discontinued in 1983 after two thirds were completed because of civil war and local
South Sudan5opposition to the project. There are attempts to revive this highly controversial project, but with noconcrete decision yet. The Bahr el Ghazal and Sobat/Machar swamps are also large.Internal renewable surface water resources are estimated at 26 000 million m3/year, internal renewablegroundwater resources at 4 000 million m3/year, which is all considered to be overlap feeding the baseflow of the river system. Therefore the total internal renewable water resources (IRWR) are equal to26 000 million m3/year (Table 2). The White Nile enters South Sudan from Uganda with an averageannual flow of 37 000 million m3. The river receives about 13 000 million m3 from the Sobat river,coming from Ethiopia, joining the White Nile just upstream of Malakal. The daily discharge at Malakalfluctuates between 50 million m3 in April to 110 million m3 in November (ratio 1:2). While the total ofIRWR and inflow is equal to 76 000 million m3/year ( 26 000 37 000 13 000), only 34 000 millionm3/year leaves the country to Sudan, due to an exceptionally high annual evaporation in the huge swamparea estimated at 42 000 million m3.TABLE 2Water resourcesRenewable freshwater resources:Precipitation (long-term average)Internal renewable water resources (Long-term average)Total renewable water resourcesDependency ratioTotal renewable water resources per inhabitantTotal dam capacity2013900579 90026 00049 500664 382-mm/yrmillion m3/yrmillion m3/yrmillion m3/yr%m3/yrmillion m3While the total renewable water resources are estimated at 76 000 million m3/year, accounted waterresources are less due to an agreement between pre-2011 Sudan and Egypt that 65 500 million m3/yearshould enter Egypt from Sudan. While it is not known yet what the agreement will be after the splittingof Sudan into South Sudan and Sudan, this will have consequences for both South Sudan and Sudan,especially since South Sudan is much more humid than Sudan. For now AQUASTAT has consideredthat 26 500 million m3/year of the total flow of 34 000 million m3/year flowing from South Sudan toSudan is submitted and secured through the agreement to flow to Egypt, which is equal to34 000x(65 500/84 000), whereby 65 500 million m3/year is the accounted inflow into Egypt accordingto the agreement and 84 000 million m3/year is the total flow to Egypt (see Sudan country profile).Therefore the total (accounted) renewable water resources for South Sudan are equal to 49 500 millionm3/year ( 76 000-26 500). It should be mentioned that this calculation done by AQUASTAT is aninterim calculation that neither represents AQUASTAT’s position or recommendation, nor should itcarry any political significance. Information will be updated as soon as information on a new or updatedagreement will become available.Dam capacity is limited in South Sudan. The Maridi dam, also called Kazana, was rehabilitated in 2010for public water supply and irrigation uses. Feasibility studies have been contracted in 2008 for threemedium-sized dams: the Sawa dam in Wau, the Baraj dam in Juba and the Kenti dam in Torit(respectively in Western Bahr El Ghazal, Western Equatoria and Eastern Equatoria states), aiming atfulfilling South Sudan’s needs for electricity and clean water. In addition, the Bahr el Jebel hydropowercascade has also been proposed constituted by five projects in Fula, Bedden, Shukoli, Lekki and Jubayielding an estimate 2 590 MW compared to the current 22 MW available (for a demand of around 45MW).Traditionally micro-dams across small water courses or dikes were constructed for livestock watering.Other water facilities were also developed, such as hafir which is an underground reservoir for storingrainwater carried by streams and situated away from human settlement and animal pasture, open wellsand expanded/deepened seasonal river banks (GoSS, 2013).Non-conventional water sources are limited in South Sudan. The country being landlocked, desalinationof seawater is not possible.
6Irrigation in Africa in figures - AQUASTAT Survey - 2015INTERNATIONAL WATER ISSUESSurface water and groundwater resources are mostly shared with neighbouring countries. The Nile river,which is shared between 11 countries, is the primary source of South Sudan’s water in addition to itsIRWR. However, more than half of its water resources evaporate before reaching the border with Sudan.The first Nile Waters Agreement between Egypt and pre-2011 Sudan was signed in 1929. It allocatedto Egypt the right to use 48 000 million m3/year, while it gave Sudan the right to tap only about 4 000million m3/yr. The agreement does not allocate to Ethiopia any rights to use the Nile waters and alsostill binds Uganda, the United Republic of Tanzania and Kenya and bars them from using the LakeVictoria waters. In 1959, the Nile Waters Agreement between Egypt and Sudan assigned to Sudan18 500 million m3/year, measured at Aswan at the border with Egypt. The other riparian countries arestill not included in this agreement.In the beginning of the 21st Century the Nile Basin Initiative (NBI) created and prepared a StrategicAction Programme, which consists of two sub-programmes: the Shared Vision Programme (SVP) andthe Subsidiary Action Programme (SAP). The SVP is to help create an enabling environment for actionon the ground through building trust and skill, while the SAP is aimed at the delivery of actualdevelopment projects involving two or more countries. Projects are selected by individual ripariancountries for implementation and submitted to the Council of Ministers of the NBI for approval. Pre2011 Sudan, Ethiopia and Egypt also adopted a strategy of cooperation in which all projects to belaunched on the river should seek the common benefit of all member states and this should be includedin accompanying feasibility studies. South Sudan was admitted to the NBI in 2012.However, the NBI is intended to be a transitional institution until the Cooperative FrameworkAgreement (CFA) negotiations are finalized and a permanent institution created. This new Nile CFAwas signed in 2010 by five countries–Ethiopia, Kenya, Uganda, Rwanda and United Republic ofTanzania–and in 2011 by Burundi. Egypt strongly opposed this agreement which gives deciding powerover large-scale hydraulic projects to a commission representing all the signatories, hence cancellingEgypt’s historical right of veto. Pre-2011 Sudan, a traditional ally of Egypt, initially also rejected theagreement, but the new Sudan is now considering its signature due to increasing awareness of theunequal sharing and also hoping for benefits, in particular from the Ethiopian Renaissance dam,expected to be completed in 2017. South Sudan is also still to decide upon the CFA signature, especiallybecause its water contribution to the Nile is considerable and the country is not bound by the 1959 NileWaters Agreement. The Democratic Republic of the Congo has not signed yet either. The CFA was puton hold due to the Egyptian revolution of 2011. As mentioned in the previous section, for nowAQUASTAT has considered that 26 500 million m3/year of the total flow of 34 000 million m3/yearflowing from South Sudan to Sudan is submitted and secured through the agreement. However, it shouldclearly be mentioned that this is an interim calculation that neither represents AQUASTAT’s positionor recommendation, nor should it carry any political significance. Information will be updated as soonas information on a new or updated treaty will become available.South Sudan shares also three transboundary aquifers with neighbouring countries (Table 3), for whichthere is no sharing agreement.TABLE 3Transboundary aquifers (Source: IGRAC, 2014)Aquifer nameBaggara basinSuddKaroo-CarbonateTotal aquifer area (km2)239 411331 661941 127Sharing countriesCentral African Republic, South SudanEthiopia, KenyaCentral African Republic, Democratic Republic of the Congo, SouthSudan
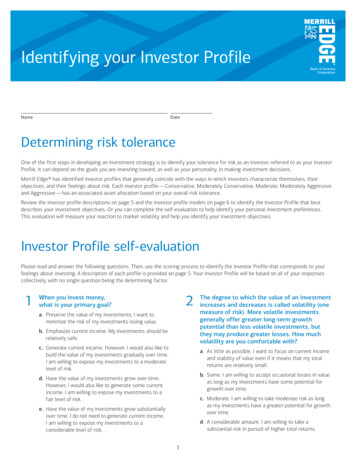
South Sudan7WATER USETotal water withdrawal in pre-2011 Sudan was estimated at 27 590 million m3 for the year 2005. Thelargest water user by far was agriculture with 26 150 million m3. Municipalities and industry accountedfor withdrawals of 1 140 million m3 and 300 million m3 respectively. Figures for 2011 for South Sudanhave been estimated based on the above figures for pre-2011 Sudan, keeping the same total for SouthSudan and Sudan together and considering that no essential changes have taken place, that almost allirrigation is located in Sudan (Figure 2), that the population of South Sudan is 17 percent of the totalpopulation of pre-2011 Sudan and that most (75 percent) of the industries are located in South Sudan(petrol area) (Table 4).TABLE 4Water useWater withdrawal:Total water withdrawalAgriculture (Irrigation Livestock Aquaculture)MunicipalitiesIndustry Per inhabitantSurface water and groundwater withdrawal (primary and secondary) As % of total renewable water 0.76581.3million m3/yearmillion m3/yearmillion m3/yearmillion m3/yearm3/yearmillion m3/year%Non-conventional sources of water:-Produced municipal wastewaterTreated municipal wastewaterDirect use of treated municipal wastewaterDirect use of agricultural drainage waterDesalinated water produced-million m3/yearmillion m3/yearmillion m3/yearmillion m3/yearmillion m3/yearFIGURE 2Water withdrawalTotal 658 million m3 in s19329%IRRIGATION AND DRAINAGEEvolution of irrigation developmentIrrigation potential in South Sudan is estimated at 1.5 million ha that could be brought under irrigationby smallholders and commercial farming (Table 5). This potential is divided between the Nile-Sobatriver basin (654 700 ha potential), the Western and Eastern Flood Plains (in Warrap, Unity and Jonglei
8Irrigation in Africa in figures - AQUASTAT Survey - 2015states), the Mangalla region (45 km from Juba, at the confluence of the White Nile and one of itstributaries in Central Equatoria state) and the Green Belt zone. The Green Belt zone’s agriculturalproduction usually exceeds subsistence level, so modern irrigation techniques could further increase theproduction (AfDB, 2013). However, small streams and irregular land impede large-scale irrigation(Yongo-Bure, 2007).This potential includes in particular (AfDB, 2013): lowlands where farmers make use of flooding to supplement water for growing riceareas adjacent to river floodplains, where farmers cultivate short-maturing varieties ofsorghumareas around swamps/marshes where extension of the growing season is possible byplanting in moist soils left by receding floodsIn addition, large flood plains are located in the enormous Sudd wetlands, the potential of which wasestimated at up to 1.6 million ha by itself (FAO, 1997). They, however, would require extensive works.Before the 2nd civil war broke out in 1983, the overall plan for irrigation development in Southern Sudanwas to irrigate about 270 000 ha of land (AfDB, 2013). Because of the instability, development ofirrigated agriculture was constrained, except for a few formal irrigation schemes, which wereconstructed in the 1970s as pilot agro-industrial projects. However, they have never been fullyoperational, were neglected during the periods of civil conflict and war and are largely non-functionalat present (GoSS, 2013) but there are plans to revive them (UNEP, 2007): The Melut sugar scheme: initially planned for 35 000 feddan, or 14 700 ha, of irrigatedsugarcane. In 1979-80, 42 ha were cultivated and construction of irrigation infrastructure startedin 1979, but implementation stopped before 1983. There were plans to restart it with the help ofthe pre-2011 Sudan Kenana Company in the 2010s with an initial capacity of 40 000 tons ofsugarcane, to be increased to 110 000 tons, or 50-60 percent of the South Sudan’s consumption. The Aweil rice scheme: located in the southern bank of the Lol River (Northern Bahr el Ghazal),founded in 1944 by British officials, expanded in 1976 by the government of Sudan withinternational aid, and partially rehabilitated in 2007 (FAO, 2013). At its peak in the 1980s, thescheme benefited about 1 000 tenant farmers, but it ceased operations in 1986. A rehabilitationproject encompassed an area of 4 500 ha in 2010, to be extended to 6 500 ha benefiting around2 000 households (UNMIS, 2010). In 2012, around 600 ha were planted with rice, and the areadoubled in 2013. It relies on semi-natural flood irrigation without effect on Nile volumes, sinceusing water that would otherwise evaporate, (CLICO, 2012). The Mangalla–or Mongalla–sugar and agro-industrial project: located in Central Equatoria. Itwas an experimental station established in the 1950s to grow sugarcane, but production wasshifted to the north of Sudan after 1956, under much less favourable conditions requiring heavyirrigation. The Wau fruit and vegetable canning factory: the irrigation pump had a capacity to water onlyone feddan or 0.42 hectare. The Penykou rice pilot project: located in Jonglei. Around 125 ha rice were planted in 1980-81under irrigation, with a maximum yield of 4.5tons/ha. The Upper Talanga tea project: a planned area of 500 ha was to be under tea cultivation in the1980s, including 85 ha by smallholders. Phase 1 was completed with 80 ha tea and 30 ha cereals.
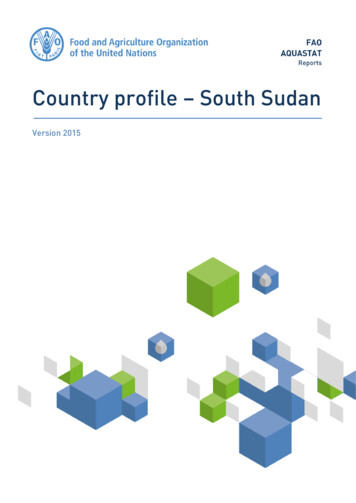
South Sudan9TABLE 5Irrigation and drainageIrrigation potential-1 500 000ha32 10018 :1. Full control irrigation: equipped area- Surface irrigation- Sprinkler irrigation- Localized irrigation Area equipped for full control irrigation actually irrigated- As % of area equipped for full control irrigation2. Equipped lowlands (wetland, ivb, flood plains, mangroves)3. Spate irrigationTotal area equipped for irrigation (1 2 3) As % of cultivated area % of area irrigated from surface water % of area irrigated from groundwater % of area irrigated from mixed surface water and groundwater % of area irrigated from non-conventional sources of water Area equipped for irrigation actually irrigated- As % of total area equipped for irrigation Average increase per year Power irrigated area as % of total area equipped for irrigation4. Non-equipped cultivated wetlands and inland valley bottoms5. Non-equipped flood recession cropping areaTotal water-managed area (1 2 3 4 5) As % of cultivated areaSize of full control irrigation schemes:201120112011201120112011201120116 00038 1001.4964-2011201124 4806419-20112011201138 1001.4Criteria:-Small schemes - haMedium schemes - ha and - halarge schemes - haTotal number of households in irrigation-hahahaIrrigated crops in full control irrigation schemes:Total irrigated grain production As % of total grain productionHarvested crops:Total harvested irrigated cropped area Temporary crops: total- Wheat- Sorghum- Millet- Maize and other cereals- Vegetables- Sunflower- Groundnut- Potatoes- Other roots and tubers- Sugarcane- Cotton- Fodder temporary Permanent crops: totalIrrigated cropping intensity (on full control area actually 201120112011201120112011metric tons%29 07029 0704 74012 6001501 1501 7703908403003001 3102 5902 Drainage - Environment:Total cultivated area drained Non-irrigated cultivated area drained Area equipped for irrigation drained- As % of total area equipped for irrigationArea salinized by irrigationArea waterlogged by irrigation
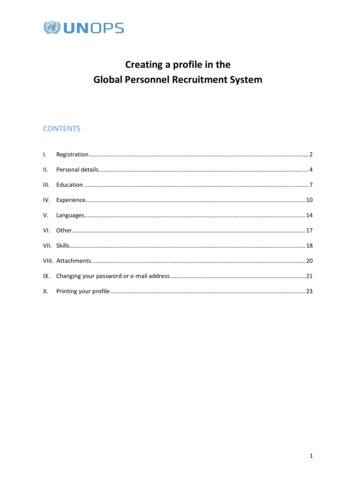
10Irrigation in Africa in figures - AQUASTAT Survey - 2015FIGURE 3Distribution of the irrigation areaTotal 38 100 ha in 2011Spate irrigation16%Full or partialcontrol irrigation84%The current area equipped for full control irrigation is only 32 100 ha: about 12 700 ha is in Upper Nile state, including the Renk scheme of about 2 000 ha in Gaiger,Magara and Abu Khadra, where cotton, sunflower and other crops are irrigated300 ha in Jonglei state and 500 ha in Western Equatoria statethe remaining 18 600 ha are small parcels of land across the country, mostly individual farmersin isolated locations with simple water-lifting techniques from rivers to support perennial fruitand vegetable productionIn addition, about 6 000 ha of spate irrigation, confined primarily to Northern Bahr el Ghazal, is usedfor rice production (Table 5 and Figure 3) (AfDB, 2013).Modern irrigation techniques, involving improved flood control measures or water pumping into gravityschemes, were introduced in the 1970s in the above listed pilot projects in order to gradually substitutetraditional flood irrigation.Role of irrigation in agricultural production, the economy and societyTraditionally in the floodplain area, irrigation is used in small vegetable gardens cultivated withadditional water from hand pumps, storage ponds, or lakeside moisture (with the help of drains). In thewet season, flood waters are diverted into rice fields, and sugarcane and banana are grown on dikesprotecting fishing camps and lowland settlements. In the dry season, along the river vegetables andtobacco are irrigated through manual and small pump-driven lift irrigation, and maize and cowpea aregrown using receding flood water. Irrigation has therefore played a critical role in traditional farmingsystems as a means to secure food supplies, especially in the drought-prone areas (GoSS, 2013).Currently, the main irrigated crops are rice, fruit trees and tree plantations (Table 5 and Figure 4). Twoharvests are possible each year in the bimodal rainfall area
country bordered by Sudan in the north, Ethiopia and Kenya in the east, Uganda and the Democratic Republic of Congo in the south, and the Central African Republic in the west. South Sudan is constituted by 10 States, corresponding to three regions of pre-2011