Transcription
IBM Power SystemsBest Practices for IBM i Performance ManagementDawn May - dmmay@us.ibm.com 2012 IBM Corporation
IBM Power SystemsPerformance Disclaimer “it depends ” Performance information and recommendations in thispresentation are based on measurements, analysis, andprojections in a controlled environment for specific performanceworkloads. Your results may vary significantly and are dependent on theapplication and configuration. This information is provided along with general recommendationsfor you to better understand system performance. Information is provided *AS IS* without warranty of any kind.2 2012 IBM Corporation
IBM Power SystemsPerformance Management Life-cycle Set Performance Objectives and Create a Baseline Collect Performance Data Real-time Monitoring Analyze Performance Data Tuning Historical Trending Capacity Planning3Revised January 9, 2003 2012 IBM Corporation
IBM Power SystemsFactors that Affect Performance User expectations Hardware capabilities and configuration Software Workload Network4 2012 IBM Corporation
IBM Power SystemsDefinitions Interactive work – Generally 5250 online transaction processing (OLTP) Batch work – non-interactive workloads Commercial Processing Workload (CPW) – Workloads which have a relativelylarge amount of I/O compared to computation Disk arms – generally one disk arm per disk drive today. More disk arms generallyresults in improved I/O performance Disk capacity – the amount of disk storage space Memory paging and faulting – the movement of data in and out of memory Wait Accounting – the ability to determine what a job is doing when it is not running5 2012 IBM Corporation
IBM Power SystemsDefinitions. Measurement - The collection of performance metrics Transaction - A basic unit of work Workload - An application that can drive load on a system Benchmark - A specific workload with specific environment settings Response Time - The average observed time to complete a transaction Utilization - The percent of time that a resource is busy Throughput - The rate at which transactions are completed Capacity - The maximum throughput of a system6 2012 IBM Corporation
IBM Power SystemsWhat is Wait Accounting? Wait accounting is the ability to determine what a job is doing when it is notrunning– When a job is not running, it is waiting– Waits may be normal, but some waits are not normal– Wait accounting can be used to determine if a wait condition is a problem IBM i has instrumented most of thewait conditions– Wait information is collected byCollection Services andJob Watcher i Exclusive!7 2012 IBM Corporation
IBM Power SystemsBasics of Waiting Two basic types of waits– Idle: waiting for a work request Typically not indicative of a problemWaiting for the “Enter” key to be pressed on a 5250 display session If a problem, usually external to the machineE.g., slow arrival of work requests due to communications problem Possible, but not typical in batch jobsE.g., waiting for an entry to be placed on a data queue– Blocked: waits that occur while performing a work requestBlocked waits are the ones we want to take a closer look at – “Outside of CPU usage and CPU queuing time, blocked waits are thereason jobs/threads take as long as they do to complete their work”http://ibmsystemsmag.blogs.com/i can/2009/11/i-can-tell-you-why-youre-waiting.html8 2012 IBM Corporation
IBM Power SystemsCreate a Baseline A baseline is the expected performance characteristics over a defined period of time– The baseline provides the data to compare with and identify changes that occur– You may need multiple baselines due to varying business periods Day-to-day operations Month-end Year-end The baseline is the reference point for– Capacity planning and trending– Identifying impacts of changes in workloads, applications, operating system, hardware9 2012 IBM Corporation
IBM Power SystemsCreate a Baseline Use Collection Services data to create the baseline The baseline can be simple or complex, depending upon the needs– Identify the metrics that are key to optimal performance Average response time Batch window Average CPU utilization Disk used percentage Number of interactive transactions10 2012 IBM Corporation
IBM Power SystemsPatterns in Performance Data Performance data typically has patterns– Daily, weekly, monthly, yearly– Understand your typical patterns– Recognize change11 2012 IBM Corporation
IBM Power SystemsCollect Performance Data Collection Services Job Watcher Disk Watcher Performance Explorer12 2012 IBM Corporation
IBM Power SystemsCollection Services Collection Services is an IBM i function that samplessystem and job level performance data IBM recommends you always run Collection Services– Collects performance data 24x7 with minimal overhead Collects data from many system resources Collects data at regular intervals from 15 seconds to 1 hour– Data initially stored in a a management collection object Can hold large quantities of performance data with minimaloverhead13 Performance data is copied into database files 2012 IBM Corporation
IBM Power SystemsJob Watcher Job Watcher returns real-time information about a selected set of jobs,threads, or LIC tasks Job Watcher collects different types of data than Collection Services, andmore frequent intervals– Job Watcher has more overhead than Collection Services Data collected by Job Watcher includes– Wait times– CPU– I/O activity– Call Stacks– SQL statements– Communications statisticsRun Job Watcher when you need detailedperformance data for diagnostic purposes.There are clients that run Job Watcher 24x7to always have diagnostic data available.– Activation Group statisticsNeed to manage the data carefully.14 2012 IBM Corporation
IBM Power SystemsDisk Watcher Disk Watcher is a performance data collector for detailed diskperformance– Near real-time diagnosis of disk performance issues V5R3 - SI24918 V5R4 - SI24919 Included in 6.1 and later– Statistical and Trace data– Data is written to DB2 filesRun Disk Watcher when you need detailedperformance data for disk I/O analysis.15 2012 IBM Corporation
IBM Power SystemsPerformance Explorer Performance Explorer help identify the causes of performance problemsthat cannot be resolved using one of the other performance datacollectors– Collects more detailed information about a specific application, program, orresource Performance Explorer is typically used for two main reasons:– Detailed performance trace data is needed to identify the performanceproblem– Analyzing the performance of applications16 2012 IBM Corporation
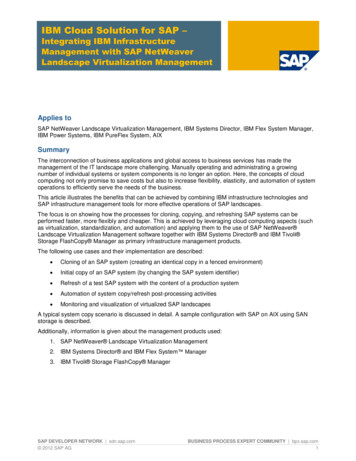
IBM Power SystemsPerformance Data Collectors - PositioningCollectionServices Sample data Collected every15 minutes(default) No informationconcerningspecific I/OoperationsLessdetail17DiskWatcher Statistics as wellas Trace data Focus on diskdataJobWatcherPerformanceExplorer (PEX) Sample data Trace data Support for verysmall intervals Informationcollected forevery I/O event Focus on job data Call Stacks SQL Statements Wait buckets Collection andanalysiscomplexmoredetail 2012 IBM Corporation
IBM Power SystemsPerformance Data Management Collection Services will automatically expire data – but you should keep importantcollections for comparison– Past seven to ten days Keeping the management collection objects is more important than the DB2 files– Key time periods & events, such as end-of-month or end-of-year processing, baseline priorto installing a new release Copy collection management objects to a separate library to prevent them from beingautomatically expired Review your Collection Services collection interval– Default is 15 minutes– Smaller intervals more data Review your Collection Services cycle interval– Default is once daily at midnight– Select a time that will have minimal impact on critical business functions18 2012 IBM Corporation
IBM Power SystemsPerformance Data ManagementStore data centrally if you have multiple physical or logical partitions– Easier to analyze and backup– Resource-intensive analysis won’t impact production partitions Copy Performance Collection (CPYPFRCOL) Save Performance Collection (SAVPFRCOL) Restore Performance Collection (RSTPFRCOL) Graphical interface as well Keep some data online– Respond quickly to reports of poor or degrading performance– Can be on partition it was created on or centralized partition Back up key performance data as you would business data19 2012 IBM Corporation
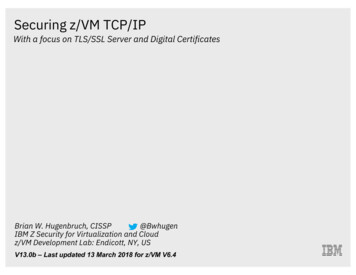
IBM Power SystemsuiteSrotciDocherIBM i Performance Toolst Job Wa yzeral PEX An lyzerna Heap A PDVGr P eene S rform ScreyPMforPower B stem ance ena P tch M com Tooerflorm ode mand s Reposan lrtsceExpl orerSystemsWLEnMa20entmagePTDVSystr altnCeeDcnarmPerfo igatortInvesCollectionServices Pe em D rf To i NaoBv Ac /SQL ls GU igator Sy tive J Mon Iste obs itormStatusataThirdJob WatcherDisk WatcherPartyToolsWeTra b Perfns a or mctioan P nce Aerfo dvirma sorncePerformanceExplorer 2012 IBM Corporation
IBM Power SystemsQuick Review of Performance Tools Interfaces 5250 session– CL Commands– Performance menus and reports System i Navigator– Windows client application - aka, iSeries Navigator, Operations Navigator, Navigator for i Collection Services Management Central Monitors Monitors – Real-time Monitoring Graph History – Observer performance metrics over several months Performance Tools plug-in – Basic trend and performance analysis IBM Systems Director Navigator for i– “Web Console” for much of what was originally in System i Navigator– Performance Tasks: Performance Data Investigator, Collections, other performance tasks– Performance Data Investigator: Health Indicators – High level overview of key resources utilization metrics Collection Services – Basic trend and performance analysis Job Watcher – Job-related performance analysis Performance Explorer – Trace the flow of work in an application21http://ibmsystemsmag.blogs.com/i s-that-navigate-the-use-of-director.html 2012 IBM Corporationhttp://ibmsystemsmag.blogs.com/i age-54-systems.htm
IBM Power SystemsTools and Usage IBM Systems Director––––Web-based interfaceSupport for multiple systems and groupsSystem health and high-level monitoringActive Energy Manager extension PM for Power Systems– Web-based interface– Current and long-term trend analysis Workload Estimator– Web-based interface– Used to size a new partition, an upgrade, or a consolidation of several partitions iDoctor suite– Windows client application– Detailed performance analysis and diagnostics22 2012 IBM Corporation
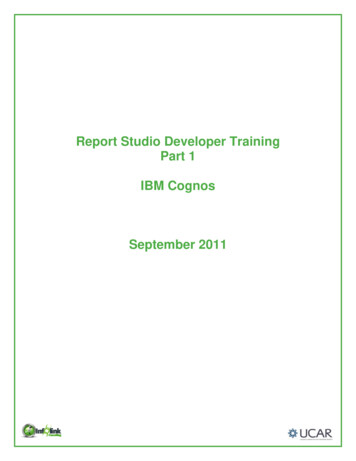
IBM Power SystemsRelationship Between Collectors And Consumers23 2012 IBM Corporation
IBM Power SystemsReal-time Monitoring Real-time monitoring is essential for pro-active performance management– Identify and correct potential issues before they become real problems– Automated monitoring and notification Several tools available for real-time monitoring:– Watches– CL Commands– IBM Systems Director Navigator for i– Management Central Monitors– IBM Systems Director– Tivoli Monitoring24 2012 IBM Corporation
IBM Power SystemsWatches Watches provide a programmatic interface to be notified when thefollowing occur:– Message– Licensed Internal Code Log (LIC Log)– Problem Activity Log Entry (PAL entry) Start Watch (STRWCH) command or API (QSCSWCH) End Watch (ENDWCH) command or API (QSCEWCH) When the condition being watched occurs, your program gets control andyou can take any action you wanthttp://ibmsystemsmag.blogs.com/i .html25 2012 IBM Corporation
IBM Power SystemsCL Commands Commands can be used for real-time performance monitoring– Work with Active Jobs (WRKACTJOB)– Work with Disk Status (WRKDSKSTS)– Work with System Status (WRKSYSSTS)– Work with System Activity (WRKSYSACT)– Work with Shared Storage Pools (WRKSHRPOOL)– These commands are sampling based Enter the command Allow the system to collect data for a minimum of 5 minutes Refresh (F5) the display to see the performance data Restart (F10) will restart the elapsed time counter26 2012 IBM Corporation
IBM Power SystemsIBM Systems Director Navigator for iRecommended starting points for monitoring Graphical User Interface views of– System Status– Disk Status– Active Jobs Health Indicators– Graphical view of general healthbased upon Collection Services data 27System ResourcesCPUDiskMemoryResponse Time 2012 IBM Corporation
IBM Power SystemsIBM Systems Director Navigator for i - Thresholds IBM-supplied defaults for threshold levels on health indicators– Can be customized for your requirements With Design Mode, Edit View, thresholds can be added to any chart28 2012 IBM Corporation
IBM Power SystemsManagement Central Monitors Management Central Monitors are part of the System i Navigator– They do not exist in the Director Navigator Web console For performance management, use the System Monitors– Provide real-time performance of multiple partitions– Performance metrics CPU Utilization Disk Utilization Faulting Etc.– Thresholds can be defined forautomated notification– Graph History allows you to see thedata over an extended period of time– System monitors use Collection Services for the performance data29 2012 IBM Corporation
IBM Power SystemsIBM Systems Director IBM Systems Director isgeared toward managingand monitoring a morecomplex environment– With Systems Director youcan manage IBM i at 5.4and later releases– Systems Director isintegrated with SystemsDirector Navigator to 'drilldown' into IBM i specifictasks30 2012 IBM Corporation
IBM Power SystemsSystems Director:Focus on Health, Status, Automation Health summary– Favorite systems– Critical monitors– Group thumbnails Monitoring––––Monitor resourcesThresholdsEventsUpdate Compliance Automation Plans– Notify– Run commands– Trigger tasks31 2012 IBM Corporation
IBM Power SystemsIBM Tivoli Monitoring Enterprise-level monitoring and automation is accomplished with IBMTivoli Monitoring– Predefined or customized situations– Policies for automation– Monitoring agent for IBM i provides a wealth of information that can be monitored Operating system CPU Disk Network Virtual and physical memory Paging information. and much, much more32 2012 IBM Corporation
IBM Power SystemsAnalyze Performance Data Start with Collection Services data.– Whether investigating a reported problem, monitoring how your system is running,or looking for improvement candidates, it can help– Use it to understand resource usage, what is or is not being used, how did itchange, when did it happen, what is affected etc. Basically scope the problem Where to start– Health Indicators perspectives - Are any resources constrained?– Collection Services perspectives: CPU Utilization and Waits OverviewAny periods of high CPU or wait time?Does any type of wait stand out? CPU utilization by Thread or Task – See who is using CPU time. Resource Utilization Overview – time based comparison of disk busy, physical I/O,faulting, CPU, logical DB I/O and 5250 transactions. Does anything stand out here? Use drill downs and other perspectives based on what you found above andwant to investigate further.33 2012 IBM Corporation
IBM Power SystemsAnalyze Performance Data (continued) Using the Collection Services data you should know what you need toinvestigate further– excessive CPU consumption, locking issues, disk utilization, – when it happened– what resources were involved (jobs, disk units, .) Collection Services cannot tell you details like what programs, instructions wererunning, objects, files, records, SQL statements being used, who is holdinglocks and who is waiting You need to use tools like Job watcher, Disk Watcher and/or PEX for this indepth information.– Based on the Collection Services information you can focus these tools to collectonly the data you need.– Generally, Job Watcher is used when you cannot identify the root cause withCollection Services 2012 IBM Corporation
IBM Power SystemsMemory Rules of thumb – starting point from which you can fine tune to determineappropriate thresholds for your environment Memory– Faulting is normal and expected– How much is too much? Generally – 100 per second * CPU Utilization % by pool * Processor Units (100 * (CPU utilization by pool / 100)) * number of processors)– PRTSYSRPT TYPE(*POOL) to get the needed metrics– Use the Performance Adjustor if your workloads are slow to change E.g., Daytime versus over night Rapidly changing workloads are not well suited for the Performance Adjustor– QPFRADJ– Automatically manages the shared memory pools without any user interaction35 2012 IBM Corporation
IBM Power SystemsMemory - Pool Faulting Guidelines Machine Pool Faulting Guidelines– The machine pool faulting rate should be less than 10/faults per second– Disk utilization should be less than 40%– IOP utilization should be less than 60% User Pool Faulting Guidelines– Paging guidelines no longer published Track response time, throughput, and CPU utilization against the faultingrates to determine a reasonable faulting rate Determine how much the faulting is affecting the interactive response time orbatch throughput. Data is available with PRTSYSRPT36 2012 IBM Corporation
IBM Power SystemsTuning Make the most efficient use of the system's resources– Iterative: measure, analyze, adjust Basic strategy– Set up initial tuning values– Measure: observe system performance with these tools WRKSYSSTS WRKDSKSTS WRKSYSACT WRKACTJOB– Analyze: review values, compare with performance goals Interactive throughput and response time Batch throughput for active batch jobs» Auxilliary input/output (AuxIO)» CPU percentage (CPU%)– Adjust: if performance does not meet expectations, tune system based on new data Measure and compare all key performance measurements Analyze and evaluate adjustments one at a time Review performance37 2012 IBM Corporation
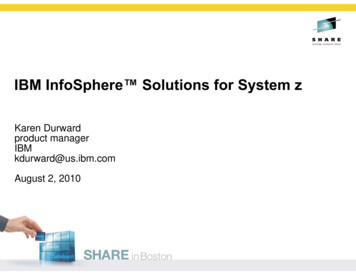
IBM Power SystemsTuning, continued General tips:– Let the system tune itself automatically (IBM recommended) Set system value QPFRADJ to 2» Performance adjustment at IPL and automatically– Work with Shared Pools – WRKSHRPOOL Allows additional control over automatic adjustment of pools based onfaulting and size parametersWork with Shared PoolsSystem:Main storage size (M). :MYSYSTEM4051.50Type changes (if allowed), press efinedSize (M)800.002536.01715.22.25.00MaxActive 60117010AllocatedSize (M)800.002536.01715.23.25PoolID1234-Paging Option-Defined FIXED*FIXED 2012 IBM Corporation
IBM Power SystemsTuning – Work with Shared Pools Tune the Tuner– You can tune the values to influence the behavior of the performance adjusterWork with Shared PoolsSystem:Main storage size (M). :ISZ1LP134051.50Type changes (if allowed), press 1112222222-----Size %----Minimum -Minimum Thread 10010.002.0010010.002.00100More.39 2012 IBM Corporation
IBM Power SystemsTuning – Pool Properties via Director NavigatorYou can also do memory pool tuning through the GUI40 2012 IBM Corporation
IBM Power SystemsTuning, continued General tips:– If QPFRADJ 0 (off) use WRKSYSSTS to manually adjust pools and activitylevels Minimize wait-to-ineligible transitions in interactive pools 10% of active-to-waits Increase MAXACT by 5 or 10 to reduce wait-to-ineligible transitions Repeat until they are less than 10% of the active-to-wait Tune faulting in user pools Sum of faults for all user pools should be less than the number of processors times theprocessors percent busy Example: four processors running at 50% busy Get faults to less than 200 faults/seconds (4 * 50)41 2012 IBM Corporation
IBM Power SystemsTuning, continued.– Favor output over input so existing jobs are not adversely impacted– Do not mix different types of jobs and priorities in the same pool Remove batch jobs from *BASE by creating another batch pool Route batch jobs to *SHRPOOL1 One batch job to a pool is ideal. This can be done by modifying the job descriptionfor the routing data, and the subsystem description for the routing entry– On a shared production/development partition Create a second interactive pool *SHRPOOL2 for programmers Change programmers' job description routing data and subsystem descriptionrouting entries so their jobs run in SHRPOOL242 2012 IBM Corporation
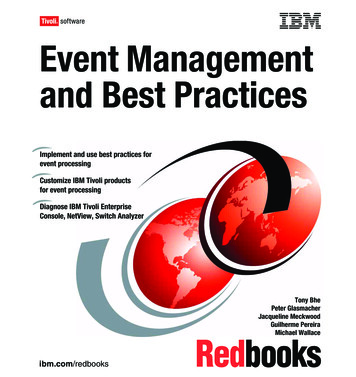
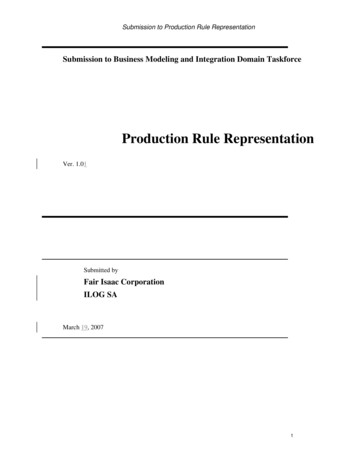
IBM Power SystemsTuning . Work With System StatusWork with System Status% CPU used . . . . . . . :Elapsed time . . . . . . :1.600:02:47Jobs in system . . . . . :% perm addresses . . . . :% temp addresses . . . . :1013.022.059SysPool1234PoolSize M800.002536.01715.23.25ReservedSize M274.012.51 .01.00MaxAct 601170104/22/10System ASP . . . . . . . :% system ASP used . . . :MYSYSTEM10:15:01246.6 G70.2142Total aux stg . . . . . :Current unprotect used . :Maximum unprotect . . . :----DB----Fault Pages.0.0.3.8.0.0.0.0--Non-DB--Fault Pages.0.01.1 46.6 G8297 M9656 MActInel.0.0.0.0Increase pool size to reduce faultingIncrease max activity to reduce ineligibles43 2012 IBM Corporation
IBM Power SystemsHistorical Trending Performance Management for Power Systems is an IBM offering thatprovides a historical view of performance– Send your performance data to IBM– IBM will store up to two years of performance data You can use the supplied graphs to view the trends of key performance metrics– Performance data sent to IBM can later be used to size your next upgrade Graph History– Graph History allows you to see that performance data over time. 7 days if you are not collecting performance data with PM One year if you are collecting performance data with PM44 2012 IBM Corporation
IBM Power SystemsPM for Power /perfmgmt/45 2012 IBM Corporation
IBM Power SystemsCapacity Planning Goal of capacity planning is to make your system most efficient with regard to Utilizing resources Fulfilling user requests IBM Systems Workload Estimator (WLE) is the IBM tool for capacity planning Submit input from the PM for Power Systems data Select a specific workload to size from the Performance Data Investigator Manual input Use WLE to: Size a new system Size an upgrade Size a consolidation of several systems WLE provides current and growth recommendations for Processor Memory Disk46 2012 IBM Corporation
IBM Power SystemsCapacity Planning Cycle Review current performance Select representative data– Is the data variable due to business cycle or seasonal economic conditions? Identify seasonal processing peaks– Are there peaks within peaks? Eliminate exceptional and unusual conditions Estimation– Gather realistic projects of the business factors that affect performance– Focus on how the business factors will cause changes in the workload– Account for pent up demand– Using a sizing tool such as the Workload Estimator47 2012 IBM Corporation
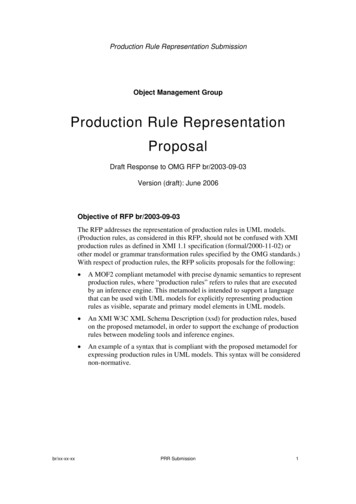
IBM Power SystemsIBM Systems Workload Estimator (WLE) Size Next Upgrade action from Performance Data InvestigatorFrom IBM Systems Director Navigator for i - Performance - Investigate Data - Displayperspective, select the timeframe you want to sizewith WLE.Then select Action- Size Next Upgrade48 2012 IBM Corporation
IBM Power SystemsIBM Systems Workload Estimator (WLE)49 2012 IBM Corporation
IBM Power SystemsWLE – Workload Definition PanelDefinition page PDI WorkloadDefinition 2012 IBM Corporation
IBM Power SystemsWLE – Selected SystemSelection System Tab:Immediate Solution andGrowth Solution areshownPhysical systems capableto support themeasured workload 2012 IBM Corporation
IBM Power SystemsCPU Considerations CPU Utilization Guidelines depend upon the number of processors defined to thepartition– 50% 1-way– 70% 2-way– 85% 8-way– 90% 32-way for high-priority for work, not considering lower-priority batch jobs 2012 IBM Corporation
IBM Power SystemsUnderstanding “Time Dispatched on a CPU”Time dispatched on a CPU (Wait Bucket 1)– Thread or task has been assigned to a processor and is NOT waiting– Complicated by certain features Hardware Multi Threading (HMT) Allows multiple threads/tasks to be assigned to a single physical processorCauses bucket 1 time to be greater than actual CPU time Background assisting tasks Promote their CPU usage back into the client job/threadCauses client thread’s bucket 1 time to be smaller than measured CPU time LPAR shared/partial processors Bucket 1 records time dispatched to the virtual processorBucket 1 time may be greater than CPU time because it may include time thethread/task is waiting for the physical processor behind the virtual processorWait Bucket 1 does NOT equal CPU Time53 2012 IBM Corporation
IBM Power SystemsUnderstanding “CPU Queuing”CPU Queuing (Wait Bucket 2)– Thread or task has been assigned to a processor and is waiting for theCPU to become available Too much work on the partition causing threads to need to wait for theprocessorsSpikey workloads Shared processorsLatency due to hypervisor is sharing the physical processors amongmultiple partitions54 2012 IBM Corporation
IBM Power SystemsDisk Response Time Disk Response Time may be the most important component in overall systemperformance in today's system– Very fast processor technology, while disk performance has not yet made as muchprogress Solid State Devices will have some impact here Rules of thumb for categories: Good: Average response time less than 5 milliseconds Normal: Average response time between 5 and 10 milliseconds Requires analysis: anything over 10 milliseconds Alternatively - Establish disk response time objectives for a given application This becomes your benchmark Dividing the total disk response time per transaction by the average number of synchronousdisk I/Os per transaction Online Transaction Processing (OLTP) objectives will vary from batch processing because itmay be more disk I/O intensive55http://ibmsystemsmag.blogs.com/i l 2012 IBM Corporation
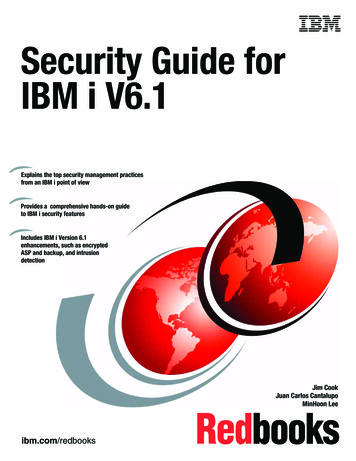
IBM Power SystemsDisk Response Time Groups Disk Response Time Groups were added in 6.1, enhanced in 7.1– Response time measured at the I/O Device Driver level– Counts are incremented in the appropriate response time group– Can get a histogram of the disk response times and easily identify if you haveslow disk operations– 7.1 Time is in microseconds instead of milliseconds Read and write times into separate groups Data is stored in separate file, QAPMDISKRB56 2012 IBM Corporation
IBM Power SystemsDisk Response Time Groups - s3:16ms4:64ms5: 256ms6: 1ms; 16ms; 64ms; 256ms; 1,024ms; eRangeRangeRange1:0 15us;2:15us 250us;3:250us 1,000us;4:1,000us 4,000us;5:4,000us 8,000us;6:8,000us 16,000us;7:16,000us 64,000us;8:64,000us 256,000us;9: 256,000us 500,000us;10: 500,000us 1,024,000us;11: 1,024,000us; 2012 IBM Corporation
IBM Power SystemsPerformance Data Investigator:Disk Response Time Charts 2012 IBM Corporation
IBM Power SystemsDisk Percent Busy Disk Percent Busy Disk Percent Busy is not equal to Disk Utilization A disk may be 100% busy and still be able to perform additional disk operations Arbitrary: Acceptable response times can be achieved at up to 70% IBM Workload Estimator uses a conservative guideline of 25% OLTP environments are much more sensitive to variations in disk response time Batch-oriented workloads may be able to tolerate higher disk utilizations (than 25%) Other batch jobs can be time sensitive High disk utilization may indicate a need to inspect the disk response time Disk Storage ASP percentage on WRKSYSSTS (% system ASP used) should be less than 80%59 2012 IBM Corporation
IBM Power SystemsKey Performance Indicators Performance Indicators gauge how well a system is performing over time Key Performance Indicators (KPIs) A selection of metrics that make sense to your business Easily measured Track over time to determine if they are static, increasing or decreasing Track against predefined thresholds Two recommended categories: Hardware resource utilization Throughput60 2012 IBM Corporation
IBM Power SystemsHardware Resource Utilization & Throughput Hardware Resource Utilization Total CPU Utilization CPU usage by job priority (batch & interactive) Memory faults per second by memory pool (database & non-database) Disk (arm utilization, response time, wait time, space utilization) Throughput A business transaction varies per business An application can be built to capture these metrics and collect them such as is doneby Collection Services. IBM i defined metrics for components that typically make up a business transaction: OLTP transactions (5250 and/or HTTP) per hour (peak & average) Average response time per transaction CPU usage per transaction Disk I/O per transaction Elapsed time of batch jobs61 2012 IBM Corporation
IBM Power g247808.pdfSee this Redbookspublication for completecoverage of IBM iPerformanceManagement BestPractices.Based upon the 6.1release and the October2009 update to thePerformance DataInves
IBM Systems Director Navigator for i – “Web Console” for much of what was originally in System i Navigator – Performance Tasks: Performance Data Investigator, Collections, other performance tasks – Performance Data Investigator: Health Indicators –