Transcription
Chapter 5:Errors in Chemical AnalysesSource:
Measurements invariably involve errors and uncertainties. it is impossible to perform a chemical analysis that is totally free of errors oruncertainties We can only hope to minimize errors and estimate their size with acceptableaccuracy Errors are caused by faulty calibrations or standardizations or by randomvariations and uncertainties in results. Frequent calibrations, standardizations, and analyses of known samples cansometimes be used to lessen all but the random errors and uncertainties.The term error has two slightly different meanings.1) error refers to the difference between a measured value and the “true”or “known” value.2) error often denotes the estimated uncertainty in a measurement orexperiment.“ We can only hope to minimize errors and estimate their size with acceptableaccuracy”
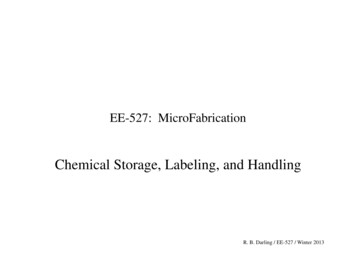
Every measurement is influenced by many uncertainties, which combine toproduce a scatter of results.Figure 5-1 Results from sixreplicate determinations of iron inaqueous samples of a standardsolution containing 20.0 ppmiron(III). Note that the results rangefrom a low of 19.4 ppm to a high of20.3 ppm of iron. The average, ormean value, x , of the data is 19.78ppm, which rounds to 19.8 ppmBecause measurement uncertainties can never be completely eliminated,measurement data can only give us an estimate of the “true” value.However, the probable magnitude of the error in a measurement can often beevaluated. It is then possible to define limits within which the true value of ameasured quantity lies with a given level of probability.Before beginning an analysis ask, “What maximum error can be tolerated in theresult?”The answer to this question often determines the method chosen and the timerequired to complete the analysis.
5A Some important termsTo improve the reliability and to obtain information about the variability ofresults, two to five portions (replicates) of a sample are usually carriedthrough an entire analytical procedure.Replicates are samples of about the same size that are carried through ananalysis in exactly the same way. Individual results from a set of measurements are seldom the same Usually, the “best” estimate is considered to be the central value for the set. The central value of a set should be more reliable than any of the individualresults. Usually, the mean or the median is used as the central value for a set ofreplicate measurements.An analysis of the variation in the data allows us to estimate the uncertaintyassociated with the central value.
The Mean and the MedianThe mean, also called the arithmetic mean or the average, is obtainedby dividing the sum of replicate measurements by the number ofmeasurements in the set:Nx xi 1iN The symbol xi means to add all of the values xi for the replicates; xi represents theindividual values of x making up the set of N replicate measurements. The median is the middle value in a set of data that has been arranged in numericalorder. The median is used advantageously when a set of data contain an outlier. An outlier is aresult that differs significantly from others in the set. An outlier can have a significant effect on the mean of the set but has no effect on themedian.
Precision* Precision describes the agreement among several results obtained in the sameway. Describes the reproducibility of measurements.* Precision is readily determined by simply repeating the measurement onreplicate samples.* Precision of a set of replicate data may be expressed as standard deviation,variance, and coefficient of variation.* di, deviation from mean, is how much xi, the individual result, deviates from themean.d x xiiAccuracy Accuracy indicates the closeness of the measurement to the true or acceptedvalue and is expressed by the error. Accuracy measures agreement between a result and the accepted value. Accuracy is often more difficult to determine because the true value is usuallyunknown. An accepted value must be used instead. Accuracy is expressed in terms of either absolute or relative error.
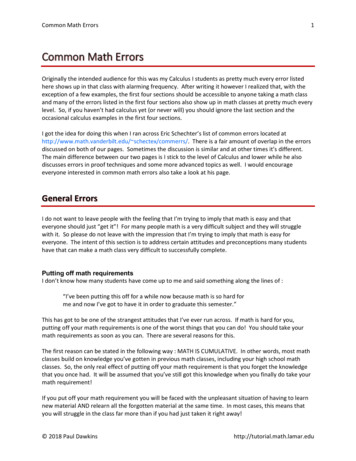
Figure 5-2 Note that we can have very precise results (upper right) with amean that is not accurate and an accurate mean (lower left) with datapoints that are imprecise.
Absolute Error* The absolute error of a measurement is the difference between the measuredvalue and the true value. If the measurement result is low, the sign is negative; ifthe measurement result is high, the sign is positive.E xi xtRelative ErrorThe relative error of a measurement is the absolute error divided by the truevalue.Relative error may be expressed in percent, parts per thousand, or parts permillion, depending on the magnitude of the result.xi xtEr 100%xt
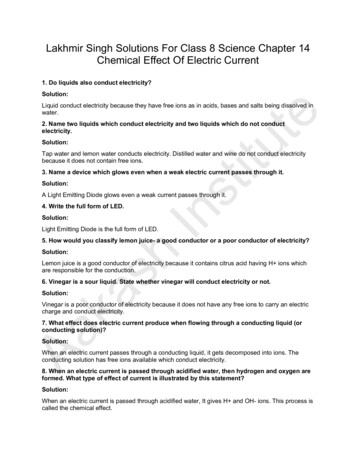
Types of Errors in Experimental Data Results can be precise without being accurate and accurate without being precise. Each dot represents the error associated with a single determination. Each vertical line labeled (xi - xt) is the absolute average deviation of the set fromthe true value.Figure 5-3 Absolute error in the micro-Kjeldahl determination of nitrogen.
Chemical analyses are affected by at least two types of errors:1.2.Systematic (or determinate) error, causes the mean of a data set to differfrom the accepted value.Random (or indeterminate) error, causes data to be scattered more orless symmetrically around a mean value.A third type of error is gross error. These differ from indeterminate and determinate errors. They usually occur only occasionally, are often large, and may cause aresult to be either high or low. They are often the product of human errors. Gross errors lead to outliers, results that appear to differ markedly fromall other data in a set of replicate measurements.
5B Systematic errors Systematic errors have a definite value, an assignable cause, and are of the same magnitude for replicate measurements made in the sameway. They lead to bias in measurement results.There are three types of systematic errors: Instrumental errors. Method errors Personal errors
Instrumental Errors are caused by nonideal instrument behavior, by faulty calibrations, or byuse under inappropriate conditions Pipets, burets, and volumetric flasks may hold or deliver volumes slightlydifferent from those indicated by their graduations. Calibration eliminates most systematic errors of this type. Electronic instruments can be influenced by noise, temperature, pH andare also subject to systematic errors. Errors of these types usually are detectable and correctable.
Method Errors The nonideal chemical or physical behavior of the reagents and reactionson which an analysis is based often introduce systematic method errors. Such sources of nonideality include the slowness of some reactions, theincompleteness of others, theinstability of some species, the lack ofspecificity of most reagents, and the possible occurrence of side reactions thatinterfere with the measurement process. Errors inherent in a method are often difficult to detect and hence, theseerrors are usually the most difficult to identify and correct.
Personal Errors result from the carelessness, inattention, or personal limitations of the experimenter. Many measurements require personal judgments. Examples include estimating the position of a pointer between two scale divisions, thecolor of a solution at the end point in a titration, or the level of a liquid with respect to agraduation in a pipet or buret. Judgments of this type are often subject to systematic, unidirectional errors. A universal source of personal error is prejudice, or bias. Number bias is another source of personal error that varies considerably fromperson to person. The most frequent number bias encountered in estimating the position of a needleon a scale involves a preference for the digits 0 and 5. Also common is a prejudice favoring small digits over large and even numbers overodd. Digital and computer displays on ph meters, laboratory balances, and otherelectronic instruments eliminate number bias because no judgment is involved intaking a reading.
5B-2 The Effect of Systematic Errors on Analytical Results Systematic errors may be either constant or proportional. Constant Errors The magnitude of a constant error stays essentially the same as the size of thequantity measured is varied. With constant errors, the absolute error is constant with sample size, but therelative error varies when the sample size is changed One way of reducing the effect of constant error is to increase the sample sizeuntil the error is acceptable. The excess of reagent needed to bring about a color change during a titrationis another example of constant error. This volume, usually small, remains the same regardless of the total volume ofreagent required for the titration. Again, the relative error from this source becomesmore serious as the total volume decreases. One way of reducing the effect of constant error is to increase the sample size
Proportional Errors Proportional errors decrease or increase in proportion to the size of the sample. A common cause of proportional errors is the presence of interfering contaminants inthe sample. For example, a widely used method for the determination of copper is based on thereaction of copper(II) ion with potassium iodide to give iodine. The quantity of iodine isthen measured and is proportional to the amount of copper. Iron(III), if present, alsoliberates iodine from potassium iodide. Unless steps are taken to prevent thisinterference, high results are observed for the percentage of copper because the iodineproduced will be a measure of the copper(II) and iron(III) in the sample. The size of this error is fixed by the fraction of iron contamination, which isindependent of the size of sample taken. If the sample size is doubled, for example, theamount of iodine liberated by both the copper and the iron contaminant is alsodoubled. Thus, the magnitude of the reported percentage of copper is independent ofsample size.slideplayer.com/Fundamentals ofAnalytical Chemistry, F.J. Holler,S.R.Crouch
5B-3 Detection and Elimination of Systematic (Instrumentaland Personal) Errors1.2.3.4.Periodic calibration of equipment is always desirable because the response ofmost instruments changes with time as a result of component aging,corrosion, or mistreatment.Most personal errors can be minimized by careful, disciplined laboratory work.It is a good habit to check instrument readings, notebook entries, andcalculations systematically.Errors due to limitations of the experimenter can usually be avoided bycarefully choosing the analytical method or using an automated procedure.5B-4 Detection of Systematic (Method) Errors Bias in an analytical method is particularly difficult to detect. The best way to estimate the bias of an analytical method is by analyzing Standardreference materials (SRMs).
Analysis of Standard Samples The overall composition of a synthetic standard material must closelyapproximate the composition of the samples to be analyzed. Great care must be taken to ensure that the concentration of analyte isknown exactly. A synthetic standard may not reveal unexpected interferences so that theaccuracy of determinations may not be known.
Independent Analysis- If standard samples are not available, a second independent and reliableanalytical method can be used in parallel.- The independent method should differ as much as possible from the oneunder study.- This practice minimizes the possibility that some common factor in thesample has the same effect on both methods.- Again, a statistical test must be used to determine whether any difference isa result of random errors in the two methods or due to bias in the methodunder study.
Blank Determinations A blank contains the reagents and solvents used in a determination, but no analyte. Often, many of the sample constituents are added to simulate the analyte environment,which is called the sample matrix. In a blank determination, all steps of the analysis are performed on the blank material.The results are then applied as a correction to the sample measurements. Blank determinations reveal errors due to interfering contaminants from the reagentsand vessels employed in the analysis. Blanks are also used to correct titration data for the volume of reagent needed to causean indicator to change color.Variation in Sample SizeAs the size of a measurement increases, the effect of a constant error decreases.Thus, constant errors can often be detected by varying the sample size.
Suggested Problems 5.1, 5.3, 5.11, 5.12(a-d-f), 5.13(a-b-c)
Analytical Chemistry, F.J. Holler, S.R.Crouch Proportional Errors Proportional errors decrease or increase in proportion to the size of the sample. A common cause of proportional errors is the presence of interfering contaminants in the sample. For example, a widely us