Transcription
The question has arisen several times . . . .What exactly is LINEAR UNMIXING?HOW DOES THIS WORK?Linear Unmixing is a mathematical technique commonly used for thedecomposition of chemical elements in an unknown by analyzing thespectral makeup relative to a library of standards. Likewise it isapplied to the analysis of lansat images to determine crop or landscapecomposition.In the art of confocal microscopy it is now applied to thedecomposition of fluorescent components in an unknown.Explanation #1 – conceptual understandingConsider the small child trying to insert odd shaped pegs intoa board of odd shaped holes.It is quite easy for even a small child to figure out that a roundpeg will go into a round hole without even understanding what‘round’ means. Recognition is so easy because the holes are sodifferent we can quickly determine that the round peg goes intothe round hole.
On the other hand consider the task of inserting a round peg intoone of the following holes?Not so Easy!!!!!!!!!!This requires that you try every possibility to find the best fit!OR – if you want to be very ANALytical – you take severalmeasurements of each hole and compare those measurements tomeasurements of your peg. You might measure the radial diameter atsay maybe 32 different angles. This gives you a lot of data tocompare, but once you are done you surely will find the best hole toput you peg in.Note: it takes very little deviation to the shape of the hole and thepeg to return to a ‘no brainer’ situation’. Consider . . . . .Very subtle differences can make our comparison a very easy jobagain.
Explanation #2 – conceptual understanding for grown upsThe same idea of pegs and holes can be applied to determining whichof 2 reference spectral curves is the best fit for an unknown spectralcurve.Ref #1Ref #21.510.50-0.5-1-1.5UnknownIf you compare or fit the Unknown to the reference spectra you quickly determinethat the best fit is Ref #1. It just looks right.
What you are doing is a fast mathematical calculation of best fit.This becomes much more difficult when the Unknown can be acombination of BOTH of the reference spectra. Consider this unknown. . . .You stand little chance of determining how much of Ref #1 and howmuch of Ref #2 is in this unknown spectrum without the aid of acomputer.We just happen to have a computer, and FYI this unknown is a perfectcombination of 50% Ref #1 and 50% Ref #2.And just like the peg and hole analogy, a subtle difference in thecharacteristics of the curves make the identification much easier. Soeven if the reference curves look very similar it take only the slightestdifference to trigger an easy match. But, subtle difference or not, acomputer can unmix these mathematical mixtures very fast and veryeasy.
Explanation #3 – Mathematical understandingConsider the measured spectrum of a single pixel in a sampleknown to contain only CFP and YFP, we can represent themeasured fluorescence to be a combination of the 2 components:S(?) A1CFP(?) A2 YFP(?)S(?) the measured spectra at a given point an array ofup to 32 elements to represent the 32 wavelengthsranges from the META detector.C,Y our previously measured reference spectra with thesame 32 elementsA1, A2 are the constants we need to solve for– that is - the % of each component at the given pixelThe way we do the comparison between the unknown and thereference spectra is to calculate simultaneously all the differenceequations of the unknown minus the 2 reference curves for allvalues of A1 and A2. We solve for the minimum value of thesesimultaneous equations – that is what values for A1 and A2 makethis result a minimum.S(?) – A1CFP(?) - A2YFP(?) min.To find the best fit (the smallest difference) we do a leastsquares fit. That is we create a function that is the square ofthis equation and then solve for the minima.S i [S(?i) – [A1CFP(?i) A2YFP(?i)]2[It is important to note that before any of these calculations aremade the reference and measured curves are normalized so as toremove any influence from the intensity of each point. We look onlyat the relative shapes of the curves!]
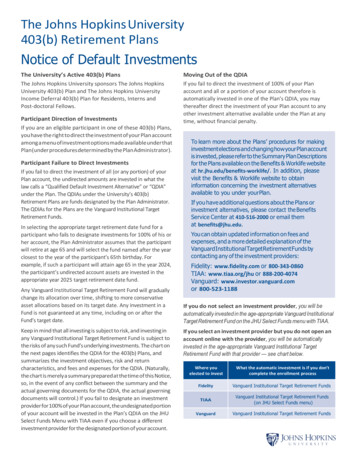
To solve this equation we use Linear Algebra since S, C, and Yare arrays with up to 32 elements.Linear Algebra* is designed to solve simultaneously multipleequations with multiple variables - in our case we try to solve asmany as 32 equations in 8 unknowns. (FYI - CFP and YFP with 12PMT channels would be 12 equations with 2 unknowns)A2The least squares function above will have a shape something likethisA1All we need to do is find the point where this function reaches itsminimum – that is the difference between the measured spectraand the 2 reference curves is at its minimum – and you havefound the best fit.*While linear algebra is a rather simple and very fast tool, it does require some mathematicalbackground knowledge (basic algebra, calculus, abstract algebra, vectors, etc. . ) to understandhow the linear algebraic tools are derived and applied. We won’t discuss that here – you willhave to refer to ‘Linear Algebra for dummies’ for that understanding.
Once you have calculated the best values for A1 and A2 you havedetermined the concentration or % of each component (CFP andYFP), which exists in the measured pixel.Multiply A1 times the total intensity of the original pixel and putit in output image C and multiply A2 times the total intensity ofthe pixel and put it in output image Y. Repeat this over theentire image and you have successfully used linear unmixing toseparate out the components of the entire image.SUMMARY (easiest verbal explanation): Wecalculate the minimum difference between theunknown spectra and the reference spectra for allpossible mixtures of the reference spectra. Sincewe only solve for the minimum value of thisdifference equation the calculation isstraightforward and FAST.
Explanation #4 – visual understanding – seeing is believingGFP and FITC (Distance of emission peaks 7nm)Cultured fibroblasts expressing a GFP-Histone2B fusion protein,actin filaments stained with FITC-phalloidinThrough theeyepieces!
Reference SpectraFITCGFP
UNMIXED RESULT
(FYI - CFP and YFP with 12 PMT channels would be 12 equations with 2 unknowns) The least squares function above will have a shape something like . have to refer to ‘Linear Algebra for dummies’ for that understanding. Once you have calculated the best values for A1 and A2 you have determined the conce