Transcription
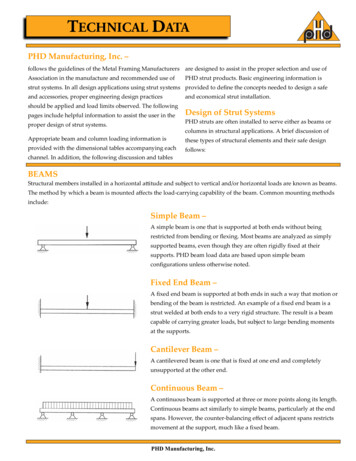
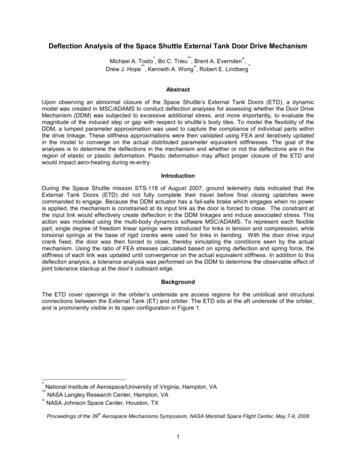
Deflection Analysis of the Space Shuttle External Tank Door Drive Mechanism*** Michael A. Tosto , Bo C. Trieu , Brent A. Evernden ,** *Drew J. Hope , Kenneth A. Wong , Robert E. LindbergAbstractUpon observing an abnormal closure of the Space Shuttle’s External Tank Doors (ETD), a dynamicmodel was created in MSC/ADAMS to conduct deflection analyses for assessing whether the Door DriveMechanism (DDM) was subjected to excessive additional stress, and more importantly, to evaluate themagnitude of the induced step or gap with respect to shuttle’s body tiles. To model the flexibility of theDDM, a lumped parameter approximation was used to capture the compliance of individual parts withinthe drive linkage. These stiffness approximations were then validated using FEA and iteratively updatedin the model to converge on the actual distributed parameter equivalent stiffnesses. The goal of theanalyses is to determine the deflections in the mechanism and whether or not the deflections are in theregion of elastic or plastic deformation. Plastic deformation may affect proper closure of the ETD andwould impact aero-heating during re-entry.IntroductionDuring the Space Shuttle mission STS-118 of August 2007, ground telemetry data indicated that theExternal Tank Doors (ETD) did not fully complete their travel before final closing uplatches werecommanded to engage. Because the DDM actuator has a fail-safe brake which engages when no poweris applied, the mechanism is constrained at its input link as the door is forced to close. The constraint atthe input link would effectively create deflection in the DDM linkages and induce associated stress. Thisaction was modeled using the multi-body dynamics software MSC/ADAMS. To represent each flexiblepart, single degree of freedom linear springs were introduced for links in tension and compression, whiletorsional springs at the base of rigid cranks were used for links in bending. With the door drive inputcrank fixed, the door was then forced to close, thereby simulating the conditions seen by the actualmechanism. Using the ratio of FEA stresses calculated based on spring deflection and spring force, thestiffness of each link was updated until convergence on the actual equivalent stiffness. In addition to thisdeflection analysis, a tolerance analysis was performed on the DDM to determine the observable effect ofjoint tolerance stackup at the door’s outboard edge.BackgroundThe ETD cover openings in the orbiter’s underside are access regions for the umbilical and structuralconnections between the External Tank (ET) and orbiter. The ETD sits at the aft underside of the orbiter,and is prominently visible in its open configuration in Figure 1.*National Institute of Aerospace/University of Virginia, Hampton, VANASA Langley Research Center, Hampton, VA NASA Johnson Space Center, Houston, TX**thProceedings of the 39 Aerospace Mechanisms Symposium, NASA Marshall Space Flight Center, May 7-9, 20081
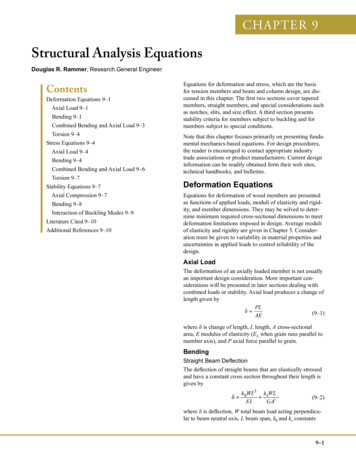
Figure 1. OV-103, Discovery, Before STS-114After jettisoning the ET during ascent, these doors are closed while on orbit and remain closed throughoutthe duration of flight and descent, until they are opened after landing for inspection. Proper door closure iscritical to avoid excessive aero-heating during descent through the Earth’s atmosphere. Thermal analysishas shown that if the doors are not fully closed and aligned with surrounding TPS tiles within 3.8 mm(0.15 in), a safe descent would be questioned [1].The three main ETD subsystems are the Centerline Latches (CL), Door Drive Mechanism (DDM), andUplatch Mechanism (UM). The CL locks the doors in their open configuration while the ET is connected tothe orbiter and through out the ascent stage. With the ET jettisoned, and while in orbit, the DDM iscommanded to move both doors from their open to closed configuration. Finally the UM, which has threehooks, is activated to latch the doors in their closed configuration and compresses the thermal andpressure seals for proper closure. Figure 2 shows a close-up of the starboard-side door with the DDMand the three hooks of the UM highlighted.2
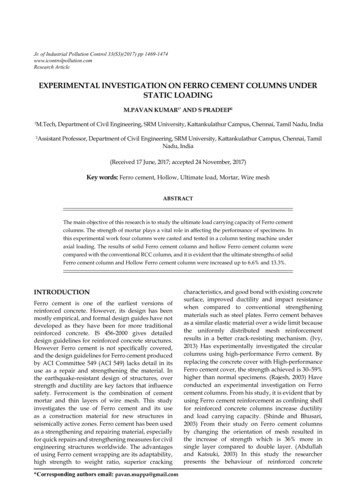
DoorDriveUplatchHooksFigure 2. Close-Up of ETD Showing Uplatch Hooks and Door DriveA Pro/E CAD model of the port-side ETD including the DDM and UM in its closed and latchedconfiguration is shown in Figure 3. Actuators are not shown.UM LinkagesDDM LinkagesFigure 3. Port Side ET Door Configuration including DDM & UMAnalytical ApproachSimulation to Obtain DeflectionsBecause the first set of ready-to-latch indications were obtained, the door was within the captureenvelope of the UM and therefore within 51 mm (2 in) of closure. Latching the doors with the DDM’sactuactor brake is on will induce deflection in the mechanism. The primary goal is to determinedeflections in the DDM linkages. From these deflections, linkage stresses can be computed to determineif deformations are within the elastic or plastic regions. For elastic deformations, cycling the ETD’s DDMand UM mechanism will return the door to its final closed configuration with respect to the Shuttle as3
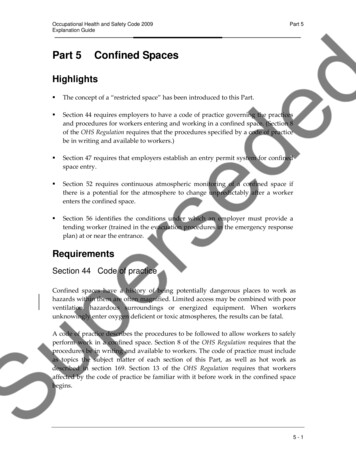
expected. If plastic deformations have occurred then the door may form gaps or a step with respect to theShuttle.The Pro/E model of the DDM in Figure 3 was initially provided, and used as a starting point forsubsequent analysis. This model was then imported to the multi-body dynamics simulation softwareMSC/ADAMS. As shown in Figure 4, the door rods within ADAMS are a simplified geometricrepresentation of the actual linkage. For the purpose of the mechanism analyses, it is sufficient torepresent these links as rod elements with revolute joints at each end.Door RodInboardAftOutboardForeFigure 4. ETD Door Drive MechanismFor deflection analyses, the linkages of the DDM can be represented in ADAMS as spring or compliantmembers, while the door and shuttle frame are considered rigid. Figure 5 shows each part of the linkageand its spring equivalence depending on loading: linear springs are used for tension or compression andtorsional springs (at the base of a rigid crank) for bending. For the “follower 1” part, both compression andbending loads exist, thus linear and torsional springs are used respectively.4
Rod 1Follower 1(tension/comp.)Crank 1Follower 1(bending)Crank 2Actuator CrankActuator RodRod 2Torque TubeFollower 2Door RodET DoorActuator Follower(hidden)Figure 5. Spring/Compliant Representation of the DDMTo find equivalent stiffnesses for use in this lumped parameter model, a representative cross section ofeach part was taken near its midpoint and used to find values of A for linear springs and I for torsionalsprings. Linear stiffness was found using equation (1) for a rod under axial load [2], and torsional stiffnesswas found using equation (2) for a cantilever beam with end load, assuming small deflections. N mm N mm 3EI π l 2 3 deg l 180 k eq k eqEAl(1)(2)To run the dynamic simulation, the actuator crank is fixed (motor brake is on) while the opposing edge ofthe door is forced to move in the closing direction 25 mm (1 in). According to the door’s riggingspecifications, actuation the DDM must leave the door between 25.4 mm (1 in) and 44.45 mm (1.75 in) ofthe fully closed and latched configuration [3]. Therefore, if the door were to stop short at 50.8 mm (2 in),then the maximum amount of additional displacement would be 25.4 mm, if the door were rigged to itsminimum sag of 25.4 mm. Figure 6 shows this requirement, as presented in the ETD installation andrigging procedure [3].5
Figure 6. Port-side Door Looking FWD, Door Sag SpecificationIteration of Stiffness ApproximationsIf FEA is used to find stress in each component based on the results of dynamic simulation, thiscorresponds to a switch from a lumped parameter model in MSC/ADAMS to a distributed model inMSC/NASTRAN. While the resulting deflections and forces are analytic within ADAMS, where force anddisplacement for each linkage obey Hook’s law for a given equivalent stiffness, stresses computed in FEAusing boundary conditions (BC’s) based on these displacements and forces will be different unless theequivalent stiffness is the same in both models. In a linear static analysis, stress is proportional to force,therefore the ratio of stresses in these two load cases is equal to the ratio of applied force respectively.Equation (3) shows this relationship, where the subscript “disp” signifies an FEA model with displacementBC’s, and “force” signifies an FEA model with force BC’s. Similarly, subscripts “f” and “ds” indicate FEAand dynamic simulation respectively. After the initial dynamic simulation and its associated stress reports,kf is the only unknown in equation (3).σ dispFdispFfk f x ds σ force F force Fds k ds x ds(3)An iterative process is employed to ensure that the equivalent stiffnesses kf and kds are in fact the same(driving equation (3) to equal 1), After an initial set of deflections and forces is obtained from the ADAMSmodel, these results are used as the input to a NASTRAN model of each flexible component. Using thestress ratio (SR) described above, a new equivalent stiffness for each link is computed according toequation (4). This result is then used to update the ADAMS model, thereby completing the loop of aprocess which can be repeated until convergence. σ dispkf σ force k ds σ disp , i k i 1 σ force, i k i (4)Tolerance AnalysisAn important point to note is that the previously described dynamic simulation does not take into accountany joint tolerances or mechanical backlash that could allow for movement of the ETD without stressingthe DDM linkages. To find the maximum possible amount of movement at the door’s outer edge due to6
joint tolerance stack-up, the problem was formulated using a vector loop approach [4]. Figure 7 showsthe actual mechanism with its two dimensional vector representation overlaid in blue.Figure 7. 2-D Representative Geometry of the DDMHowever, rather than analytically calculating the mechanism’s sensitivity to each geometric variation [4], anumerical approach was employed using MATLAB’s optimization toolbox. Each vector shown in Figure 7was given two degrees of freedom, with a constraint placed on its Cartesian length (vector norm). Anadditional tolerance vector was also inserted between each of the visible link vectors, representing amisalignment of centers at each joint. Because the magnitude of this misalignment may range from zeroup to a maximum which is derived from tolerances, constraints on the length of these vectors areimplemented as inequalities rather than equalities.Summation of vector loops is the final critical set of constraints which ensure proper assembly of themechanism. A sample loop is shown in Figure 8, where a summation of the vectors numbered 1 through7 (including tolerance vectors at each joint) is required to equal zero. Imposing this constraint on eachdistinct loop will specify the mechanism topology, and additional slope constraints may be used to removeany ambiguity of inverse kinematics.Figure 8. Vector Loop Summation (Door Removed for Clarity)7
With each vector defined and constrained, the objective function for MATLAB’s constrained nonlinearoptimization is taken to be the distance of the door’s edge from its nominal location.ResultsDeflectionsTable 1 shows the deflection of each part in the linkage from the initial iteration of ADAMS simulation.These deflections may be used to compute the stress in each linkage member to classify it as eitherelastic or plastic deformation.Table 1. Deflections in the DDM for 25 mm (1 in) at Door EdgeLinear DeflectionsPartFollower 1Rod 1Aft HingeRod 2Door RodFollower 1Rod 1Fore HingeRod 2Door RodActuator Actuator RodLocationAngular DeflectionsPartFollower 1Aft Hinge Crank 1Crank 2Follower 1Fore Hinge Crank 1Crank 2Actuator CrankActuatorActuator FollowerTorque Tube ve tension, negative compression)(deg)1.63E 003.09E-01-2.54E-011.38E tive fore [right hand rule])Convergence of Equivalent StiffnessUsing the previously outlined process, stress ratios were calculated at iteration 0 and compared to thepredicted stress ratio, calculated as a stiffness ratio. To find this stiffness ratio, the manually calculatedapproximate stiffness was used in place of kds, and a stiffness found directly from a finite element model(by applying a representative load of 4448 N (1000 lbf) and extracting the displacement) was used inplace of kf. These values are shown in the columns marked “K ratio [0]” in Table 2 and Table 3. Stressratio values after one iteration, which should approach 1, are shown in the columns marked “σ ratio [1]”.Table 2. Convergence of Stress Ratios, Links Axially LoadedLocationPartK ratio[0] σ ratio[0] σ ratio[1]Follower 11.0161.011Rod 10.6190.6361.004Aft HingeRod 20.8290.8350.997Door Rod0.8290.8321.009Follower 11.0651.013Rod 10.6190.6321.002Fore HingeRod 20.8290.8330.994Door Rod0.8290.8311.001Rod1.2710.996Actuator8
Table 3. Convergence of Stress Ratios, Links Loaded in BendingPartK ratio[0] σ ratio[0] σ ratio[1]Follower 11.7011.8061.061Aft Hinge Crank 11.4181.6500.999Crank 21.4911.6241.005Follower 11.7011.7931.062Fore Hinge Crank 11.4181.6601.000Crank er1.5491.4151.062LocationUsing these results, equivalent stiffnesses can be evaluated for convergence based on stress ratios. Ifthe stress ratio is equal to 1 then the stiffness values used in ADAMS are equal to the equivalent stiffnessof the part’s finite element model. Therefore, a stress ratio error can be computed by subtracting 1 fromall SR values. As this stress ratio error approaches zero, the actual ratio will approach 1. Figure 9 andFigure 10 show the initial SR error values at iteration 0, and the updated SR error values after oneiteration. Note that error values greater than 0 signify a part whose stiffness will be increased in the nextiteration, while error values less than zero signify a part whose stiffness will be decreased in the nextiteration.Linear Springs, Stress Ratio Error10.80.6Ratio Error (SR - 1)0.40.2Iter 0Iter 10-0.2-0.4-0.6-0.8-1Follower 1Rod 1Rod 2Door RodFollower 1Aft HingeRod 1Rod 2Door RodFore HingePartFigure 9. Stress Ratio in Parts Represented by Linear Springs9RodActuator
Torsional Springs, Stress Ratio Error10.80.6Ratio Error (SR - 1)0.40.2Iter 0Iter 10-0.2-0.4-0.6-0.8-1Follower 1Crank 1Crank 2Follower 1Crank 1Aft HingeFore HingeCrank 2CrankFollowerActuatorPartFigure 10. Stress Ratio in Parts Represented by Torsional SpringsTolerance AnalysisTo define the maximum length of the previously described misalignment vectors, actual tolerances mustbe gathered from each link’s engineering drawings. These values are shown in Table 4, along with thecalculated maximum gap and maximum misalignment (ε). Comparing these values to the ANSI standardfit classes, most of the specified tolerances fall within a range most closely resembling the RC3 class forprecision running fits [5].10
Table 4. Component Tolerance Values (mm)Parent PartDoor RodRod 1Follower 1Rod 2Follower 2Act. RodTube ShaftLocation Child PartRod End BearingEnd 1Shoulder BoltRod End BearingEnd 2Shoulder BoltRod End BearingEnd 1Shoulder BoltRod End BearingEnd 2PinFlanged BushingBaseShoulder BoltRod End BearingEnd 1Shoulder BoltRod End BearingEnd 2Shoulder BoltFlanged BushingBasePinFlanged BushingDoorPinRod End BearingEnd 1Shoulder BoltRod End BearingEnd 2Shoulder BoltFlanged BushingEnd 1Flanged BushingFlanged BushingMidFlanged BushingFlanged BushingEnd 2Flanged 1841.275041.206433.337533.268922.225022.1564 0.00000.01270.0000Max .0254Max 0.03430.02790.02790.05330.05330.0533After applying the contents of Table 4 in the MATLAB optimization code, the maximum possible motion ofthe door’s edge from its nominal location is 6.375 mm (0.251 in). If this motion is applied in bothdirections, then the maximum possible total mechanism backlash due to joint tolerances allows for 12.75mm (0.502 in) of motion at the door’s edge.Stress AnalysisThe stress results for each component after one iteration (used to find the “σ ratio[1]” values in Table 2and Table 3), are shown below in Table 5 and Table 6. These values represent the predicted stressinduced by a 25.4 mm (1 in) movement of the door’s outboard edge, with the DDM actuator crank fixed.To calculate factor of safety (FS) values, an allowable stress of 703 MPa (102 ksi) was assumed.Table 5. Stress Results After 1 Iteration, Parts in BendingLocationPartFollower 1Aft Hinge Crank 1Crank 2Follower 1Fore Hinge Crank 1Crank 2CrankActuatorFollowerDeflection (deg)1.85E 003.83E-01-3.15E-011.52E 003.11E-01-5.87E-01-2.48E-013.91E-01M (N·m)2.34E 042.27E 03-2.38E 031.92E 041.84E 03-4.43E 03-1.80E 032.71E 03DisplacementFEA σ (MPa)F (N)1.01E 051.44E 031.56E 045.12E 02-2.45E 04 5.38E 028.32E 041.19E 031.26E 044.16E 02-4.56E 04 1.00E 03-2.47E 04 6.52E 023.35E 049.51E 0211LBCFS0.491.371.310.591.690.701.080.74Force LBCFEA σ (MPa)FS1.36E 030.525.12E 021.375.36E 021.311.12E 030.634.16E 021.699.93E 020.716.46E 021.098.96E 020.78σ ratio[i] σ 1.0001.6601.0071.6301.0101.5851.0621.415
Table 6. Stress Results After 1 Iteration, Parts in Tension/CompressionLocationPartFollower 1Rod 1Aft HingeRod 2Door RodFollower 1Rod 1Fore HingeRod 2Door RodActuator RodDeflection 9E-022.55E-01-3.50E-01-3.44E-01F (N)8.42E 04-2.51E 043.41E 04-1.06E 056.92E 04-2.06E 046.36E 04-8.72E 04-7.56E 04Displacement LBCFEA σ (psi)FS2.58E 022.733.48E 022.022.58E 022.738.07E 020.872.12E 023.312.84E 022.484.78E 021.476.61E 021.061.73E 030.41Force LBCFEA σ (psi)FS2.55E 022.763.47E 022.032.59E 022.728.00E 020.882.10E 023.362.83E 022.484.81E 021.466.60E 021.071.74E 030.40σ 996σ 1.271Although these results do show some components with factors of safety less than one, this does notnecessarily mean that closure of the ETD during STS-118 would have resulted in yield. Because theactual rigged door sag was not known at the time, this analysis did not produce a definitive prediction ofadditional stress induced in the door drive linkage. Because the minimum computed factor of safety for25.4 mm (1 in) of door motion was 0.41, the door could be forced to move up to 10.16 mm (0.40 in) at itsoutboard edge before allowable stresses would be reached.Resolution of Door Closure, Future WorkAfter reviewing both the results outlined here and photographs taken during the orbiter’s rendezvous pitchmaneuver, it was determined that the only action necessary to ensure proper door closure was a cyclingof the uplatches. During this procedure, the door drive was once more operated in the closed direction,and all closed indications were received through telemetry. To complement the analyses described in thispaper, actual rigging data from the orbiter Endeavour taken before STS-118 could be used to reach abetter estimate of stress in the DDM. Predicted stresses could then potentially be further confirmedthrough experimentation using a training mockup version of the DDM.ConclusionsThrough the use of MSC/ADAMS, a flexible multi-body dynamic simulation of the ETD DDM was able tobe quickly constructed and used to find linkage deflections. The advantage of this type of analysis is itsrelative simplicity compared to a full FEA model of the DDM, combined with preserved accuracy ofmechanism kinematics. This simplicity allows for rapid construction of the model in addition to a reductionin computer computation time required. Although complex geometry is reduced to lumped equivalentstiffnesses, the analyst has the ability to select each flexible degree of freedom that will be of primaryinterest and include it in the model. The stiffness used for each of these individual degrees of freedommay then be verified using FEA and updated as necessary.AcknowledgementWe would like to dedicate this paper to the memory of Marlon C. Batey. Marlon worked as an aerospaceengineer in the Mechanical Systems Branch of NASA Langley Research Center over the past threeyears. Without his contributions to the team, none of the work described here would have been possible.In addition to his diligence and motivation, it was always a pleasure to work with him. Marlon has beenand will be greatly missed.References1. Don Picetti, Thermal Analysis and Test Results for ET Door Paint Striping, Boeing Orbiter Element,S063244, Daily PRCB Presentation2 . Rao, Singiresu S. Mechanical Vibrations, Fourth Edition, Pearson Prentice Hall, 200412
3 . Brinkworth, D. “ET/Orbiter Umbilical Door Mechanism Installation and Rigging Procedure”, SpaceDivision Rockwell International, Doc. No. ML0308-0058 rev. C, 19824 . Chase, Kenneth W.; Gao, Jinsong; Magleby, Spencer P. "General 2-D Tolerance Analysis ofMechanical Assemblies with Small Kinematic Adjustments", Journal of Design and Manufacturing, v 5n 4, 1995th5 . Oberg, Erik. Machinery’s Handbook, 24 Edition. Industrial Press, 199213
deflection analysis, a tolerance analysis was performed on the DDM to determine the observable effect of joint tolerance stackup at the door’s outboard edge. Background The ETD cover openings in the orbiter’s underside are access regions for the umbilical and structura