Transcription
Some Practical Applications ofFORENSICSEISMOLOGYJ. David RogersGeological Sciences & EngineeringUniversity of Missouri-RollaKeith D. KoperDepartment of Earth and Atmospheric SciencesSt. Louis University
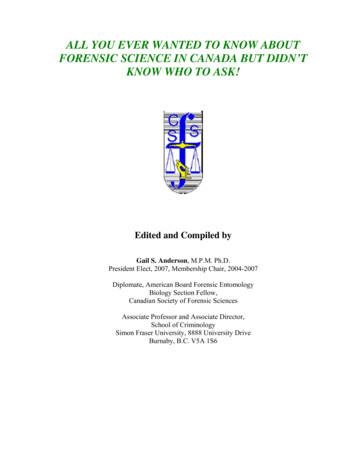
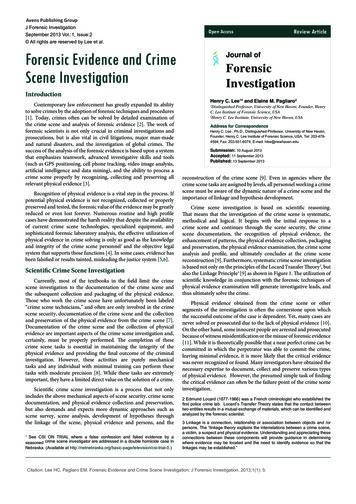
Explosionsrelease energysimilar toearthquakes On the night of May 16-14, 1943 Britishbombers struck the Mohne, Eder and SorpeDams in the German Ruhr Valley, destroyingtwo of them. The inset image shows the blipson the trace of the seismograph at the Institutfür Geophysik at Göttingen, 130 km distant.
The Göttingen seismograph recorded 7 of 11 explosionsat the Mohne (130 km), Eder (75 km) Sorpe (139 km)dams. The explosions that were not recorded occurredeither in the air above ground or within the earthenembankment of the Sorpe Dam.
The origins of forensic seismology canbe traced to the establishment ofnuclear test ban treaties
NUCLEAR TEST BANTREATY VERIFICATION
Comprehensive Nuclear-Test-BanTreaty Organization (CTBTO) Organized in 1996Most recent international effort to reducenuclear weapons proliferationBy the end of 2004, 41 of 44 countries hadsigned it; 33 of 44 nations have ratified itCTBTO created the International MonitoringSystem (IMS)“Convinced that the most effective way to achieve an end tonuclear testing is through the conclusion of a universal andinternationally and effectively verifiable comprehensivenuclear test-ban treaty, which has long been one of thehighest priority objectives of the international community inthe field of disarmament and non-proliferation”
International Monitoring System
Nuclear Detonations vs. Earthquakes
SEISMIC WAVE PROPERTIESUNDERGROUNDNUCLEAR BLASTSNATURALEARTHQUAKESP waves dominateS waves dominateCompressional wavesTransverse wavesSimilar to sound wavesSimilar to shaking one end of rope
INDIA - PAKISTAN NUCLEAR TESTS IN 1998
SEISMIC SIGNATURES
P/S RATIOS
SEISMIC DISCRIMINATE BETWEENEARTHQUAKES AND EXPLOSIONSML local Richter Magnitude Scaleshort period energyMO Scalar Momentlong period energy
SEISMIC DISCRIMINATE BETWEENEARTHQUAKES AND EXPLOSIONS Explosions have a significantly smallersurface wave magnitude (Ms) than anearthquake with the same body wavemagnitude (mb).This is because the source spectrum of anearthquake is richer in long-period energythan that of an explosion. Larger, deeperseated energy releases emit longerwavelength energy than smaller sourcesnear the Earth’s surface. Much of anexplosion’s energy is lost into theatmosphere.
FUTURE MONITORING
THE EMERGING FIELDOF FORENSICSEISMOLOGY What is it?How can we use it?Can it be used to provide valuable cluesand information on secret detonationsby rouge nations or terrorist acts?
What is a Seismograph?
What is a Geophone?
QUAKE’S RELEASE ENERGY DESCRIBEDUSING A LOGARYTHMIC SCALE
Old RichterScaleMagnitudeEquivalent Energy(Weight of TNT)1.06 Ounces1.52 pounds2.013 pounds2.563 pounds3.0397 pounds3.51,990 pounds4.06 tons4.532 tons5.0199 tons5.51,000 tons6.06,270 tons6.531,550 tons7.0199,000 tons7.51,000,000 tons8.06,270,000 tons8.531,550,000 tons9.0199,000,000 tons
SEISMIC DATA Over 10,000 seismometers are deployedaround the worldSeismometers are “on” 24 hrs, 7 days a week.Most seismic data is free and available overthe Internet in near real-timeThe International Monitoring System (IMS)utilizes 321 seismograph stations and 16radionuclide labsEffectiveness of CTBTO monitoring networkapparent in aftermath of Pakistani and Indiannuclear blasts in 1998
The AutoDataRequestManagerSystemprovidesReal TimeSeismicDataworldwide http://seismo.ethz.ch/waves4uor autodrm@gldfs.cr.usgs.go
SEISMIC DATA CAN BE USED TOCHARACTERIZE ALL KINDS OFENERGY RELEASE EVENTS It is common for seismometers to recordsignals from sources other than earthquakes: seismometers are always “on” modern seismometers are extraordinarilysensitiveAnalysis of these non-earthquake sourcescan often give information that is important toinvestigative agencies, insurance companies,lawyers, and the general public as:forensic seismology
EXAMPLES OFNON-EARTHQUAKESEISMIC SOURCES Natural Eventsbolide/impactsvolcanic eruptionsmine collapserock fall/land slidestornadosMan-Caused Events nuclear weaponstest chemical explosions terrorist attack industrial accident routine mining airplane crash train derailment
BOMBING OF THEALFRED P. MURRAHFEDERAL BUILDINGOKLAHOMA CITYAPRIL 1995
LOCATIONS OFSEISMOGRAPHSIN OKLAHOMACITY Locations ofpermanent andportableseismographs thatrecorded April1995 bombing andsubsequentdemolition of theMurrah FederalBuilding inOklahoma City
April 19, 1995 TruckBomb Explosion Two seismographs recordedthe explosion and ensuingstructural collapse; one at6.86 km northeast andanother at 26.02 km southTwo distinct wave trainswere recorded, about 10seconds apartWere these recording twoseparate explosions?Bloggers on Internet createdenormous confusion anddoubt
Four portableseismographs werebrought in to recordthe controlleddemolition of thebuilding on May 23,1995Two wave trains wererecorded, with distinctseismic phases thattraveled in a nearsurface zone, overwhich the seismicvelocity increasedsharply with depth
RESULTS OF MONITORINGBUILDING DEMOLITION The first phase wave train appeared tobe a packet of scattered seismic shearwavesThe second is the fundamental-modeRayleigh surface waveThe two wave trains recorded on April19th are consistent with a singleexplosion, not evidence of twoexplosions
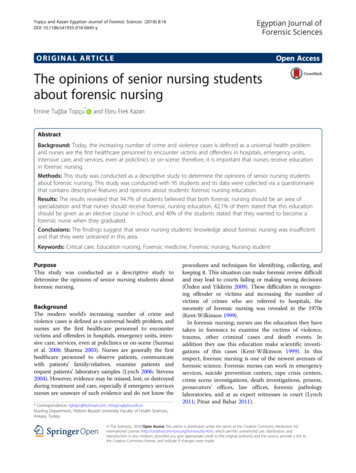
Comparisons of seismograms recorded during the April19th bombing and May 23rd demolition. Base of left plotshows numbers assigned to various wave trains (5Xamplification). Middle plot shows seismograms ofvertical velocity recorded by portable digital units at thesite, plotting as function of distance from the building.Trace at right shows permanent seismograph recordingof May 23rd demolition at 6.86 km distance.
VALIDATION OFSEISMIC MODEL Comparison of April 19thbombing and May 23rddemolition recorded at Univof Oklahoma, 26 km away.Numbers in parenthesesrefer to wave train packets.Lower plots comparerecorded trace withsynthetic seismogram for a1-D velocity modelassuming a near-surface 350m thick zone where S-wavevelocity increasessignificantly with depth
ANFO Barrelsarraigned to form aShaped Charge The sketch at left wasmade by Timothy McVeighexplaining how hearraigned the plasticbarrels containing theANFO mixture, to focus theblast laterally, towards theMurrah Federal buildingThe ANFO truck bomb hadin excess of 6,200 poundsof 'energetic materials' –equivalent to about 5,000pounds of TNT.
CONCLUSIONS from USGS STUDY - 1 The May 23rd detonation lasted 8 seconds, butalso generated two distinct wave trains, 10seconds apart at the University of Oklahomaseismograph station, 26 km distant.Most of the seismic energy generated by thedemolition occurred in first 5 seconds; withexplosives release limited to first 2.5 seconds(remainder is collapse-related)Wave Train 3 appears to be fundamental modeRayleigh surface wave, moving across landsurface at 1.7 km/sec
CONCLUSIONS from USGS STUDY - 2 Synthetic seismograms were generatedbased on what was known about theunderlying structure and computed forthe May 23rd detonation (known energysource)Average velocities were 2.7 and 5.5km/sec for wave train 1.5.5 km/sec wave train velocity appears tobe a deeply refracted P wave, off the topof the underlying Arbuckle Limestone
CONCLUSIONS from USGS STUDY - 3 Applying velocities recorded during May 23rddemolition to the April 19th bombing suggest the timeof detonation as between 9:01:52 and 9:01:57 AM localtimeThe building demolition on May 23rd only used 68 kg ofdynamite.Energy source for the April 19th truck bomb estimatedto be approximately 1820 kg (4022 lbs), about 28X thatused in the May 23rd building demolitionThis weight and volume of ANFO could have easilybeen contained within the Ryder rental truck parkednext to the building, seen in the electronic tellersurveillance camera from across the street
NAIROBIEMBASSYBOMBINGAUGUST1998
ATTACK ON U.S EMBASSY IN NAIROBI,KENYA – AUGUST 1998
Basic Facts of Nairobi Attack On 10 August 1998 al-Qaeda terroristsdetonated truck-bombs nearlysimultaneously at U.S. Embassies in twoAfrican countries: Dares Salaam, Tanzania Nairobi, Kenya Over 4,000 persons were wounded and 220were killed The Nairobi bombing was seismicallyrecorded
U.S EMBASSY IN NAIROBI, KENYA
SEISMIC STATION NAI A three component,broadbandseismometer,operated by theUniversity of Nairobiwas located about 3km northwest of theblast site. Thestation code for thisinstrument is “NAI”.
SEISMIC DATA FROM NAIFirst time span, mainexplosion and echo.Second time span,unexplained airblasts.
Results from Waveform Modeling The main blast occurred at10:39:19.8 /- 0.2 s An “echo” of the airblast from anearby hill was recorded At least two additional airblastswere recorded within 1 minute ofthe blast; they are of unknownorigin The seismic moment was 4 x 10⁸Nm, which corresponds to theenergy released by about 40 lbs ofTNT. Seems very small ?
ENERGY PARTITIONING Not all of the energy of a bomb goesinto seismic waves. Some other energyreservoirs are: crater formation deformation of truck and buildings projection of debris (missiles) atmospheric sound waves heat generationHow can we determine the total energyreleased (yield) from only seismicdata?
YIELD ESTIMATION for TRUCKBOMBS Record seismic observations of truck bombexplosions in controlled environments Determine empirical scaling laws that relatedseismic observables to source properties Use these laws with the Nairobi seismicobservations in a “backwards” direction toestimate the Nairobi explosive yield
Truck Bomb Explosions CarriedOut at White Sands Missile Range Four truck bomb explosionshave been carried out andmonitored with seismometers The experiments weresponsored by the Bureau ofAlcohol, Tobacco, andFirearms (ATF) The tests were originallydesigned to: train ATF and FBI agents quantify the effects oftruckbombs on variousstructures study the dynamics oftruckbomb explosions
Ammonium Nitrate Fuel Oil (ANFO)mixture, oftenused by terroristsBeforeAfter
Waveform ComparisonExample Seismogramfrom Controlled TestActual NairobiSeismogram
Useful Waveform Properties Time domain: Fourier TransformP-wave amplitude (μ)Frequency Domain Scalar moment (Ω)Corner frequency (fc)Spectral decay rate (ζ)
SCALING LAW DEVELOPMENT(1) Collect raw data from experiments:peak displacement versus distance.(2) Convert raw data to dimensionlessvariables:μ displacementr distancem mass of explosiveρ densityΔ μ normalized displacementrΨ mpr 3 normalized yield(3) Determine relation betweendimensionless variables: how areD and Y related ?
NAIROBI BOMBING SUMMARY Seismic records indicate a single, surface explosionoccurred, with an upper limit explosive yield of 17tons. The lower bound value was not determinable.Estimate was based on standard tables for chemicalexplosions.Adjustment for seismic efficiency of the truck bomb(upper bound of 3%) gives a estimate of about 3 tonsof explosives, probably much closer to the actual size.Combination of Nairobi seismic records with scalinglaws from White Sands Missile Range tests provide anestimate of direct yield (explosive size)In this case, the seismic constraints merelycorroborated results from the direct investigation.
EXPLOSIONAND SINKINGOF RUSSIANSUBMARINEKURSKAUGUST 2000
KURSK DISASTER On 12 August 2000, the Oscar II nuclear-powered cruisemissile submarine, Kursk (K 141), sank in the BarentsSea, with the loss of all 118 crew. Commissioned in Jan1995, the Kursk was part of the Russian Northern Fleet.From Norwegian seismological records, it appearedthat the submarine was destroyed by two explosions. Asubsequent inquiry confirmed that these were causedby the explosion of a Type 65 high test peroxide (HTP)650mm torpedo, which triggered a much largerexplosion in the weapons compartment that caused thesubmarine to sink. The blast appears to have beencaused by highly volatile torpedo propellant that leakedand came in contact with kerosene and metal.In vain efforts to rescue any surviving crew were aidedby the UK's LR5 submarine rescue vehicle and aNorwegian diving team.
KURSK DISASTERThe Russian submarine Kursk (K-141) was sunk in August of2000 while participating in war games in the Barents Sea.BIG KILLER SUB: 18,300 tons submerged displacement; length505 feet; diameter 60 feet. Compliment 107-118 men. Max speed28 kts submerged; 15 kts surfaced.
Armament Carried by theRussian Submarine Kursk Kursk was a recently commissioned (January 1995) Antey (OscarII) Class nuclear powered cruise missile carrying attacksubmarine (SSGN). Roughly same size as USN Ohio Class SSBNDesigned to be an potent ship killer. Armament consists of:Surface to surface missiles (SSM’s): Up to 24 SS-N-19 Shipwreck(Granit); inertial with command update guidance; active radarhoming to 20-550 km (10.8-300 nm) at 1.6 Mach; warhead 750 kgHE or 500 kT nuclear.Other antiship weapons: Novator SS-N-15 Starfish (Tsakra) firedfrom 53 cm tubes; inertial flight to 45 km (24.3 nm); warheadnuclear 200 kT or Type 40 torpedo. Also Novator SS-N-16 Stallionfired from 65 cm tubes; inertial flight to 100 km (54 nm); payloadnuclear 200 kT (Vodopad) or Type 40 torpedoes (Veder).Wire-guided torpedoes: 4-21 in (533 mm) and 2-26 in (650 mm)tubes. Combination of 65 and 53 cm torpedoes. Total of 28weapons including tube-launched A/S missiles. 32 mines couldalso be carried.
Underwaterenergy sources are super-efficient; theresulting seismic signals were recorded throughoutnorthern Europe on the Auto DRM system
FIRST SEISMIC RESULT: There were two discrete sources Time separation of 2 minutes 15 sec Emanated from virtually the samelocation Waveform similarity argues for samesource mechanism (explosions) Seismology was the only non-classifiedsource for this tidbit of information
Waveform Correlation Detector
SECOND SEISMIC RESULT The larger (second) event wasdefinitely an explosion, not anearthquake or impact (also, it turns out,not an implosion either) First, smaller, event was probably anexplosion Again, seismology was the only nonclassified source of this information. Itwas also known very quickly.
BUBBLE PULSES
BUBBLE PULSES: The Fingerprint ofan Underwater Explosion
Typical Shock Test Aerial view of a shock test being carried out against the USSArkansas (CGN-41). The Arkansas is a nuclear powered VirginiaClass cruiser, commissioned in 1980.
Shock Test Adjacent to Aircraft Carrier
THE KURSK BUBBLE PULSE
THIRD SEISMIC RESULT:Relative Size of ExplosionsMagnitude-yield relations are of theform:magnitude a*log(yield) bwhere a and b are the model parameters It turns out that a is virtually constantfor all sorts of explosions in alldifferent places (a is 0.75-0.80)
THIRD SEISMIC RESULT:Relative Size of Explosions Given magnitudes for the two Kursk events(from the seismic data) and using a standarda value we can determine the ratio of the twoyield (explosive strength). Note b cancelsout. It turns out that the main (second) event wasabout 250 times bigger than the precursoryevent.
FOURTH SEISMIC RESULT:Absolute Size of ExplosionsTwo methods for determining this:1.Use magnitude-yield relationship previouslydeveloped for underwater explosions. 5000 kgtest shots detonated in the Dead Sea andrecorded by International Monitoring System[IMS] stations in November 20022.Go back to bubble pulse
THE KURSK BUBBLE PULSEThe spacingbetweenpeaks in thefrequencydomain is afunction ofyield anddepth ofdetonation.
BUBBLE PULSE FREQUENCYQuasi-analyticrelationshipbetween yield,depth, andbubble pulsefrequencyspacing. FromWorld War IIexperiments atNUWL-MorrisReservoir.
BUBBLE PULSE FREQUENCY In theory, analysis of the data can give youdepth of detonation, depth of water columnand size of explosion (cepstral analysis). In practice, things are more fuzzy and we areleft with a trade-off between size and depthof detonation. However we can assume a range ofreasonable depths and get bounds on theyield.
FOURTH SEISMIC RESULT:Absolute Size of Explosions In turns out that the bubble pulseanalysis and the magnitude-yield relationgive the same answer (within generouserror bounds):About 5 tons TNT equivalent On the same order as the 1995 OklahomaCity bombing.
RESULTS of KURSKINVESTIGATION - 1Four solid seismic results:1.2.3.4.There were two discrete sourcesLarger one was definitely an explosionLarger event was about 250 times moreenergetic than precursory eventLarger event was about 5 tons TNTequivalent
RESULTS of KURSKINVESTIGATION - 2 The information derived from seismic analysisof the Kursk data provided constraints thatwere unique among unclassified sources. The Kursk seismic results also providedsubstantial, important, and timelycorroboration for the classified analysis. A higher grade of forensic information than inthe Nairobi case.
KURSK POSTSCRIPT -1 The Kursk was raised in October 2001 andtowed to the Russian naval shipyard inMurmansk.The forward weapons compartment was cutout prior to lifting and sections were laterlifted in May 2002. The wreckage remaining onthe seabed was demolished to preventrecovery by others.The nuclear reactors and SS-N-19 Granitcruise missiles were all recovered. Thesalvage operation was carried out by twoDutch companies, Mammoet Worldwide andSmit International.
Note buckled hull Nuclearpowered submarines are designed to withstand considerable battledamage. These views show massive damage to forward section of USS SanFrancisco (SSN 711) on Feb 12, 2005 when she collided with seamount off Guam.Only 1 crewman killed and 98 injured, 23 seriously, out of 137 aboard.
CARLSBAD PIPELINEEXPLOSIONAUGUST 2000
CARLSBAD PIPELINEEXPLOSION On Saturday August 19, 2000 a buried naturalgas pipeline burst and exploded about 30miles south of Carlsbad, in southeastern NewMexicoLine 1103, a 30” diameter natural gas pipelinewas one of four crossing the Pecos River atthis location, operated by the El Paso NaturalGas CompanyThe resulting fireball burned for over one hour12 people camping approximately 300 feetaway were killed. Cause of death wasextensive thermal burns, carbon monoxidepoisoning, and smoke inhalation.
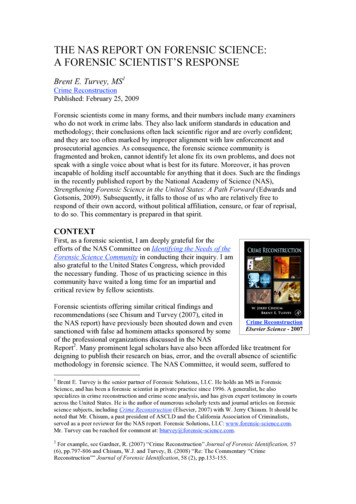
LOCATION Mapshowing buried trunklines operated by the ElPaso Natural Gas System Vicinitymap of theaccident scene, alongeastern bank of the PecosRiver just north of the NewMexico-Texas panhandleborder. Note Line 1103.
The explosion occurred adjacent to five bridges thatconvey four natural gas pipelines across the PecosRiver about 4.5 miles north of the New Mexico-Texasborder. The fifth bridge is for a service road along theburied pipelines. Note nearby compressor station.
Overview of accident scene looking east. Note four natural gaspipeline crossing Pecos River in foreground, rupture site, andcampsite area. Line 1103 was the one that exploded. From NTSBReport PAR-03/01
Fire burning from crater area for over an hour after theinitial explosion. Note bridge towers.
The explosion created a 51 ft wide crater along 113 lineal feet ofPipeline 1103. 49 lineal feet of pipeline was ejected from the craterin four segments.
Looking west at a portion of the blast crater. Foursections of pipe (comprising 49 lineal feet) between thearrows were ejected from the crater. A 22 ft longsegment was recovered 270 feet from the crater.
12 people were camping adjacent to the service road bridgesupporting the gas pipelines over the Pecos River. Pipeline 1103was constructed in 1950. The explosion occurred at 5:26 AM andall 12 campers were incinerated, most beyond recognition.
Fractured section of Pipeline 1103. Examination of the foursections of pipe ejected from the blast crater revealed extensivecorrosion along the inside of the bottom of the pipe, reducingcross sectional thickness by 72%. Affected length was about 22ft. This pitting was caused by acid-producing bacteria.
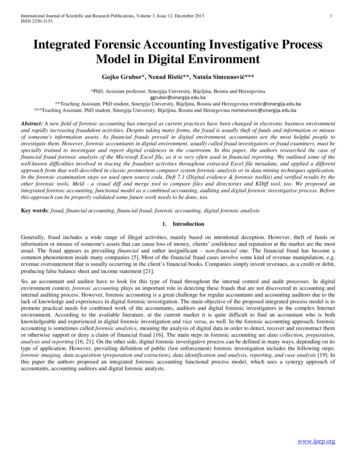
ESTIMATING THE SIZE OF THEEXPLOSIONNearbyseismometersRed: permanent,single component,short periodBlue: temporary,broadband, threecomponent
Three Pulses –1 Blowout, 2 Ignitions
Extended Coda wave train fromFireball CombustionThe coda is the concluding portion of a seismogram following the early,identifiable waves. During earthquakes, long trains of coda waves may last forhours, especially if long oceanic travel paths are involved.
Relative timingof sources,deduced fromsimple linearregressionFreshman mathcoursesoccasionallyuseful in realworldapplications
CARLSBAD EXPLOSION SUMMARYSlide # 1 Seismic data show three distinct sourcepulses and one long extended coda ( 1 hrlong) We interpret these as:Blowout of pressurized pipelinePrimary ignition of escaping gasSecondary ignition; andSustained “fireball roaring” (combustion)1)2)3)4)
CARLSBAD EXPLOSION SUMMARYSlide # 2 Professor Koper calculated the relativetiming of events down to fraction of asecondThese estimates include preciselywhen the gas company shut off the gasand snuffed out the fireball. Rescueworkers were prevented fromapproaching the camp site by theenormous heat generated by thefireball.
CARLSBAD EXPLOSION SUMMARYSlide # 3 If gas company had employed anautomatic shutoff when a decrease inpressure was detected (the blowout),it’s possible the ignition could havebeen prevented; orAt least rescue workers could haveattended to the victims much soonerand possibly saved their lives (somevictims lived for several days).
CARLSBAD EXPLOSION SUMMARYSlide # 4In this case the seismic data had adirect and influential role in piecingtogether the disaster. This wasimportant because there were nosurviving witnesses.The seismic data provided unique, nontrivial constraints, with a “reasonabledegree of scientific certainty.”The seismic analysis has an ongoingrole in litigation/prosecution, and so, istruly forensic seismology.
SUMMARY COMMENTSONFORENSIC SEISMOLOGYCrater field at Nevada Test Site
SUMMARY COMMENTS - 1 It is common for seismometers torecord non-earthquake energy sources.It will become even more common inthe foreseeable future.Analysis of these seismic data cancontribute to the understanding ofimportant man-caused disasters,anywhere, anytime.
SUMMARY COMMENTS - 2 The impact of forensic seismologyanalyses spans the range fromconfirmation and identification of theobvious to unique determination ofcritical source information.It will increase public awareness ofseismology and it’s importance tosociety at large, as well as national andglobal security
Some Practical Applications of FORENSIC SEISMOLOGY J. David Rogers Geological Sciences & Engineering Un