Transcription
Conlin et al. Journal of the International Society of Sports 2(2021) 18:52RESEARCH ARTICLEOpen AccessFlexible vs. rigid dieting in resistancetrained individuals seeking to optimizetheir physiques: A randomized controlledtrialLaurin Alexandra Conlin, Danielle Trina Aguilar, Gavin Elliot Rogers and Bill I Campbell*Abstract: Background: The purpose of this study was to compare a flexible vs. rigid diet on weight loss andsubsequent weight regain in resistance-trained (RT) participants in a randomized, parallel group design.Methods: Twenty-three males and females (25.6 6.1 yrs; 170 8.1 cm; 75.4 10.3 kg) completed the 20-weekintervention (consisting of a 10-week diet phase and a 10-week post-diet phase). Participants were randomized to aflexible diet (FLEX) comprised of non-specific foods or a rigid diet (RIGID) comprised of specific foods. Participantsadhered to an 20%kcal reduction during the first 10-weeks of the intervention and were instructed to eat adlibitum for the final 10-weeks. Body composition and resting metabolic rate were assessed 5 times: (baseline, 5, 10[end of diet phase], 16, and 20 weeks).Results: During the 10-week diet phase, both groups significantly reduced bodyweight (FLEX: baseline 76.1 8.4kg, post-diet 73.5 8.8 kg, 2.6 kg; RIGID: baseline 74.9 12.2 kg, post-diet 71.9 11.7 kg, 3.0 kg, p 0.001); fat mass (FLEX: baseline 14.8 5.7 kg, post-diet 12.5 5.0 kg, 2.3 kg; RIGID: baseline 18.1 6.2 kg,post-diet 14.9 6.5 kg, 3.2 kg p 0.001) and body fat% (FLEX: baseline 19.4 8.5%, post-diet 17.0 7.1%, 2.4%; RIGID: baseline 24.0 6.2%, post-diet 20.7 7.1%, 3.3%; p 0.001). There were no significantdifferences between the two groups for any variable during the diet phase. During the post-diet phase, a significantdiet x time interaction (p 0.001) was observed for FFM with the FLEX group gaining a greater amount of FFM( 1.7 kg) in comparison with the RIGID group ( 0.7 kg).Conclusions: A flexible or rigid diet strategy is equally effective for weight loss during a caloric restriction diet infree-living, RT individuals. While post-diet FFM gains were greater in the FLEX group, there were no significantdifferences in the amount of time spent in resistance and aerobic exercise modes nor were there any significantdifferences in protein and total caloric intakes between the two diet groups. In the absence of a clear physiologicalrationale for increases in FFM, in addition to the lack of a standardized diet during the post-diet phase, we refrainfrom attributing the increases in FFM in the FLEX group to their diet assignment during the diet phase of theinvestigation. We recommend future research investigate additional physiological and psychological effects offlexible diets and weight regain in lean individuals.Keywords: Diet, Diets, Bodybuilding, Physique enhancement, Resistance exercise, Fat loss, Body fat percentage,Muscle mass, Caloric deficit, Exercise* Correspondence: bcampbell@usf.eduPerformance & Physique Enhancement Laboratory, Exercise Science Program,Department of Educational and Psychological Studies, University of SouthFlorida, 4202 E. Fowler Ave., PED 214, Tampa, FL 33620, USA The Author(s). 2021 Open Access This article is licensed under a Creative Commons Attribution 4.0 International License,which permits use, sharing, adaptation, distribution and reproduction in any medium or format, as long as you giveappropriate credit to the original author(s) and the source, provide a link to the Creative Commons licence, and indicate ifchanges were made. The images or other third party material in this article are included in the article's Creative Commonslicence, unless indicated otherwise in a credit line to the material. If material is not included in the article's Creative Commonslicence and your intended use is not permitted by statutory regulation or exceeds the permitted use, you will need to obtainpermission directly from the copyright holder. To view a copy of this licence, visit http://creativecommons.org/licenses/by/4.0/.The Creative Commons Public Domain Dedication waiver ) applies to thedata made available in this article, unless otherwise stated in a credit line to the data.
Conlin et al. Journal of the International Society of Sports NutritionIntroductionA majority of weight loss efforts fail to provide longterm weight maintenance [1]. Such outcomes supportthe contention that some view weight loss as a transientperiod of time and do not recognize the necessity forpermanent lifestyle and dietary habit change. Dietrestricted weight loss creates a host of distinct biologicaladaptations, including but not limited to increased hunger, decreased satiety, suppressed energy expenditure,and altered levels of circulating hormones known to influence weight loss and maintenance [2, 3]. These adaptations inevitably cause weight regain if permanentlifestyle changes are not created.To achieve successful weight loss, an individual mustdevelop and maintain dietary patterns that create a caloric deficit [4, 5]. If this vital criterion is not first met, anindividual will fail in their weight loss efforts [6, 7]. Optimal approaches to weight loss and weight loss maintenance from a physiological perspective are currentlyunknown. Regardless of what may or may not be optimal from a physiological perspective, an emerging bodyof evidence suggests that adherence to a diet, regardlessof the type of diet, is an important factor in weight losssuccess [7, 8].In addition to understanding the importance of creating a calorie deficit is the recognition that some extentof cognitive restraint must be instilled on the part of thedieter to achieve successful weight loss. Westenhoefer[9] suggested that cognitive restraint can be divided intotwo categories, identified as ‘rigid control’ and ‘flexiblecontrol’. Rigid control typically represents an all-ornothing approach to an individual’s eating behaviors andattitudes toward dieting, while ultimately (negatively) influencing their weight; while flexible control typicallyrepresents a more moderate approach to those behaviors. Individuals adopting rigid control of their diet willeliminate “forbidden” foods from their daily food intake,thereby narrowing the variety of foods ingested [10].Rigid control is associated with a dichotomous mindset,in that an individual displays an “on or off” mentalityand any slight deviation from the plan can cause the individual to switch “off” the diet. This switching off phenomena commonly results in increased levels ofdisinhibition (overeating), binging, or setbacks [11–13].Further, rigid restraint allows little to no variation offood choices, has been associated with higher levels ofnon-planning compulsiveness and less successful weightmaintenance [14]. In concert with this, Palascha and colleagues concluded that holding dichotomous beliefsabout food and eating may be linked to a rigid dietaryrestraint, which in turn impedes people's ability to maintain a healthy weight [15].Alternatively, flexible control is marked by a moremoderate approach to dieting behaviors. Previous(2021) 18:52Page 2 of 10literature has shown how flexible control positively impacts weight loss, partly from the absence of overeatingtypically characterized by rigid control. Additionally, itreduces the effect of food cravings and allows the dieterto adjust their daily food consumption without compensatory behaviors that negatively affect long-term weightmaintenance [16]. These long-term, flexible dietary behaviors allow for higher levels of self-regulation, less disinhibition and lower binge eating behaviors [14, 17, 18].For resistance-trained individuals seeking to enhance their physique via reduction of fat mass whilemaintaining/gaining fat-free mass—best practiceguidelines suggest a moderate caloric deficit with relatively high dietary protein intakes [19–22]. Withmacronutrient (protein, carbohydrate, and fat) targetsthat provide a high protein intake and sufficient energy to produce moderate energy restriction, the individual can construct their diet to their ownpreferences, lifestyle, and spontaneous events of life,potentially leading to increased adherence and dietaryfreedom. A diet that prioritizes individual preferencesamong bodybuilders and individuals wanting to enhance their physiques is referred to as “If It Fits YourMacros” (IIFYM) [23]. The IIFYM dieting approach,as it is practiced by resistance-trained individualsseeking to optimize their physiques, places an emphasis on strategically targeted macronutrient totals,with an emphasis on higher protein intakes, and assuch is also commonly referred to as “macros-baseddieting”. This IIFYM/macros-based dieting approachhas the purpose of allowing more dietary inclusionand variety versus an inflexible meal plan, and istherefore more consistent with flexible dietary controlthan rigid dietary control [23]. It should be noted thata macro based, “flexible” diet is not necessarily synonymous with flexible restraint, although it does havepromise to be more flexible then a diet with nosubstitutions.Recent research has shown the value and increasedlikelihood of weight loss success and long-term maintenance through adopting a flexible form of restraintwhile dieting [11–13]. Unfortunately, the current literature on this subject is limited in resistance-trainedpopulations. The primary purpose of this study wasto compare the effects of a flexible versus rigid dieting approach in this population. A secondary purposeof the current investigation was to observe weight regain in the post-diet period during an ad-libitumphase. To the best of our knowledge, this is the firstdietary intervention to investigate a flexible vs. rigiddiet and its effects on body composition and metabolism during a diet (active weight loss) phase and apost-diet (weight regain) phase in a non-obese,resistance-trained population.
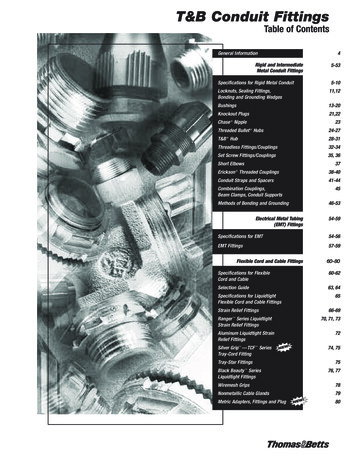
Conlin et al. Journal of the International Society of Sports NutritionMethodsA parallel-groups, repeated measures design was utilizedfor this investigation. A 20-week intervention consistingof a 10-week diet phase and a 10-week post-diet phasewas implemented. At baseline, participants werematched according to fat mass and then randomized tofollow either a flexible diet or an isocaloric and isonitrogenous rigid diet in conjunction with a resistance andaerobic training program for ten weeks followed by anadditional ten weeks of an ad-libitum diet. Participantsvisited the laboratory on five occasions: baseline, weeks5 and 10 (midpoint and end of diet phase); and twotimes during the post-diet/ad-libitum phase (weeks 16and 20; Fig. 1). Before each laboratory visit the participants were instructed to fast overnight and refrain fromphysical activity for the previous 24-hours. The primarydependent variables (DVs) of interest were body composition (fat-free mass [FFM], fat mass, and body fatpercentage). Secondary DVs included resting metabolicrate (RMR) and measures of eating behavior via the Eating Inventory, also referred to at the Three-Factor EatingQuestionnaire (TFEQ).ParticipantsThirty-nine healthy, resistance-trained subjects seekingto enhance their physiques were recruited forparticipation. Twenty-three males (n 10) and females(n 13) aged 18–39 (25.6 6.1 years; 170 8.1 cm;75.4 10.3 kg) completed all aspects of the intervention. Inclusion criteria required at least one year ofprior resistance training experience and a current engagement in a resistance training program for at leasttwo hours per week. All participants provided writteninformed consent and the Institutional Review Boardat the University of South Florida approved the studyprotocol (Pro00021377). Fig. 2 summarizes theparticipant study flow.Fig. 1 Overview of study phases and testing sessions(2021) 18:52Page 3 of 10Body Composition, Resting Metabolic Rate, andThree-Factor Eating QuestionnaireUpon entering the laboratory, participants urinated andthen had their body weight (BW) measured on a physician beam scale (Health-O-Meter, Model 402KL,McCook, IL, USA). Next, body composition was assessedusing the Body-Metrix BX-2000 A-mode ultrasound(IntelaMetrix, Livermore, CA) with a standard 2.5 MHzprobe according to procedures as previously described[24]. All body composition assessments were completedby the same technician whose calculated fat mass testretest reliability was: ICC 0.99; SEM 0.25 kg (2.6%); minimal difference 0.69 kg.After body composition assessments were completed,RMR testing procedures were conducted in a manner aspreviously described [25]. Intra and inter-day test-retestcorrelation calculated for the device used in the presentstudy were as follows: intra-day RMR Pearson correlation was r 0.96 (p 0.01) and the inter-day RMR Pearson correlation was r 0.90 (p 0.01). Intra-day RMRICC was 0.981 and the inter-day RMR ICC was 0.946.Following the RMR measurement, participants completed the Three-Factor Eating Questionnaire (TFEQ).The TFEQ is used to assess three dimensions of humaneating behavior—cognitive restraint of eating, disinhibition, and hunger [26]. Test-retest reliability was foundto be satisfactory for all three dimensions [26]. TheTFEQ was administered to each subject at baseline, afterthe dietary intervention (week 10), and upon the conclusion of the 10-week post-diet period (week 20).Dietary and Exercise InterventionPrior to baseline testing, participants tracked their typical diet for three days (including one weekend day) fordetermination of maintenance calories. Subjects wereinstructed to not change their eating habits while keeping the 3-day food record such that the average 3-daycaloric intake would serve as an estimaton of
Conlin et al. Journal of the International Society of Sports Nutrition(2021) 18:52Page 4 of 10Fig. 2 CONSORT participant flowmaintenance calories. Participants were placed on a dietthat prescribed a 25% reduction from their maintenancecalories. A moderate caloric deficit was chosen due tothe likelihood of participant adherence coupled with itseffectivenees to induce fat loss. Previous work from ourlaboratory (in a similar, resistance-trained population)implemented a 25% caloric deficit and resulted in favorable outcomes relative to body composition changes[25]. In some instances, there was a mismatch betweenreported maintenance calories and measured RMR (forexample, subjects were reporting caloric intakes lessthan their measured RMR values). In such cases, either a15% caloric reduction or a 1200-calorie diet was prescribed (whatever was higher in caloric intake wasassigned to the participant). This implementation ensured that no subject was prescribed a diet of less than1200 calories during the 10-week diet phase. These adjustments were evenly distributed among the two intervention groups (four subjects in each group).Participants were instructed to consume 2g protein/kgbody mass and to approximately split their remainingcalories evenly between fat and carbohydrate. Subjectswere matched according to fat mass and randomlyassigned to a flexible (FLEX) or rigid (RIGID) diet plan.The RIGID dieting group was given an individualized setmeal plan and were instructed to only eat foods thatwere included on their specific meal plan and to notmake food substitutions. All set meal plans were prepared by a registered dietitian and each subject was provided with a few sample meal plans to choose from ateach total daily caloric intake value. Table 1 provides anoverview of a sample meal plan for a participantassigned to the RIGID group. The FLEX group was provided with a comprehensive ebook on how to counttheir macronutrient intakes [27], and were subsequentlygiven macronutrient totals (listed as carbohydrate, protein, and fat grams) to consume each day during the 10week diet phase. Food choices were not restricted andparticipants were encouraged to eat a wide variety offood sources. In addition, participants completed a 3-dayfood record prior to each testing session. Participantswere instructed to continue their normal resistance andaerobic training during the study. Further, they wereinstructed to not change their typical exercise programsduring the investigation. Participants were instructed torecord the time (start time and end time) that they engaged in resistance training and aerobic training on atraining log.StatisticsDescriptive statistics (M SD) for all DVs were calculated. Nutrition data was analyzed via a 2 group (FLEX
Conlin et al. Journal of the International Society of Sports Nutrition(2021) 18:52Page 5 of 10Table 1 Sample menu plan for a 60-kg participant.Meal 1Carbohydrates (g)Protein (g)Fat (g)¾ cup egg whites12002 large whole eggs01291-ounce avocado2041.25 cups spinach1.5101-piece whole wheat toast1531½ of a medium sized banana12.500323614TotalMeal 24 ounces of chicken breast0201¾ cup sweet potato21101 cup broccoli6201 ounce of almonds4414312715TotalMeal 3¾ cup fat free Greek yogurt92301 tablespoon peanut butter4481 cup mixed berries1710302884 ounces of lean ground beef022111 cup romaine lettuce200½ cup tomato slices300TotalMeal 41 ounce of cheese169½ cup brown rice2421TotalTotal Calories (grams)303021492 (123g)484 (121g)522 (58g)Note: 1,500 calorie reduced diet sample menu is based on a 25% reduction from a 2000-baseline calorie maintenance levelvs. RIGID) 3 time (baseline, diet phase, post-dietphase) between-within factorial ANVOA. Body composition and RMR data was analyzed via a 2 group (FLEXvs. RIGID) 5 time (baseline, mid-point of diet phase,end of diet, mid-point post-diet phase, and end of intervention) between-within factorial ANOVA. Post-hoctests were conducted with independent samples t-testsby study phase (diet phase or post-diet phase) with appropriate adjustments for alpha levels for multiple comparisons. Baseline differences were analyzed via anindependent samples t-test and within-group changesover time were analyzed via a paired samples t-test. Foreach outcome, an effect size (ES) was calculated as thepretest-posttest change, divided by the pooled pretestSD. We analyzed data per-protocol rather thanintention-to-treat since our interest was in the effect ofthe intervention rather than its prescription. All analyseswere completed using SPSS (Version 22, IBM. Armonk,NY) software and the alpha criterion for significance wasset at 0.05.ResultsFor body composition and RMR data, a Shapiro-Wilk’stest [28, 29], skewness and kurtosis coefficients, and avisual inspection of their histograms, normal Q-Q plots,and box plots showed that the data were normally distributed (with the exception of diet phase fat mass lossin which skewness z score -2.6; kurtosis z score 2.33) [30]. Dietary intake and behavior data are summarized in Table 2. There were no significant differencesbetween the two diet groups for any dietary intake variable, with the exception of baseline total protein intake.However, when protein intake was adjusted relative tobody mass, this difference was negated. The caloric restriction was approximately 20% for both diet groups(20% and 17.7% for the FLEX and RIGID diet groups, respectively). No significant differences between the twodiet groups were observed for eating inventoryresponses.There were no significant baseline differences betweengroups on any measured body composition and RMR
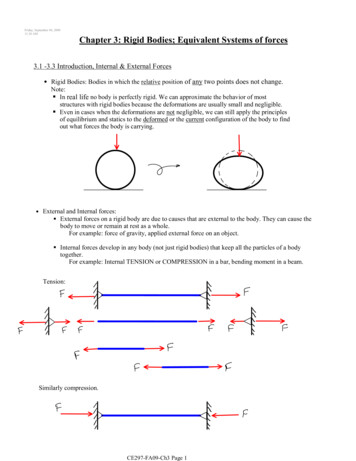
Conlin et al. Journal of the International Society of Sports Nutrition(2021) 18:52Page 6 of 10Table 2 Dietary intake and eating behavior dataFlexibleRigidBaselineDiet PhasePost-Diet PhaseBaselineDiet PhasePost-Diet Phase2289 7411827 453*2067 4331904 5041567 226*1721 318*Macronutrient DataKcalCHO (g)235 112153 44218 64181 74126 41168 54*PRO (g)137 39¶153 20148 37106 29¶133 40*125 2767 1984 3359 23*61 19Fat (g)Kcal/kg body mass**89 3667 2930 10*25 7*28 5*25 6***24 5*22 4*2.4 0.8*CHO (g/kg day)3.2 1.62.1 0.72.9 0.92.4 0.91.7 0.5PRO (g/kg day)1.8 0.42.1 0.22.0 0.31.4 0.51.8 0.5*1.8 0.4*Fat (g/kg day)1.2 0.50.9 0.40.9 0.31.1 0.40.8 0.40.9 0.2CHO/PRO/Fat 2Cognitive Restraint12.3 5.413.6 4.812.9 5.712.1 4.813.2 3.311.7 4.2Disinhibition6.2 3.06.4 3.56.1 3.56.1 3.06.0 3.25.4 2.8Hunger5.9 2.95.5 3.06.0 2.75.8 3.35.7 3.15.5 4.2TFEQCHO carbohydrate, PRO protein, TFEQ Three-Factor Eating Questionnaire¶Significant difference between groups at baseline (independent samples t test): p 0.05*Significant difference from previous time point (1-Way ANOVA): p 0.05variable. Both dietary conditions were effective for inducing weight loss/fat loss and maintaining FFM duringthe diet phase. However, during the ad-libitum post-dietphase the FLEX group experienced a significant increasein FFM compared to the RIGID group. Body composition and RMR data are summarized in Table 3 and Fig.3. There were no significant differences between the twogroups for total time engaging in resistance training andaerobic training. Specifically, the FLEX diet group engaged in resistance training for approximately 5 1.1hours/week during the diet phase and 4.5 1.6 hours/week during the post-diet phase while the RIGID groupengaged in resistance training for approximately 4.6 1.75 hours/week during the diet phase and 3.6 1.25hours/week during the post-diet phase. Relative to aerobic activity, the FLEX group completed approximately42 38 minutes/week during both the diet phase andpost-diet phase. The RIGID group engaged in aerobictraining for approximately 96 72 and 65 42 minutes/week during the diet phase and post-diet phase,respectively.DiscussionThis study examined the effectiveness of adopting a flexible versus rigid dietary approach to weight loss during a10-week diet phase in healthy, resistance-trained malesand females. Previous literature has shown that restrictive dieting leads to greater weight gain over time versusadopting a flexible dieting strategy [16, 18, 31, 32]. Theprimary finding of this study was that a flexible and rigiddiet were equally effective for inducing fat loss duringthe diet phase, but during the post-diet ad-libitumperiod, the flexible diet group experienced improvements in FFM that were not observed in the rigid dietgroup.There are few studies that have investigated nonoverweight, resistance-trained individuals undergoing aweight loss regimen for which to make comparisonswith our investigation. Garthe et al. [21] compared aslow and fast rate of weight loss in resistance trainingelite athletes during a similar length of time. Body composition changes were similar in the present investigation as compared to the resistance-training athletes inthe Garthe study. Garthe et al. [21] reported greaterlosses of fat mass and greater gains in FFM with a slowerrate of weight loss (0.7%/week) as compared to a fasterrate of weight loss (1.4%/week). The rate of weight lossfor the FLEX and RIGID groups combined was 0.4%/week. In addition to a slow rate of weight loss, weinstructed the subjects to ingest 2g of protein/kg bodymass per day during the diet phase. Mettler et al. [22]reported that there was a significantly reduced loss ofFFM with the ingestion of high protein intakes ( 2.3 g/kg day) compared with a control diet of 1.0 g/kg dayduring a short-term diet phase in resistance-trained athletes. The conservative rate of weight loss combinedwith the relatively high dietary protein consumptionlikely explains the favorable body composition changesobserved for both groups in the present study.There is an inverse curvilinear relationship betweeninitial body fat content and the proportion of weight lossconsisting of lean tissue [33]. It is anticipated, therefore,
Conlin et al. Journal of the International Society of Sports Nutrition(2021) 18:52Page 7 of 10Table 3 Body Composition and Resting Metabolic Rate (M SD) for Diet Phase and Post-Diet PhaseFLEXIBLE (n 11)RIGID (n 12)Diet PhasePreMidPost (95% CI)ESPreMidPost (95% CI)ESBody Weight (kg)76.1 8.474.2 8.473.5 8.8*-2.6(-3.6; -1.5)0.3074.9 12.273.0 11.571.9 11.7*-3.0 (-5.2; -0.8)0.25FFM (kg)61.3 11.361.1 10.561.0 10.4-0.3(-1.7; 1.0)0.0356.8 10.757.1 11.057.0 10.8 0.2(-1.1; 1.5)0.02Fat Mass (kg)14.8 5.713.1 5.612.5 5*-2.3(-3.3; -1.2)0.4318.1 6.215.9 6.514.9 6.5*-3.2(-4.7; -1.6)0.50Body Fat (%)19.4 8.517.9 7.917.0 7.1*-2.4(-4.1; -1.1)0.3124.0 6.221.8 7.320.7 7.1*-3.3(-4.5; -2.0)0.50RMR (kcals/day)1816 2291805 1691827 257 11(-112; 134)0.051576 3501631 3771649 375 73(-83; 231)0.2PreMidPost (95% CI)ESPreMidPost (95% CI)ESpBody Weight (kg)73.5 8.874.1 9.775.2 9.8* 1.7(0.2; 3.2)0.1871.9 11.772.4 10.872.3 11.6 0.4(-0.9; 1.9)0.030.461FFM (kg)61.0 10.461.6 10.862.7 11.3* 1.7(0.8; 2.7)0.1657.0 10.856.8 10.356.3 10.5-0.7(-1.6; 0.2)0.070.037Fat Mass (kg)12.5 5.012.5 4.412.5 4.40(-1.1; 1.1)014.9 6.515.6 6.416.0 6.4* 1.1(0.1; 2.1)0.170.562Body Fat (%)17.0 7.117.2 6.417.0 6.60(-1.5; 1.0)020.7 7.121.6 7.222.1 6.8* 1.3(0.03; 2.7)0.190.338RMR (kcals/day)1848 2611850 2791983 396 135(-8; 278)0.391649 3751749 4071755 387 106(-11; 222)0.280.488Post-Diet PhaseFFM Fat-free mass, Post – Pre, CI confidence interval, ES Cohen’s d effect size, RMR, resting metabolic ratep 2x5 group x time interaction (post-hoc analysis revealed differences between the diet groups were during the post-diet phase only)*Significantly different from pre-measures (p 0.05)that a change in weight for a lean individual would elicita larger relative change in FFM than would be the casefor an obese person. Given the relatively lean status ofthe participants in the current study, it could be expected that composition of body weight lost would becomprised of relatively higher losses in FFM ( FFM/ BW). In contrast, with both groups combined, the lossof body mass was almost entirely accounted for by theloss of fat mass (98% of the body mass lost was from fatFig. 3 Individual participant changes in fat mass and fat-free massmass). This was similar to the combined (slow and fastrate of weight loss) groups from the Garthe et al. [21] investigation in which they observed a body recomposition(all of the weight lost was from fat mass stores and therewas a trivial gain of FFM). Our results were also comparable to two other studies in which resistance-trainedindividuals consumed relatively high dietary proteinwhile in a caloric deficit [22, 34]. Specifically, body fatmass reductions consisted of 67% and 80% of total body
Conlin et al. Journal of the International Society of Sports Nutritionmass lost as reported by Pasiakos et al. [34] and Mettleret al., [22], respectively. The preferential reduction of fatmass and the preservation of fat-free mass was likely dueto the relatively high protein intake, the slow rate ofweight loss, and the inclusion of a resistance trainingprogram throughout the diet phase.The only observed body composition difference between the two dietary groups was during the post-diet/ad-libitum phase in which the FLEX group gained significantly more FFM as compared to the RIGID group.Of those completing the post-diet phase, 10 of 11 (91%)subjects in the FLEX diet group gained FFM, as compared to only 3 of 12 (25%) subjects in the RIGID dietgroup. Unfortunately, we do not have a strong hypothesis to offer for this observation. There were no significant differences in dietary intakes between the two dietgroups during the post-diet/ad-libitum phase. Similarly,there were no significant differences in the amount oftime spent resistance and aerobic training during thesame time period. While the amount of time engaging inthese exercise modes did not significantly differ betweenthe groups, unfortunately we did not collect data relativeto the intensity of the loads lifted during the resistancetraining sessions. It is possible that differences in therelative intensities differed between the groups whichmay have accounted for some of the difference in fatfree mass that was observed.Another possible explanation is the connection between dietary restraint and psychological distress [35].Bartholomew et al. [36] reported that high life stressmitigates a person’s ability to adapt to resistance training. It is possible that the participants assigned to theRIGID group experienced greater levels of stress by having to adhere to a limited dietary intake pattern, therebycompromising their ability to adapt to the resistancetraining program. In a male bodybuilder case study, itwas reported that a rigid approach adopted during theweight loss phase preceded elevations in mood disturbance scores in the post-diet phase [37]. It is important tonote that our investigation did not measure psychological distress or mood disturbance, and at this timeour recognition of this possible link is theoretical untilmore research can be conducted into this area.There were no significant differences in resting metabolic rate between the two groups, suggesting that aslong as the caloric restriction is not severe, that relativelyhigh protein is consumed, and resistance training is performed — adverse metabolic adaptations can be minimized regardless of a flexible or rigid dietary approachto caloric restriction [38–40]. Both treatment groups displayed high levels of cognitive restraint during the dietphase. Cognitive restraint measures conscious attemptsto monitor and regulate food intake. Prior research insedentary, overweight females identified cognitive(2021) 18:52Page 8 of 10restraint (among other factors) as the most predictivefactor of weight change [16]. Disinhibition scores werelow for both groups. This dimension of eating behaviorassesses uncontrolled eating in response to emotionalcues. Hunger scores slightly decreased (non-significantly) in both diet groups. This dimension measure
attitudes toward dieting, while ultimately (negatively) in-fluencing their weight; while flexible control typically represents a more moderate approach to those behav-iors. Individuals adopting rigid control of their diet will eliminate “forbidden” foods from their daily food inta