Transcription
STATISTICALTABLESCumulative normal distributionCritical values of the t distributionCritical values of the F distributionCritical values of the chi-squared distribution C. Dougherty 2001, 2002 (c.dougherty@lse.ac.uk). These tables have been computed to accompany the text C. Dougherty Introduction toEconometrics (second edition 2002, Oxford University Press, Oxford), They may be reproduced freely provided that this attribution is retained.
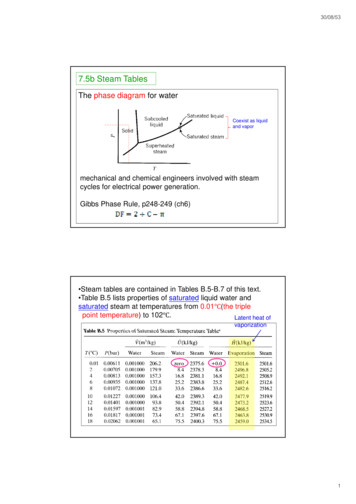
STATISTICAL TABLES1TABLE A.1Cumulative Standardized Normal DistributionA(z) is the integral of the standardized normaldistribution from to z (in other words, thearea under the curve to the left of z). It gives theprobability of a normal random variable notbeing more than z standard deviations above itsmean. Values of z of particular 3-2-101 z23A(z)0.95000.97500.99000.99500.99900.9995Lower limit of right 5% tailLower limit of right 2.5% tailLower limit of right 1% tailLower limit of right 0.5% tailLower limit of right 0.1% tailLower limit of right 0.05% .99900.99930.99950.99970.99980.9998
STATISTICAL TABLES2TABLE A.2t Distribution: Critical Values of tSignificance levelDegrees offreedom.Two-tailed test:One-tailed 073.1043.3103.307 1.6451.9602.3262.5763.0903.291
STATISTICAL TABLES3TABLE A.3F Distribution: Critical Values of F (5% significance level)123456789101214161820v1v21 161.45 199.50 215.71 224.58 230.16 233.99 236.77 238.88 240.54 241.88 243.91 245.36 246.46 247.32 248.012 18.51 19.00 19.16 19.25 19.30 19.33 19.35 19.37 19.38 19.40 19.41 19.42 19.43 19.44 19.453 10.13 9.55 9.28 9.12 9.01 8.94 8.89 8.85 8.81 8.79 8.74 8.71 8.69 8.67 8.664 7.71 6.94 6.59 6.39 6.26 6.16 6.09 6.04 6.00 5.96 5.91 5.87 5.84 5.82 5.805 6.61 5.79 5.41 5.19 5.05 4.95 4.88 4.82 4.77 4.74 4.68 4.64 4.60 4.58 1.651.621.621.611.591.581.58.
STATISTICAL TABLES4TABLE A.3 (continued)F Distribution: Critical Values of F (5% significance level)v1 25303540506075100150200v21 249.26 250.10 250.69 251.14 251.77 252.20 252.62 253.04 253.46 253.682 19.46 19.46 19.47 19.47 19.48 19.48 19.48 19.49 19.49 19.493 8.63 8.62 8.60 8.59 8.58 8.57 8.56 8.55 8.54 8.544 5.77 5.75 5.73 5.72 5.70 5.69 5.68 5.66 5.65 5.655 4.52 4.50 4.48 4.46 4.44 4.43 4.42 4.41 4.39 221.221.201.201.19.
STATISTICAL TABLES5TABLE A.3 (continued)F Distribution: Critical Values of F (1% significance level)v1 1v21 4052.182 98.503 34.124 21.205 16.26678910234567891012141618204999.50 5403.35 5624.58 5763.65 5858.99 5928.36 5981.07 6022.47 6055.85 6106.32 6142.67 6170.10 6191.53 3927.3514.6610.1699.40 99.42 99.43 99.44 99.44 99.4527.23 27.05 26.92 26.83 26.75 26.6914.55 14.37 14.25 14.15 14.08 14.0210.05 9.89 9.77 9.68 9.61 9.5513.75 10.9212.25 9.5511.26 8.6510.56 8.0210.04 2.022.021.961.961.951.911.901.90.
STATISTICAL TABLES6TABLE A.3 (continued)F Distribution: Critical Values of F (1% significance level)v1 25303540506075100150200v21 6239.83 6260.65 6275.57 6286.78 6302.52 6313.03 6323.56 6334.11 6344.68 6349.972 99.46 99.47 99.47 99.47 99.48 99.48 99.49 99.49 99.49 99.493 26.58 26.50 26.45 26.41 26.35 26.32 26.28 26.24 26.20 26.184 13.91 13.84 13.79 13.75 13.69 13.65 13.61 13.58 13.54 13.525 9.45 9.38 9.33 9.29 9.24 9.20 9.17 9.13 9.09 331.321.301.291.28.
STATISTICAL TABLES7TABLE A.3 (continued)F Distribution: Critical Values of F (0.1% significance level)v1 1v21 4.05e052 998.503 167.034 74.145 47.18234567891012141618205.00e05 5.40e05 5.62e05 5.76e05 5.86e05 5.93e05 5.98e05 6.02e05 6.06e05 6.11e05 6.14e05 6.17e05 6.19e05 .5913.81 11.56 10.3512.97 10.80 9.6312.31 10.21 9.0711.78 9.73 8.6211.34 9.34 432.412.422.392.372.342.33600 10.94750 10.911000 .402.392.382.322.312.30.18.69 18.41 17.99 17.68 17.45 17.27 17.1214.33 14.08 13.71 13.43 13.23 13.06 12.9311.77 11.54 11.19 10.94 10.75 10.60 10.4810.11 9.89 9.57 9.33 9.15 9.01 8.908.96 8.75 8.45 8.22 8.05 7.91 7.80
STATISTICAL TABLES8TABLE A.3 (continued)F Distribution: Critical Values of F (0.1% significance level)v1 25v21 6.24e052 999.463 125.844 45.705 25.083035405060751001502006.26e05 6.28e05 6.29e05 6.30e05 6.31e05 6.32e05 6.33e05 6.35e05 23.956 16.85 16.67 16.54 16.44 16.31 16.21 16.12 16.03 15.93 15.897 12.69 12.53 12.41 12.33 12.20 12.12 12.04 11.95 11.87 11.828 10.26 10.11 10.00 9.92 9.80 9.73 9.65 9.57 9.49 9.459 8.69 8.55 8.46 8.37 8.26 8.19 8.11 8.04 7.96 7.9310 7.60 7.47 7.37 7.30 7.19 7.12 7.05 6.98 6.91 1.411.401.38.
STATISTICAL TABLES9TABLE A.4χ2 (Chi-Squared) Distribution: Critical Values of χ2Significance levelDegrees 588
STATISTICAL TABLES 1 TABLE A.1 Cumulative Standardized Normal Distribution A(z) is the integral of the standardized normal distribution from to z (in other words