Transcription
GuideIntroduction to Qualitative Data Analysis
Guide to Qualitative Data AnalysisFirst Person Consulting Pty LtdABN 98 605 466 797P: 03 9600 1778E: admin@fpconsulting.com.auW: www.fpconsulting.com.aui
Guide to Qualitative Data AnalysisTable of Contents12Introduction to data analysis . 11.1Overview . 11.2Structure of the Guide . 2Qualitative data analysis . 32.1Overview . 32.2Thematic analysis . 32.3Use of longer comments . 82.4Next step – into a report . 9Appendix 1Qualitative analysis worksheet . 10Appendix 2Example vignettes . 12Appendix 3Analysed and interpreted qualitative data . 13List of TablesTable 1: Example Table results . 7Table 2: What participants thought of the event . 13List of FiguresFigure 1: Sources of qualitative data . 1Figure 2: Coding of an interview transcript . 5Figure 3: Example themes in Excel. 5Figure 4: Coded data in Excel . 6Figure 5: Example graph . 8ii
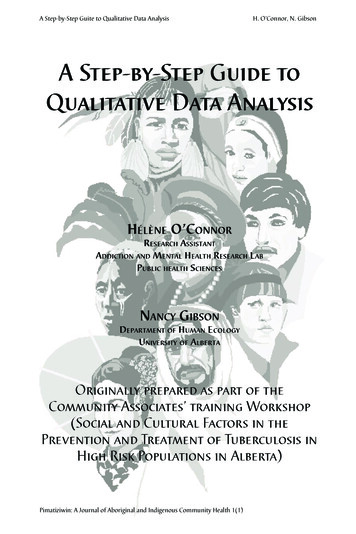
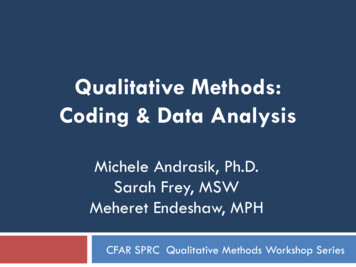
Guide to Qualitative Data Analysis1Introduction to data analysis1.1OverviewThere are two types of data – qualitative and quantitative. For the purposes of this guide theemphasis is on qualitative data, that being – words, pictures, sound and movement. Qualitative datatends to come from people; however, depending on the nature of your work it could also come fromthe built and natural environment.Data from people tends to come from three main areas:1. questions2. observations3. materials (i.e. documents and literature)For more on these see Figure 1 below.Figure 1: Sources of qualitative dataQualitative data can provide a variety of rich insights and alternative perspectives into your project.Oftentimes these insights can provide ideas on ways that your project can improve or where it hasmade an impact on participants.The purpose of this guide is to provide an introduction to Qualitative Data Analysis that can be usedby individuals and organisations. This is an introductory guide only and contains a selection ofapproaches that are most likely to be useful to people undertaking relatively simple data analysis.As we are focused on qualitative data in this guide, we are not examining the ‘numbers’ of thingsthat are being captured through your project, that being: number of events held or people attending the event ‘reach’ data – i.e. people who have been engaged in some way by your project survey scaled questions (i.e. the 1-to-5 style questions)1
Guide to Qualitative Data AnalysisIt is anticipated that the qualitative data you gather will be a valuable and worthwhile supplement tothese hard figures. Ultimately, the purpose is to help tell the ‘story’ of your project and this guidewill help with that.1.2Structure of the GuideThe content of this guide is focused on exploring some common qualitative data analysis techniques,followed by ways of representing this analysis. As noted this is not a comprehensive manual, ratherjust an introductory guide.The exercises that are undertaken during the meeting are also provided as Appendices.2
Guide to Qualitative Data Analysis2Qualitative data analysis2.1OverviewNormally decisions about the analysis method to use are made at the same time as identifying thedata sources (i.e. where you are getting your information from) and data collection methods (i.e.how you are going to collect that information). As such, the analysis methods will usually depend on: the questions you are looking to answer the type of data (qualitative or quantitative) the format the data comes in how much data is available how the results will be used staff skills, time and resources available.As noted, for the purposes of this guide, we are focusing on what we feel are the ‘standard’ types ofqualitative data that funded projects are likely to be gathering. This includes: formal and informal interview data (i.e. with participants, stakeholders or other parties) observations of participants at events you are holding or facilitating project notes and records that have been kept.Analysing qualitative data involves ‘making sense’ of the data collected. The processes used are lessprescriptive and structured; however, the importance aspect is to be transparent about theapproach you have used so that anyone reading your report can understand how you obtained yourfindings.2.2Thematic analysisThere are a lot of different ways that qualitative data can be analysed. We envisage that mostprojects will focus on using thematic analysis. There are lots of other analysis approaches, some ofwhich may be relevant to individual projects, but for the sake of this guide we will focus on thematicanalysis.Thematic analysis looks at the content of the material – the ‘what is said’. There are two approachesto this analysis which are either ‘deductive’ or ‘inductive’. Deductive approaches typically work fromthe top down (i.e. you have a theory or hypothesis to test with specific data). Inductive approacheswork from the ground up, whereby you collect your data and look for patterns or themes and out ofthis develop your theory.Additionally, when conducting an evaluation of your own project interpretation of your recordsthrough a reflective process can also supplement the data you have collected and provide contextfor your findings. For instance, participants may have been dissatisfied with a component of yourworkshop; however, there may have been a reason for that component occurring the way it did. Bycombining these you can arrive at a more holistic picture of the workshop.This analysis process usually involves the following steps: familiarising yourself with the data (i.e. reading through it)3
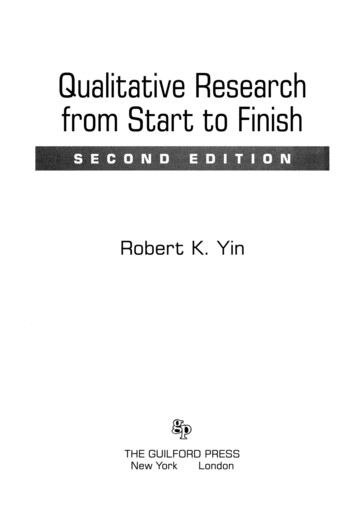
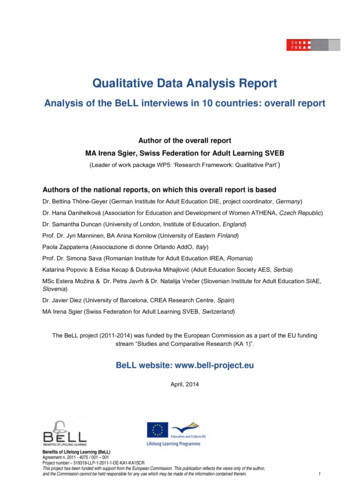
Guide to Qualitative Data Analysis sorting the data into themes or areas of inquiry sorting into themes going back over the data and potentially consolidating into larger themes again confirming findings (you might have a colleague review what you have done to see if theyagree)These steps are explored in more detail below.2.2.1 Familiarise yourself with the dataRead the data carefully to become familiar with the range of comments made. During this time,make notes and annotations about common themes that appear to be emerging. This is often easierif you have collected the data yourself. Using other people’s data will require some additional timefor you to become familiar with its content.2.2.2 Theming the dataOnce you are familiar with the range of comments the next step is to start sorting into categories or‘themes’. Initially you may want to sort into broader categories to help reduce the diversity ofcomments you are faced with. This depends on whether you are trying to answer a specific questionor just to get a general idea of what people are saying.Example broad categories could include: negative or positive comments (i.e. they are happy or unhappy about something) comments about things they learned or feel comments about new skills they have learned comments about things they are going to do differently.These broad categories can then be broken down into more specific themes (for example, thedifferent type of skill learned). Some data will fit into several categories and some into no obviouscategory.If you have data that does not fit neatly into a category it could still be presented on its own as asingle comment or if there are two or three like this then create an ‘other’ category.Depending on the format that the data comes in you might use a couple of different tools. Forexample, if you conducted interviews with some of your project partners you might like to gothrough their interview transcripts and colour code responses (Figure 2).4
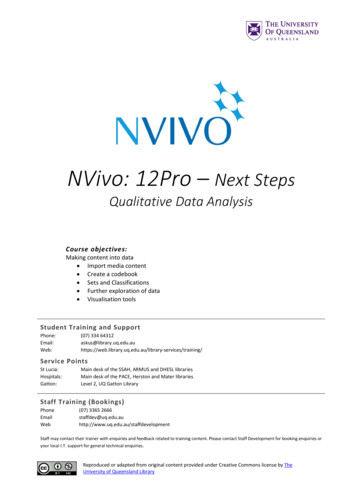
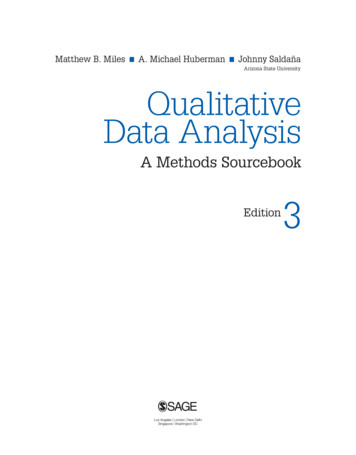
Guide to Qualitative Data AnalysisYellow - Improvements to farm managementFigure 2: Coding of an interview transcriptBlue - evidence of learningPink - evidence of interaction and communicationThis process can be iterative as new themes or categories emerge as you analyse the data.During each iteration you can then double-check the data that you’ve allocated into acategory to see if you still think it fits.A similar method to the above can apply in Microsoft Excel, where you instead create youcategories across the top in a new column (for example, Figure 3).There are also pieces of software that you can use, though usually these are quite expensive.Most of the time, particularly if you do not have a significant amount of data, Excel is morethan enough.Figure 3: Example themes in Excel2.2.3 Organising your dataOnce you feel comfortable with your themes the next step is to determine how manycomments were made that fit within each theme. This can be done concurrently with the5
Guide to Qualitative Data Analysisprevious step and is a good way to make sure your themes are accurate. It also makes yourdata analysis process more transparent by allowing a colleague to check your theming to seeif they agree/disagree.Using Excel you can simply note a ‘1’ in each cell. This allows you to simply sum up howmany comments were made under each theme (Figure 4).Figure 4: Coded data in Excel2.2.4 Representing your themesThe next step is to represent the data that you have coded. Two of the simplest ways are throughgraphs and tables (these are what will be in the results section of a report). These types ofrepresentation help summarise the qualitative data you have gathered by showing the main themesor categories you have found for a question through your analysis.It is important to always refer to the tables and graphs in the text to explain the contents.Additionally, rather than explaining each component of the table or graph consider asking yourselfthe question:What is the most important or interesting thing (or two things) about these results?6
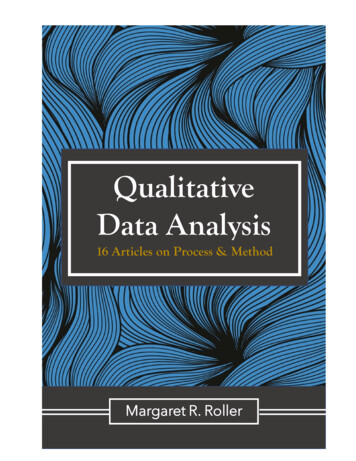
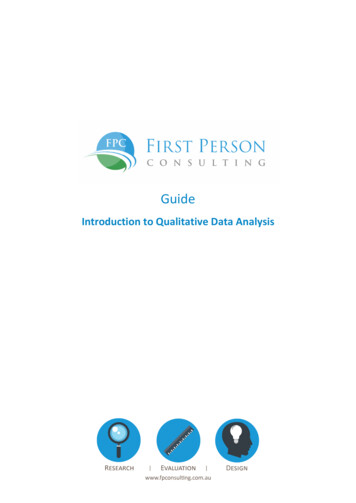
Guide to Qualitative Data AnalysisAs an example, participants in a workshop were asked to provide feedback on their experience. Asyou can see in the example below (Table 1), eight respondents indicated that the workshop was agood use of their time. However, three respondents felt that the speakers were not very engaging.Table 1: Example Table resultsThemeNumber of respondentsGood use of time8Evidence of learning4Speakers not very engaging3Inappropriate venue2Other2This type of broad overview is valuable because it can show very quickly the most important aspectsof the feedback received, as well as where potential improvements could be made.You will also note that there is an ‘other’ comment. Sometimes we will include these in the mainbody of text, so that anyone reading the report can see what it is. The ‘other’ comments in thisinstance were:The booking system was not very intuitiveI was late to the event because the car park was full.So, while not about the event specifically, it still relates to the respondent’s overall experienceassociated with the workshop and may be a useful insight. Sometimes when the comment is notrelevant you can just remove it from your analysis – it all depends on the question and the response!More involved analysis might look at a respondent’s responses to multiple questions (for example, ifthey didn’t enjoy the speakers, did they make any comments as to why in answer to a differentquestion?).Graphs can also be used to show the same data (Figure 5).7
Guide to Qualitative Data AnalysisNumber of respondents988765443322210Good use of timeEvidence of learning The speakers were Inappropriate venuenot very engagingOtherFigure 5: Example graphFinally, if there are particularly insightful comments that you have used in your themes, you mightlike to include these as a supplement underneath your graph or table to provide some further insightinto your analysis.Example qualitative data to try a theming exercise is provided in Appendix 1.2.3Use of longer comments2.3.1 QuotesAs noted above, sometimes respondents may have particularly insightful or powerful comments thatyou feel illustrate the outcomes or impact of your project. In instances such as this, you can includethem in the body of your report (usually as a supplement to a table or graph, but not always).Usually these would be indented and italicised to indicate they are direct quotes. As we arecollecting data anonymously you would not use an individual’s name, but might note their role orposition. For example:I really learned a lot at the workshop. Some of the speakers had some really interestinginsights that I think I can apply to some of the work I do – particularly among CALDcommunities. (Community Development Worker)8
Guide to Qualitative Data Analysis2.3.2 VignettesAnother way to represent longer comments or responses is through a vignette. A vignette isgenerally a short description (no more than half a page) that illustrates a key finding, lesson orachievement – usually as an example of something ‘significant’.A vignette is distinct from a quote in that it includes the context or broader story (whereas a quotein a report will usually requite context from the report writer).The format or structure of a vignette consists of: Context – who, where and what is the story? Situation/problem – what was the problem or issue that it illustrates Response – what action was taken / what was the result? Learning/result – what can be learned from what occurred?This is just the broad structure, and each component is not a strict requirement. Ultimately avignette captures an example of ‘something’ and provides the context along with it. Sometimesyou’ll see these in reports in a ‘box’ (see Box 1 for an example).A lack of formal networks was identified as a problem by financial counsellors. A governmentagency decided to run a series of small group discussions with them to unpack this problem.It became apparent through this that it was not a lack of ‘networks’, but rather uncertainty over‘who to talk to’ was actually the problem.Following these discussions, funding was allocated to implement a biannual forum for financialcounsellors to meet and discuss their experiences.The first forum is organised for December and is already booked out at the time of writing.Members have indicated a chance to share their experience as the most important feature.Box 1: Example vignette from a reportA vignette could also be useful when telling a story or specific instance about an individual orparticipant in the Program. Again, confidentiality is important, so you can change their name bygiving them an alias.It is also worth asking their permission so that they know their example will be used in this way (as acourtesy to them).More example vignettes are provided in Appendix 2.2.4Next step – into a reportOnce your qualitative data is analysed the next step is to integrate into your report. Suggestions onhow this is done have been provided throughout this guide. We have provided an example of what afinal piece of analysed and interpreted qualitative data looks like in Appendix 3.9
Guide to Qualitative Data AnalysisAppendix 1Qualitative analysis worksheetOverview:A state government department has funded a pilot Professional Development project for six monthsfor project officer-level staff in community-led organisations. These staff were assigned to smallgroups along with a Project Mentor. The goal was to build their knowledge and skills in key areasidentified by the community organisations. Following completion of the pilot the involved projectofficers were asked to suggest improvements for future iterations of the project.Steps:1. Read through the enclosed comments and become familiar with the range of commentsmade. During this time make any notes about common themes or categories that you feelare emerging.2. Once you have an idea of what the common themes might be, sort the data out into broadercategories. For instance – are there different types of suggested improvements?3. Note that some responses can also fit into multiple categories. Often you will find that this isthe case with qualitative data. If there is no obvious category or the comment does not fitthen keep it by itself at this stage.4. Often this process can be iterative, particularly when you have lots of data, meaning thatyou may identify new themes as you go.10
Guide to Qualitative Data AnalysisFocus more on engaging new organisations to expand the reach of the project - it would be goodto know who else is out there.There needs to be more resourcing focusing on building the skills of the staff involved - at times Ifelt like I knew more than they did!Hire more staff to be involved in the project - it seems like their capacity to engage us is quite lowat timesHaving more staff to help us more with our deliverables would be goodI can't think of anythingNone - it's a good project!The project's given me some good tools that I can take back to my own workplace. The onlyimprovement I can see is to schedule the meetings during more convenient times so thateveryone can attend.I didn't see much value in the group sessions - I preferred the one-on-one interactions with mystaff member. The people in my group seemed to know more than I did so it was a bitintimidating to be with them.I really enjoyed the site visits to other organisations. More of those in the future!Providing more opportunities to network among the other organisations that are involved wouldbe good.More of the expert guest speakers - it's great to hear what's 'current' thinking out there!They need more funding to continue this project - it's been invaluable to me!It would be good to see the individual skills and experience of each of the project staff more perhaps rotate the project staff among the groups? My staff member was good but I'd like tohear from the others.No - I think the project was really well run overall.Maybe instead of all day meetings splitting it up into half day sessions? Seems like it's too riskyand you can easily miss a session.I don't think it was clear enough the role of the project's staff - were they meant to mentor us oract as a bit of a sounding board? I wasn't too sure at times - particularly at the start.I'm not sure this was pitched at the right level - most of us are project officers but it seems like itmight be more suited to managers?I had a great time!N/ANoYes - more muffins during the breaks! They kept running out.The sessions were excellent - the staff really know their stuff!Not sure it was worth my time - I learned a bit but the staff barely knew more than I did at times.11
Guide to Qualitative Data AnalysisAppendix 2Example vignettesInsta-Knowledge: Providing the community with informed choicesA state government road authority found that community members struggled to identify the bestroads to take, particularly during emergencies, but also during times of construction and roadmaintenance. As a result a real-time web-based map of road closures was developed to provide anear-instance mechanism for information delivery to the community. This allows the community touse the information to make an informed decision on the best, and safest, route to take.This system was launched in December, 2015 following eight months of development. Websiteanalytics indicate that emergency services are the most frequent users of the website;demonstrating the importance of the information this service provides. The site is also available as asmartphone application – further increasing its accessibility.The response from the public has been positive indicated by the number of visits to the website.During the most recent floods there were more than 250,000 hits on the website. Further positivefeedback on the sites usefulness has been made through comments on the website and phone callsto the road authority control centre.Educating workers in the small group settingIn response to a lack of information available to community development workers at the time, theCommunity Development Team in a government agency decided to run a series of low-key, informal(un-advertised) small group discussions on utilising our worker networks. The discussions were heldwith small groups (5-20) using butcher’s paper in worker-friendly environments such as communitycentres.At one particular meeting, there were present a number of members of a group who had been quitevocal in their opposition to reform of an existing program. While the presentation did notnecessarily sway their opinions, the group acknowledged the work of the Community DevelopmentTeam and endorsed the new program model. One of their key staff noted that he had “been to 50meetings on this stuff” and this was the most worker-centric presentation he had seen.From my (the Program Manager’s) point of view, I believe the Team is developing credibility as alead agency in delivering reform information. Community development workers seem to prefer tohave information delivered by local officers with whom there is already a level of trust and rapport.The smaller groups (as opposed to larger seminars) allowed for more interaction from individualparticipants which were also felt to be very valuable.12
Guide to Qualitative Data AnalysisAppendix 3Analysed and interpreted qualitative dataPlease note this is an example only.An event was held with 30 project workers to explore the latest thinking around prevention incommunities. Four guest speakers were organised from both the academic and practitioner sectors.Attendees were asked through a follow-up survey what they thought about the event. The resultsare provided in Table 2.Table 2: What participants thought of the eventThemeNumber of respondentsGood use of time8Evidence of learning4Speakers not very engaging3Inappropriate venue2Other2As can be seen, eight out of the 30 respondents felt the event was a good use of their time. Fourparticipants felt they learned something from the event. For example:It was great to hear from the two academics on their research – it really highlights thatsometimes we don’t always know the latest thinking out there. I really learned a lot!However, three respondents felt that the speakers were not very engaging. The other commentsnoted focused on the ineffective booking system and the lack of car parking at the space.13
Guide to Qualitative Data Analysis 3 2 Qualitative data analysis 2.1 Overview Normally decisions about the analysis method to use are made at the same time as identifying the data sources (i.e. where you are getting your information from) and data collection meth