Transcription
Live @ 9am Central Time
2Guide to Surviving and Thrivingin Extreme Volatilitywith Don Kaufman
3Risk Disclosure We Are Not Financial Advisors or a Broker/Dealer: Neither TheoTrade nor any of its officers, employees, representatives,agents, or independent contractors are, in such capacities, licensed financial advisors, registered investment advisers, orregistered broker-dealers. TheoTrade does not provide investment or financial advice or make investmentrecommendations, nor is it in the business of transacting trades, nor does it direct client commodity accounts or givecommodity trading advice tailored to any particular client’s situation. Nothing contained in this communication constitutesa solicitation, recommendation, promotion, endorsement, or offer by TheoTrade of any particular security, transaction, orinvestment. Securities Used as Examples: The security used in this example is used for illustrative purposes only. TheoTrade is notrecommending that you buy or sell this security. Past performance shown in examples may not be indicative of futureperformance. Return on Investment “ROI” Examples: The security used in this example is for illustrative purposes only. The calculationused to determine the return on investment “ROI” does not include the number of trades, commissions, or any otherfactors used to determine ROI. The ROI calculation measures the profitability of investment and, as such, there arealternate methods to calculate/express it. All information provided are for educational purposes only and does not imply,express, or guarantee future returns. Past performance shown in examples may not be indicative of future performance. Investing Risk: Trading securities can involve high risk and the loss of any funds invested. Investment informationprovided may not be appropriate for all investors and is provided without respect to individual investor financialsophistication, financial situation, investing time horizon, or risk tolerance. Options Trading Risk: Options trading is generally more complex than stock trading and may not be suitable for someinvestors. Granting options and some other options strategies can result in the loss of more than the original amountinvested. Before trading options, a person should review the document Characteristics and Risks of Standardized Options,available from your broker or any exchange on which options are traded. No part of this presentation may be copied, recorded, or rebroadcast in any form without the prior written consent ofTheoTrade . No Soliciting. No Recording. No Photography.
Copyright 2019 TheoTrade, LLC. All Rights ReservedCopyright DisclaimerAll rights reserved. This Material may not be reproduced or distributed, in whole or inpart, without prior written permission of TheoTrade, LLC. Any other reproduction ordistribution, in whatever form and by whatever media, is expressly prohibited withoutthe prior written consent of TheoTrade, LLC. For further information, please contact:TheoTrade, LLC16427 North Scottsdale Rd. # 410Scottsdale, Arizona 85254Telephone: 1-800-256-8876Email: support@theotrade.com
515 years I watched order-flow I grew up around traders and started trading in the late ‘90’s. I went on to work with thinkorswim and TD Ameritrade from 2001 to 2015. In that time, I built and ran education for both firms, and more importantly, had access tothe largest retail order flow in the industry. What’s watching order flow? Well, that means I had access to everything you did. We studied trades and we know what works and what does not. What you learn here comes from watching billions of mistakes and the knowledge of whatworks best for retail traders.Don Kaufman
6
7TheoTrade can Prepare You for Volatility
8Check your baggage at the door Please set aside any preconceived notions on what you “think” can happen in themarkets. When Volatility hits markets, your Risk must be in check. Good risk management starts with the perception that anything can and will occur. Prepare yourself for any event: How hard can this be? The markets can move up,down or sideways
9Getting Started, VolatilityFollow these ideas or suffer the consequences!
10Before you Trade in Volatility, KNOW THIS Before running head-on into trading Volatility, the following concepts are essential: Trading can be challenging enough for a newbie; however, wild swings in themidst of volatility can only complicate matters. Take the following seriously: YOU need to know these concepts BEFOREstepping foot in the deep end of the pool!
11Size Matters If you are used to trading in a 10% VIX, what is the first thing you should consider when volatility spikes?Higher volatility directly implies you are getting more movement in individual stocksor the overall market.The bright side is you get more bang for your buck.Cut your trading size in accordance with increased movement in the markets.If volatility doubles, you can literally trade HALF the size and still maintain thesame profit and loss swings.
12Stop Orders Work (all too well) Yes, stop orders work but maybe a little too well. In periods of heavier volatility, youMUST consider that the probability of being stopped out has greatly increased. Stop orders (if utilized) must be placed farther away from the underlyinginstrument. Use expected move (detailed in this presentation) to help you determine viableplacement for stop orders. As the stop order is placed farther away from the underlying price, you are left withmore risk. You MUST cut your trading size in a more volatile marketplace.
13Liquidity Matters Trade liquid markets. Liquidity tends to concentrate in limited products during episodes of intensevolatility. Bid / Offer spreads will widen out even in the most liquid products. You may not be able to “get out” when you absolutely need to get out. Never place yourself in the position of needing to get out. And yes, I’m talking toYOU Iron Condor Sellers!
14The Volatility CRUSH In the midst of volatility, you may be so inclined as to want to purchase a call option thinking the market may rally.The markets may indeed rally; however, you may not profit due to the impendingvolatility crush.As markets rally, volatility gets crushed (especially after large down moves).Buying at the money or out of the money calls is a serious mistake as it leaves youexposed to significant volatility risk.If you are intent on buying options, use a .85 delta or higher in order to avoidvolatility risk on the option. Don’t get VOL CRUSHED! You have been warned.
15Vertical Spreads Buying or selling vertical spreads can and will mitigate your volatility exposure inthe event you want to want to go long the markets. For example:
16Expected MoveKnow what volatility can throw your way!
17Options depict risk and risk Volatility Options pricing can be extrapolated into stock price movement. Options markets can be thought of as putting a price tag on risk. Pricing in markets is determined via market participants. Ultimately, options pricing comes down to supply and demand. Competition breeds efficiency in pricing.
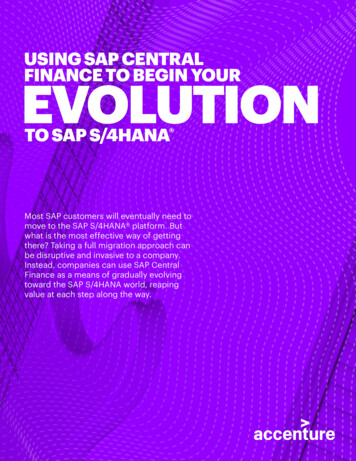
18Implied VolatilityHistorical The annualized standard deviation of the past stock price movementimplied Volatility that justifies an option’s current market price Is found using an option pricing calculatorVol 20%St. Dev. 208010068%120
19Implied Volatility and Expected Price Moves What does Implied Volatility delineate? Implied volatility is the volatility that justifies an option’s current price. How can I use implied volatility in my day-to-day trading? Implied volatility can be extrapolated into stock price movement or what istermed “Expected Move.”
20Expected Move and Probability Expected Move defines a one standard deviation move (68.3%) in a givenunderlying. Therefore, there is a 68.3% probability of an underlying closing inside of theexpected move by the designated expiration. Expected Move is a probability of expiring inside a given range by a specified date.
21“Old School” Expected Move Work Around! Not every trading application has expected move. You can use the “At The Money Straddle” as an alternative to the expected move. Add the ATM call and the ATM put for any selected expiration cycle. Yes, using the AT THE MONEY STRADDLE is the “old school” way of solvingexpected move, but old school still works!
22At the Money StraddleAt the Money Straddle can suffice for expected move.
23To Thrive in Volatility, You MUST First Learn Survival You are here in order to learn to make money in the midst of the extreme. We aregoing to get that done. However, before we move forward, there are two CRITICAL components we mustaddress.
24Critical Components in Navigating Volatility1. Defense Control the risk you have on! If you cannot handle the risks you currently have on, you haveNO CHANCE to profit from the onslaught of volatility.2. Offense Place viable risk-defined strategies designed for extreme market volatility. Extreme volatility isthe SINGLE GREATEST wealth creation mechanism the markets have to offer!
25Defensive Volatility TacticsControl your risks FIRST!
26Play the Game the RIGHT WAY! Plan for anything the markets can throw at you. Trading is a game of Chess. A decent Chess player can see their opponents’ possible moves and calculatesprobability, four to five moves into the future. I’m going to show you how to take this concept into the markets and show youshortcuts that will cut your learning curve to a fraction of time so you don't have tobe a grandmaster to trade these strategies. You may not know where the markets are headed, but you can plan out thepossibility and even assign probabilities!
27Single Stock RiskFinding your PUKE POINTS!
28Evaluating your Breaking Point in Now that we have a background in expected move, we are going use this in orderto evaluate how many shares of a stock or ETF you might be comfortable beinglong or short at any given time. Effectively, we are going to find out in dollars and cents what your breaking point iswithin any given stock, ETF, or futures contract. Knowing what you can handle and where your breaking point resides in terms ofDOLLARS is a CRITICAL step in risk management; more importantly, you cannotsurvive volatility without this skill!
29Get Comfortable Before Markets Bring the Pain The goal of the following exercise and corresponding criteria is to find how muchrisk are you willing to take based on the implied movement of a selected stock orETF. If you know what to expect in terms of profit and loss, you have a significantlyhigher probability of survival in the midst of extreme markets.
30Step 1: Measuring Risk on a Product of Interest Select the numbers of shares you intend to buy (or sell) of a given product or usethe number of shares you own from an existing position. Thinking of buying a stock or ETF or have existing positions on? First, take any stock or ETF you are interested in that offers options. Open the options chain and theorize a number of shares you are likely to buy orsell. If currently in a position, find the number of shares you are long or short.
31Step 2: Solve for 30-day Expected Move In the product you selected in Step 1, open the option chain nearest to 30 daysremaining till expiration. Solve for 30-day expected move using the Expected Move from thinkorswim OR theAt the Money Straddle method taught in the Expected Move section of this class. As depicted in the screenshot below, the EM 8.77
32Step 3: Multiply shares (expected move) Take the number of shares you are long or short and multiply this by the expectedmove. Example: Assume we OWN 400 shares of AMD. AMD has a 30-day expected move of 8.77 (as seen in the previous slide). AMD 400 shares multiplied by Expected Move of 8.77 3508. 3508 is a one standard deviation move or in more realistic terms, this is what your stock positionis going to take in terms of dollars-and-cents risk in the next 30 days. A one deviation move is allbut assured, so get ready and be totally comfortable with 3508 in risk!
33Expected RISK Example In our example, we are long the equivalent of 400 shares of the AMD. AMD expected move for 30 days is approximately /– 8.77 Take the expected move of 8.77 and multiply it by 400 shares of AMD, this equalsyour risk of approximately /- 3508
34Step 4: Calculating the Extremes Let’s clarify, with 400 equivalent shares of AMD, you are taking a 68.3% chance ofseeing a 3508 profit-or-loss swing inside the next 30 days. Now, take this number and double it. Now triple it. To account for less probableevents, you MUST assume you could see the market move 3 times the expectedmove at least one time per year. Expected Move 8.77 X 3 26.31 26.31 x 400 shares 10,524 3 times the Expected Move multiplied by 400 shares of AMD 10,524 risk
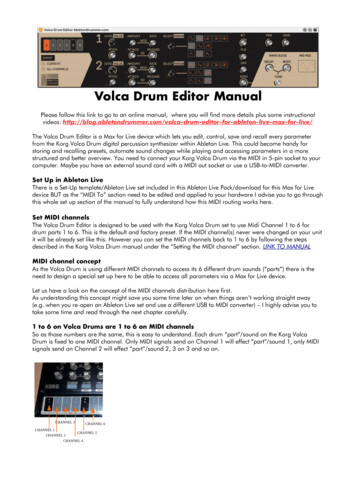
35Normal Distribution Curve
36Why Two or Three Times the Expected Move? You may be wondering why we use 2 times the expected move. Well, doubling theexpected move is what we term “probability of touching.” In the AMD example, there is a 68% probability of closing inside 8.77 in the next30 days. Meanwhile, ANYTIME in the next 30 days, we can exceed the 8.77 byapproximately double or what is termed “probability of touching.” We go so far as 3 times expected move to test the outer bounds of what themarket deems plausible.
37Step 5: Position Sizing How Does it Feel? Ask yourself every step of the way: Am I comfortable with this level of risk in themarkets? If ever the answer is NO, you need to lighten the position immediately or learn toHEDGE Risk! In risk management, you must NEVER assume the market will go up or down. Youjust take a probability stance based on expected moves and weigh that againstyour individual appetite for risk.
38There is a reason they call it “puking” In the aforementioned criteria, what is critical is youNOT wait until volatility strikes to assess your personalrisk and comfortability. There is a reason traders call it “puking” the positions.That’s what newbie traders do when they are in toodeep. Don’t be a position puker. Know your threshold forpain.
39Risk AggregationGetting a Grip on the Reality of YOUR Risk
40It’s YOUR Money. Get a Grip and do Something! You can only have a handle on your risk IF you know what those risks amount to. Mutual Funds and 401-k managers want you to be vested for the “LONG HAUL” asthey profit from fees and assets under management. The entire asset management system is designed with one express goal: to gettheir hands on YOUR money! Get a Grip on the Reality of YOUR Risk
41How BIG is your risk? How much risk do you have on? You need to know within a few dollars what is your total exposure to markets withina given time period. What I want you to be capable of answering in this course: What is your profit and/or loss potential in the next 30 days?
42Step 1:Gather your portfolios First, let’s look at your portfolio value and estimate your total market exposure. This will require you to add together your: 401-K’s IRA’s Mutual Funds Taxable and Margin Accounts Total Invested Funds Find your statements and find your money!
43Step 2: Aggregating Value Add the total notional (dollar value) value of the funds and individual stocks fromALL portfolios into one lump sum! Exclude CASH and BONDS. What we are shooting for --- total value of the portfolio. We do NOT want to know how much margin is being used, we want to know howmuch the portfolio is worth if you were to liquidate the entire thing.
44Aggregating Portfolio Value Take ALL of the products you are long and/or short and add up the total value. Duration options positions can be added in though you can EXCLUDE optionsstrategies and shorter duration swing-type trades. Example Portfolio has a total LONG value of 331,039.86.
45Step 3: Index Correlation Select an Index or ETF product having the greatest correlation to your overallportfolio exposure. Do not overthink this. Most portfolios have a strong relationship with the S&P500. SPY, QQQ, IWM could all be possible candidates depending upon where yourlargest portfolio exposure happens to be. Mutual Funds often benchmark against specific index products clearly statingSP500, Tech Heavy (NASDAQ), or Small Caps (Russell 2000).
46Step 4: Calculating your risk Divide your portfolio value by the ETF product selected. For example: We selected the SPY which is currently trading at 290.00. Our mock portfolio has a value of 331,000. How many shares of the SPY could we buy with 331,000 ? 331,000 / 290 1141 Therefore our portfolio has approximately 1141 shares of SPY risk.
47Step 5: Evaluate Portfolio Expected Move Take the number of shares you are long or short and multiply this by the 30-dayexpected move of the ETF selected in Step 3. Example: Assume we own the notional equivalency of 1141 shares of SPY. SPY has a 30-day expected move of 33.21. SPY 1141 shares multiplied by Expected Move of 33.21 37,892.61. 37,892.61 is a one standard deviation move or in more realistic terms, this is what yourportfolio position is going to take in terms of dollars and cents risk in the next 30 days. A onedeviation move is all but assured. So get ready and be totally comfortable with 37,892.61 in risk!
48Step 6: Calculating Portfolio Extremes Let’s clarify, with 1141 equivalent shares of SPY, you are taking a 68.3% chance of seeing a 37,892.61 profit or loss swing inside the next 30 days.Now take this number and double it. Now triple it. To account for less probableevents, you MUST assume you could see the market move 3 times the expectedmove at least one time per year.Expected Move 33.21 X 3 99.6399.63 x 1141 shares 113,677.833 times the expected move multiplied by 1141 shares of SPY 113,677.83 risk
49Step 6: Risk in check, notional value methodology All right, I am fairly confident your portfolio manager has not discussed the outlookfor risk on your aggregated portfolios. Over my 20-year career, I have watched retail clientele lose (on average) HALF theirlife (retirement) savings on 2 separate occasions. Be conservative and remain vigilant on knowing what is at risk. You may not haveaccess to this retirement capital for years to come, but it is still your money andyou have a right to defend what is yours! Cut the portfolio to comfortable capital levels!
50Going on the Offensive!Let’s Breakdown a few Volatility Setups
51Bring on the Offense! Once you understand and can control the risks you have on, then you are ready togo on a Volatility Offensive! The offense is about knowing what you are looking at, knowing the setups andknowing when to pull the trigger and with what strategies.
Copyright 2017 TheoTrade, LLC. All Rights Reserved52The Anti-Chartite I spent many years of my career trying to understand why people looked at charts. I even went so far as to date a Canadian Market Technician. She worked on thefloor in Toronto; talk about a match made in She called me the anti-chartite! And possibly a few other names. Well, it took a few failed relationships, but, hey, I finally found common ground.
Copyright 2017 TheoTrade, LLC. All Rights Reserved53What’s a Quant? No one says, “I want to be a Quant when I grow up.” Generally speaking, Quants are mathematically inclined traders seeking edgesthrough detailed data analysis. Quantitative Trading encompasses a vast array of strategies, allocation techniques,algo trading, pairs, statistical arbitrage, you name it. Rather than looking at a chart or a classical study, “this” Quant Geek tends to lookat statistical analysis; in other words, I am a numerically driven trading monkey.
Copyright 2017 TheoTrade, LLC. All Rights ReservedEvolution of the Trader54
55The Quantitative Geek in me The following are volatility trade setups you can use via statistical means: IV Percentiles VIX, Vol Futures and VVIX Gravity Points
56Enter the Volatility Products A volatility party would never be complete without the volatility products making anappearance. In this section, we will use the following products in order for us to determinemarket conditions: Vol Futures VIX VVIX
57A Quants Guide to the VIX Since its start in 1990, the VIX has averaged a daily close of 19.1 with a standarddeviation of 7.7 points. That should make 42.2 the buy signal since it is 3 standard deviations from themean (19.1 3 x 7.7). 5 standard deviation moves in the S&P are more common than a normaldistribution would indicate. And since the VIX tracks near term actual volatility, itshares the fat-tail phenomenon. Over the last 7,598 trading days since the VIX started in 1990, there have been 33days when the VIX closed above 57.6 (its 5 standard deviation upper bound). Notsurprisingly, they were all in Q4 2008.
58Looking for a bottom using VIX! Bottom line: a close ABOVE the 42.2 level delineates truly a panicky territorybased on a statistical analysis of the VIX. The first VIX level to watch is 42.2 (3 standard deviations), 8% higher than today’sclose. That will signal a statistically unusual amount of market concern and couldmark a near-term low. The next one is 57.6 (5 standard deviations), 47% higher than today. Importantly, history says the lows don’t happen when the VIX is this high.Remember, the 5-sigma VIX levels were in Q4 2008, and the S&P 500 did notbottom until March 2009. In fact, the Q4 2008 average S&P level was 895. If youheld until the start of Q4 2009, you were up 18.1% but you had to transit thefamous Devil’s Low of 666 on March 9th, 2009 first. (data from DataTek)
59Bullish Bias Based on VIX Spikes? When the VIX hits statistically significant levels, what trades can you use? IN/OUT spreads can be used for short-term bursts to the upside; however, the VIXdata has demonstrated more effective for investment strategies such as sellingputs to obtain long stock or buying shares. In/Out Spreads ount-growth-with-in-out-spreads-class/ Selling Puts to Acquire Long Stock ngstock/
60Using Implied Volatility to find Bias Understanding implied volatility and our earlier discussion of expected move is astep in the right direction. How we use implied volaility and our understanding of these metrics can take ourtrading to the next level.
61
62IV Percentiles Implied Volatility Percentiles rank implied volatility over the past 52 weeks inoptionable securities. Ranking volatility over 52 weeks can help us determine if volatility is at an extreme,high or low. Implied Volatility can move to extremes exceeding 100% IV percentiles are bounded from 0% to 100%. Determining your products’ IV percentile.
63IV Chart or Options Statistics Use IV rank or visually access the IV on a chart to determine extreme levels.
64IV Percentiles Extreme high readings (80% ) on IV percentiles can offer opportunities to selloptions premium at historically high levels. However, larger options premium is a definitive indication of higher risk andshould be approached with defined risk strategies for traders or the sale ofnaked puts for those looking to make investments. For those seeking to sell options premium, look towards EQUITY PRODUCTS asmarkets have displayed little edge in recent years on index and ETF premiumsales. Guide to Selling High Probability Spreads igh-probability-spreads-class/
65Enter the VVIX The VVIX is the Volatility of the Volaility Index! The VVIX measures the 30-day volatility of theVIX options. If the VIX is the SP500 fear index, then the VVIXis the fear of the fear index! Hold me, I’m scared!
66Significance of the VVIX We can use the VVIX as a consistent source of information if professional tradingfirms are BUYING VIX premium. If the VVIX is climbing, the professional world is anticipating risk or at the veryleast, they are hedging the possibility of risk. Either way, when billions of dollars are talking and increase the VVIX, we listen!
67Levels in the VVIX When the VVIX reaches 100, we start to seriously “pay attention.” A VVIX over 100translates to markets being on the verge of heavy bouts of volatility. A VVIX over 110 is indicative of extreme risk, often what we term “duck-and-cover”type volatility. The VVIX over 110 can be BRIEF! However, markets after a 110 VVIX readingshould be met with extreme caution for a minimum of 3 WEEKS following suchoccurrence of volatility.
68
69VVIX is climbing -- run for it! VVIX readings above 110 can come QUICKLY with shocks to the market andunforeseen events, geopolitical events, economic events, pandemics, etc. However, a higher VVIX or VVIX that is climbing can be indicative of risk coming. Again, after a spike above the 110 threshold, the VVIX may decline BELOW 110;however, market participants be warned, risk can still be persistent for WEEKSfollowing any 110 VVIX readings.
70Volatility Futures Volatility futures can play a pivotal role in determining market conditions solelyupon viewing the current state of the product. Vol futures exist in most bullish or flat markets in a normalized state whereby riskin the NEAR TERM is LOWER. As we go further out in time, risk is HIGHER. Risk is higher farther out in time as more time is indicative of more horrific thingscapable of happening in the world!
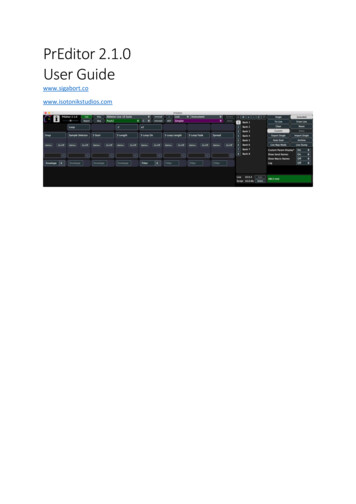
71Volatility Futures are Inverted! Duck and Cover! Inverted vol futures is a condition synonymous with heavy volatility in the overallmarkets. When vol futures are “inverted,” this indicates SHORT DURATION risk is so high andso prevalent whereby markets are pricing risk HIGHER in the near term and LOWERin the longer term. When Volaility is higher in the near term, the markets are saying “the world is crazytoday then it will be two months from now.”
72Inverted Volatility Futures
73What Does Inverted Vol Futures Mean for You? When volatility futures are inverted, dealers (market makers and trading firms) areforced to lay off risk using alternative methods, in turn, causing volatility toperpetuate. In effect, when the vol futures are inverted, you need to be “on your A game” andexpect wild moves, intraday reversals and substantial trading ranges.
74Comparative Quanticks and Tick Divergences Next we come to an INTRADAY Quantitative indicator. Quanticks keeps a running tabulation of ticks from NYSE, NASDAQ, RUSSELL, andSP500. Ticks are an indication of buying and/or selling; however, Comparative Quantickscan be used to determine turning points within intraday trade. Extreme volatility is known for fast rallies, violent sell-offs and ComparativeQuanticks can help confirm these moves. Quanticks Coaching Session /coaching-session-monday-march-25-quanticks/
75Specifics of Comparative Quanticks Using a comparative Quanticks may seem solely for intraday traders; however, inextreme markets, a turn of the ticks may lead to a more viable entry or exit playeffectively into the use of in/out spreads, selling premium, etc. The critical setup with Comparative Quanticks – Russell ticks are ascending rapidlyvs NYSE, NASDAQ, and SP500 ticks. The Russell is a slightly more volatile product and its ticks tend to diverge firstwhen markets are shifting direction.
76
77
78
79Gravity Points !! Gravity points are highly specified numeric stopping points in the SP500 futurescreated via aggregate risk of proprietary trading firms, market makers and bonafide hedging activity. These Gravity Levels are delineated by means of regression analysis withinmultiple marketplaces which include volatility futures, bond futures, and individualequity products. Gravity points are neither support nor resistance, rather they reflect an aggregationof risk and are “pausing” or “stopping” points whereby markets are attractedthrough a means of hedging activity.
80
81Where do Gravity Points come from? Proprietary trading firms, banks and market makers all use algorithms to manage portfolio delta risk.These firms as a collective can often offset one another's positions.For example, a firm buys 10k calls, another firm sold them the 10k calls.The hedging of the 10k calls is done by both the long and short firm. In the midstof the hedging activity, seams open up in the market.These seams are stopping points in risk management. They are for all intent andpurposes “the happy place” for risk.
82Fishing Out Gravity Points Now imagine someone just crazy enough to be capable of fishing out many ofthese seams within the risk. Finding gravity points is a painstaking process that includes observing multiplemarkets on an intraday time frame and down to the one-minute basis. However, finding the points is left to a highly trained eye and knowing they ONLYexist in the /ES SP500 mini futures contract.
83Using Gravity Points When push comes to shove, it is ALL about using these Gravity Points. After hitting a given gravity point, we have approximately a 50:50 chance ofproceeding higher or lower from the level. Bright side, when we break-off from a gravity point, we often run to the next levelwhereby pinging from point to point. Gravity points can be used on everything from intraday trades, risk management,to in/out spreads.
Don Kaufman 5. 6. TheoTrade can Prepare You for Volatility 7. Check your baggage at the door . Solve for 30-day expected move using the Expected Move from thinkorswim OR the At the Money Straddle