Transcription
European Journal of ParapsychologyVolume 252010
European Journal of ParapsychologyVolume 25, page 3 2010 European Journal of ParapsychologyISSN: 0168-7263EditorialWe regret to announce that after 35 years this issue of the EJP willbe the last issue published for the foreseeable future.Due to a combination of factors, including a decline in submissionsover the last couple of years (possibly related to the UK government'sresearch evaluation framework which links university funding to thenumber of publications in larger, more mainstream journals) andunfavourable developments in the HE sector, we have decided that thejournal will have to take a publication hiatus.We plan to maintain the website (http://ejp.org.uk/) for as long aspossible, with the aim of making back issues of the journal freelyavailable in PDF format, and hope to re-launch the journal in morefavourable times.This has been a very difficult decision for us and we have done ourutmost to prevent this from happening, but as the only independentjournal in the field we are left with little choice.Thank you all for your continued support over the years.Ian Baker, Paul Staples, and Paul Stevens3
European Journal of ParapsychologyVolume 25, pages 5-24 2010 European Journal of ParapsychologyISSN: 0168-7263A Methodological Issue in the Study of Correlationbetween Psychophysiological VariablesEdwin C. May, S. James P. Spottiswoode &Laura V. FaithLaboratories for Fundamental Research, California, U.S.AAbstractWe used previously accumulated skin conductance (SC) and EEGdata to examine the effects of their respective autocorrelations uponhypothesis testing. We found that SC data remain auto-correlatedfor many seconds, and that EEG data remain auto-correlated formany fractions of a second depending upon filtering parameters.We show that the effect of these non-zero autocorrelations upon theinterpretation of correlation coefficients using normal statistics canlead to substantially inflated significance levels. We demonstratethat standard Monte Carlo techniques can provide valid estimatesof the significance levels. We critically review a paper claimingsignificant correlation between the EEG’s of isolated participantsGrinberg-Zylberbaum, Delaflor, Attie, and Goswami (1994);however, using uncorrelated EEG data from one of our previousstudies and Monte Carlo methods to model the true nullhypothesis, we compute a non-significant difference (Z 1.22)between their non-“correlated” participants and their “correlated”ones in contrast with their claims of significance.Correspondence details: Dr. Edwin May, Laboratories for Fundamental Research, 330 Cowper Street,Palo Alto, CA 94301, USA. Email: may@lfr.org.5
May, Spottiswoode & FaithIntroductionThe field of research parapsychology has evolved to the point thatthere is now incontrovertible evidence of a statistical informationtransfer anomaly. In other words, we must reject the null hypothesis.Some of the recent meta-analyses that address issues of methodology,replication, and summary statistics can be found in Utts (1991; 1996),Bem and Honorton (1994), and Radin (1997). Note that we have beencareful not to claim that the existence for ESP has been proved. Rather,given that ESP has a negative definition — it is what happens whennothing else should — the declaration of an anomaly is the only validstatement that can be made.One of many possible avenues toward trying to understand theunderlying mechanisms of this anomaly (hence forth called ESP) is tosearch for psychophysiological correlates. There is a substantialliterature describing many different approaches, but it is beyond thescope of this paper to delve into an analysis of this work. Instead, wewill focus on one technical aspect.With the decrease of cost and increased capability ofpsychophysiological and computer hardware and software it becomesincreasingly attractive and feasible to monitor psychophysiology ofisolated participants in a variety of circumstances in ESP experiments.One method, for example, would be to search for correlations betweendata epochs of isolated pairs of participants.Our paper reviews the well-known underlying assumptions oncorrelation statistics, shows examples from skin conductance and EEGdata of what happens if the assumptions are violated, and suggestsways to use Monte Carlo techniques to obtain valid statistics whenthese assumptions are violated. In addition, we provide a criticalanalysis of one set of published experiments claiming an ESPtransferred event-related potential from one isolated participant toanother (Grinberg-Zylberbaum, et al., 1994).6
Correlating Psychophysiological VariablesMethod of ApproachIt is not the purpose of this paper to provide an exhaustivemethodological critique of previous studies nor do we wish to providea complete view into the complex methodologies associated with themeasurement of psychophysiological variables. Rather, we will focuson a single issue: what is the correct approach to measure a correlationbetween psychophysiological variables?We have all been taught that a clear understanding of all theexplicit and implicit assumptions is absolutely necessary beforeapplying statistical formulae to a problem. However, while we maybelieve this to be important, it is often overlooked when it comes timeto actually analyze data. It is tempting to take advantage of thesophisticated statistical software that is available that makes complexanalyses a simple task of pressing a button. But, of course, thisconvenience has a negative side, also.Let us review the familiar Pearson’s correlation coefficient, r:nr ( x x) ( y y)ii 1nin ( x x) ( y y)i 12ii 1,2iwhere n is the number of pairs of data points and X and Y are vectorscontaining the data. As we recall, the assumption is that both X and Yare each distributed normally and are random variables (i.e., the datapoints in X are independent of each other and the data points in Y areindependent of each other).1 x and y are means of X and Y,respectively. If these assumptions are met, there are a number ofmethods to assess the significance level of a given r for n-2 degrees offreedom. For example, we can use a Fischer’s Z transform to arrive at aZ-Score that is distributed, under the null hypothesis as N(0,1):We can relax the normality requirement by using a non-parametric correlation such as Spearman’s ρ,however the random variable assumption remains.17
May, Spottiswoode & FaithZ 1 n 3 0.5 ln 1 r ,r or a Student’s t representation as:t rn 2,1 r2df n 2.We will only examine the degree to which the Z-score formalismholds for actual psychophysiological data, because the underlyingassumptions for the T-score formalism are similar.2To see the effects of the violation of the independence assumption,we used skin conductance and EEG data from separate experiments asa test bed.Test Data SetsTo represent the central nervous system, we used 5-minutes ofoccipital (O1) EEG data that we collected from two different people ontwo different days. To represent the autonomic nervous system weused skin conductance DMILS data from a study at EdinburghUniversity.3 We randomly selected five minutes of data each from twodifferent participants who’s sessions were on different days. Thus withboth data sets we assume that the expected correlation is zero.Analysis: Autonomic nervous system variablesAs an example of an autonomic nervous system variable, we beginwith the skin conductance (SC) data. It is well known that SC variesslowly and is not random (Levenson & Ruef, 1992; Gottman, 1981).That is, each new data point contains a “memory” of the previous dataOften in EEG research, coherence is used rather than a correlation measure. Coherence measures usuallyinvolve FFT’s which are linear transforms of the data. Such a transform will not remove the autocorrelation sothe interpretation problems will remain. We will not, therefore, include a coherence analysis in this paper.3We thank Professor Deborah Delanoy for granting us access to her data from an as of yet unpublishedsender/no sender DMILS study (Delanoy, Row, & Brady, 2001).28
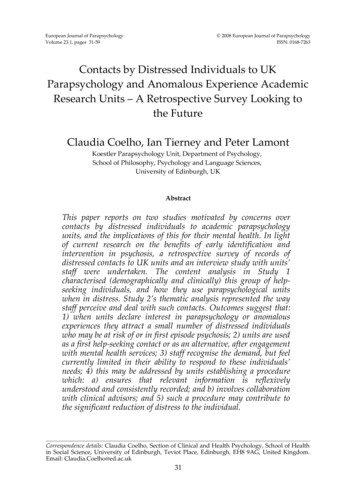
Correlating Psychophysiological Variablespoints. Figure 1 shows the autocorrelation function for one of the SCdata sets.Figure 1. Autocorrelation: Skin conductance and random dataWe computed the autocorrelation for lags from -30 to 30 seconds.The noisy curve with a “spike” at zero lag is the autocorrelation ofnormally distributed random data. That is, each successive sample ofthe random data has no “memory” as to the value of the previoussample. The skin conductance data are different. We notice that there isa correlation of about 0.5 for lags as long as about eight seconds. Thatmeans that the SC data point being measured now containsinformation about the SC data eight seconds previously.Clearly this is a strong violation of the random-variableassumption built into both the Pearson’s r and Spearman’s ρcorrelation functions which require an autocorrelation similar to therandom one shown in Figure 1. The critical question is to what degreedoes a strong skin conductance autocorrelation affect a statisticalevaluation?9
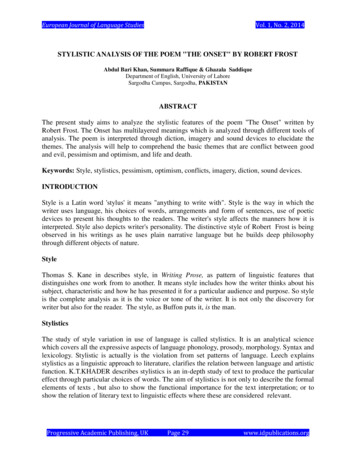
May, Spottiswoode & FaithTo address this question, we used a Monte Carlo technique. Foreach of 1,000 passes, we randomly selected 10-second intervals (i.e., 160points), one each from the two independent SC data records. Inaddition, for each pass, we computed two separate random vectors ofthe same length as the SC data, each of which were distributed asN(0,1). We computed a Pearson’s r and a Spearman’s ρ for the pair ofSC data and for the random data. The distributions are shown inFigure 2.The effect of having such a strong autocorrelation is immediatelyobvious in Figure 2a. The correlation of random data, which is shownas the dark Gaussian-shaped histogram centered on zero, ranges fromabout –.25 to .25 as expected for correlation coefficients with 158degrees of freedom. The surprise is the nearly uniform distribution ofcorrelation coefficients for both Pearson’s r (lightest) and Spearman’s ρ,which is shown as the more uniform darker distribution. The peaks ofthe distributions near unity correlation is expected for non-specific skinconductance in that the two participants were essentially relaxing inthe absence of overt stimuli. So both SC records tended to decreasethroughout the 10-second epoch leading to an excess of large positivecorrelation values.Figure 2. Skin conductance and random data10
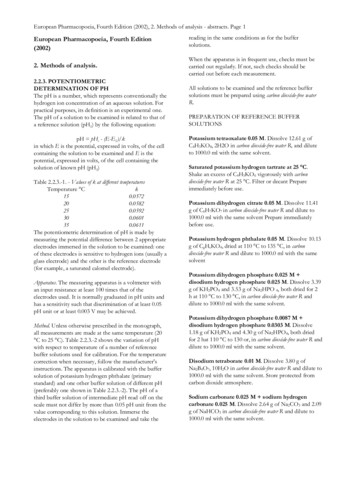
Correlating Psychophysiological VariablesFigure 2b shows the distribution of Z-scores computed from theFischer’s Z as shown above. The darker histogram centered on zeroshows the expected range of Z-scores for uncorrelated random datathat meet all the criteria for the proper interpretation of Pearson’s r.The highly auto-correlated SC data on the other hand, which fails therandom-variable criterion, and is shown as the lighter histogram inFigure 2a shows Z-scores (Figure 2b) that range from misleading -20 to 20 even for totally uncorrelated data!The proper way to asses a probability of an observed correlationbetween epochs which are themselves highly auto-correlated is to use aMonte Carlo technique.4To demonstrate how this works, consider the lightest histogramshown in Figure 2a above. We generated that histogram from thecorrelation of 1,000 pairs of 10-second SC epochs. Suppose we wish tocompute a Z-score for an observed correlation, ro. The following are thesteps to compute a valid one-tailed Z-score:1. Order the 1,000 element correlation vector from smallest tolargest.2. Compute how many correlation values are greater than or equalto ro.3. Break ties by computing the centre position among the ties.The p-value is computed as:p number of r ' s ro,total number of correlationsand can be converted into a Z-score by the usual method. Figure 3shows the distribution of 10,000 Z-scores with SC data resulting fromthe Monte Carlo calculation described above.We do not claim to be the first to come up with the idea of applying Monte Carlo techniques to assessprobability. This technique can be found in the literature under such names including permutation technique— partial or complete and bootstrap methods.411
May, Spottiswoode & FaithFigure 3. Monte Carlo derived Z-score distributionThis is a well-behaved N(0,1) distribution that is expected underthe null hypothesis of no correlation even in the case of highly autocorrelated data. Although the standard formalism to compute Z-scoresfrom correlations must be rejected in auto-correlated data, a MonteCarlo calculation can give reasonable non-assumptive and nonparametric estimates of the likelihood of such correlations given thedata sets at hand.We have used skin conductance to illustrate the problemsassociated with a slowly varying autonomic nervous system variable;however, the same problems will exist with other such variables thatinclude heart rate, respiration rate, and blood volume. We recommendthe use of Monte Carlo methods to make statistical assessments for allcorrelations among these types of variables.12
Correlating Psychophysiological VariablesAnalysis: Central nervous system variablesThe problem of correctly assessing correlations also exists with thecentral nervous system data, though less severely. We filtered fiveminutes of occipital (O1) EEG data from 8 to 10 Hz and computed theauto correlation for lags between -1 and 1 second. For comparison, wegenerated the equivalent length of random data which was distributedas N(0,1).5 Both autocorrelation functions are shown in Figure 4. The“spike” at zero lag is for the random data as expected. In the alphaEEG case, the autocorrelation function, while significantly shorter thanfor skin conductance data, nonetheless is significantly longer than forrandom data. In Figure 4, we have shown both plus and minus lags tobe complete; however, only the negative lags have meaning. That is,EEG alpha “memory” lasts for approximately one half second, or theEEG alpha value being measure “now” contains information about theEEG alpha value as much as 0.5 seconds earlier.Figure 4. Autocorrelation of EEG alpha and random dataFor psychophysiological data, there are potentially two sources that contribute to the autocorrelationfunction. The first is inherent in the system, and the second results from applying filters to the data. In thispaper, we show random data which is distributed as N(0,1) to illustrate the effects of non-zeroautocorrelations.513
May, Spottiswoode & FaithThe question is to what degree does this shorter autocorrelationinfluence the statistical assessment of correlations between two suchsets of data? We randomly selected 1,000 10-second epochs from eachof the two EEG records and computed correlations (i.e., Pearson’s r) foreach epoch pair. Figure 5a shows the distributions of these correlations.Figure 5. Correlation distributions of EEG alpha and random dataThe wide, lighter, nearly Gaussian shape is the distribution for thealpha, whereas the narrow, darker distribution is for random data. Soeven with a sharply reduced autocorrelation function compared to skinconductance, nonetheless, EEG-α correlations can be seriouslymisleading. Figure 5b shows the equivalent Z-score distributions. Wenotice that the Z-score distribution for the random data is as expected;however, as in the skin conductance case, the Z-score distribution forthe EEG data can lead to wildly incorrect answers.As in the case of skin conductance data (Figure 3), a Monte Carloapproach gives a N(0,1) distribution and allows for a valid assessmentfor correlation between separate central nervous system alpha epochs.Analysis summaryWe have shown that the underlying assumptions that would allowthe use of a Fischer’s Z transform to compute the significance levels ofa Pearson’s r correlation are substantially violated with autonomic and14
Correlating Psychophysiological Variablescentral nervous system data. Of course this is a well known result;however, in the next section we will show an example of a “land mark”paper that ignored these difficulties.DiscussionGrinberg-Zylberbaum (1982) became interested in studying EEGcorrelation between communicating individuals, and he and hiscolleagues published similar studies for over a decade.6The basic idea behind this research was to examine correlationsbetween individuals at various stages of communication. For example,participants were sequestered together in the same room (GrinbergZylberbaum & Ramos, 1987) and broad-band (i.e., 3 – 45 Hz) EEG wasmeasured simultaneously, or in isolated chambers using a “telepathic”paradigm (Grinberg-Zylberbaum, Delaflor, Arellano, Guevara, &Perez, 1992). Pearson’s r’s were computed and displayed graphicallyfor visual inspection and quantitative analyses. Grinberg-Zylberbaumand Ramos (1987) observed what they described as strong coherencebetween these sets of EEG records and presented means and standarderrors for the correlations under various conditions. Since they do notmention any Monte Carlo methods, we assume they used normalstatistics.For the remainder of this discussion, we will focus upon a paperby Grinberg-Zylberbaum, Delaflor, Attie, and Goswami (1994) becauseit is the most detailed with regard to methodological issues and is oftenreferenced as the quintessential example of quantum coherencebetween isolated brains.7 Hence forth we will refer to this paper asZDAG.It is not our purpose to single out this group for our critical remarks; however, their pioneering research hasinvoked substantial experimental, theoretical, and philosophical interest.7We will only focus upon the methodologies associated with the correlation calculations and the resultingconclusions rather than providing a complete critique of the whole paper.615
May, Spottiswoode & FaithZDAG overviewThe basic idea behind this paper was to observe event relatedpotentials (ERP) in the EEG record of an isolated individual while asecond isolated individual was being stimulated with 100 random lightflashes — the details of which were not described in the paper. EEGwas also monitored from the participant who was directly stimulated.There were two conditions of interest:Before interaction: In this condition called Condition 1 in the paper,the above measurements were made between individuals who had notmet or interacted in any way.After interaction: In this condition called Condition 2 in the paper, theindividuals were introduced to each other inside the stimulationchamber and instructed to “get to know” each other and then to “feelone another in meditative silence” for 20 minutes before the above EEGmeasures were obtained.Standard ensemble averaging was performed over the 100 stimulifor the “sender” from zero to about 0.5 seconds relative to the stimulus,and using the same stimuli markers, a similar ensemble average wascarried out in the “receiver’s” EEG record.All EEG records were filtered between 12.7 and 35 Hz prior to theensemble averaging. The goal was to observe an ERP in the sender andsee a correlated ERP in the receiver. For 48 steps of 16 samples each, aPearson’s r was computed. Thus, a temporal record of the correlationcould be observed for about 0.5 seconds relative to the stimulus. Theauthors do not indicate how significance levels were computed, aquantitative statistical measure between Conditions 1 and 2, nor dothey mention whether any Monte Carlo methods were used; thus wepresume they used a “standard” Z or T method.16
Correlating Psychophysiological VariablesWithin the first 132 ms, they report correlation levels ranging from.700 to .929 corresponding to p .009.8Independent evaluation of mean chance expectationFor our evaluation, we used two 5-minute EEG records far fromany putative stimuli from different days and different participantsfrom our 1994 ERD study. The null hypothesis was that no significantcorrelation between these isolated records would be found.Followi
methods to assess the significance level of a given r for n-2 degrees of freedom. For example, we can use a Fischer’s Z transform to arrive at a Z-Score that is distributed, under the null hypothesis as N(0,1): 1 We can relax the normality requirement by