Transcription
Int. J. Electrochem. Sci., 13 (2018) 12340 – 12348, doi: 10.20964/2018.12.59International Journal trochemical glucose biosensor with the characterization ofsurface morphology and content of glucose oxidaseglutaraldehyde-cysteine layers on gold electrodeJ. Lović1, S. Stevanović1, B. Andjelković2, S. Petrović3, D. Vuković4, N. Prlainović5, D. Mijin3, N.D.Nikolić1, M. Avramov Ivić*1ICTM – Institute of Electrochemistry, University of Belgrade, Njegoševa 12, 11000, Belgrade, SerbiaFaculty of Chemistry, University of Belgrade, Studentski trg 12-16, 11000 Belgrade, Serbia3Faculty of Technology and Metallurgy, University of Belgrade, Karnegijeva 4, 11000 Belgrade,Serbia4Faculty of Medicine, University of Belgrade, Dr Subotića 8, 11 000 Belgrade, Serbia5Innovation Center of Faculty of Technology and Metallurgy, University of Belgrade, Karnegijeva 4,11000 Belgrade, Serbia*E-mail: milka@tmf.bg.ac.rs2Received: 3 July 2018 / Accepted: 25 July 2018 / Published: 5 November 2018Glucose biosensor containing cysteine (Cys), glutaraldehyde (GA) and glucose oxidase (GOx) ontogold electrode is constructed and already electrochemically tested. Now, the electrochemical behaviorof biosensor in human serum is further investigated and supported by morphological characterizationof layers for the first time. The morphology and microstructure of layers was examined by Fouriertransformed infra red spectroscopy (FTIR), atomic force (AFM) and optical microscopy (OM). Theelectrochemical indication that the Cys-GA-GOx film on Au surface is not compact and that therewere some bare regions which remain catalytically active is supported by AFM and OM results. Theconstruction and the nature of bonding of Au-Cys-GA-GOx biosensor layers is confirmed by the FTIRstudy.Keywords: Biosensor, Electrochemical glucose sensing, Microstructural characterization, FTIR,AFM, OM microstructural characterization.1. INTRODUCTIONThe number of people with diabetes is growing rapidly [1, 2]. Improved glycemic controlreduced the risk of progression of complications related to diabetes mellitus. The limitations of oldconcepts of measuring glycemia require new methods to assess bodily biochemistry as fast and easieras possible, so to diagnose diabetic eye disease in the early stage. The development of an efficient
Int. J. Electrochem. Sci., Vol. 13, 201812341biosensor for monitoring blood glucose levels would be great tool combating diabetes mellitus [3–8].There is a need to develop an electrochemical glucose biosensor by immobilizing enzyme onan electrode surface. Gold is usually used for immobilization of enzymes [9–11] and the firstmodification step involve compounds with thiol (-SH) group [12–15], or cysteine as cheaper and morestable. Glutaraldehyde (GA) is a well known powerful crosslinker with reactive aldehyde groups onboth ends and one of the most widely used reagents for the activation of aminated surface [16]. GOx isa first choice as a biosensing model molecule in many studies because it is stable, relatively low costcompound [17, 18], and frequently used in clinical praxis [19–21].Numerous biosensors were already constructed and tested [22–27]. Biosensor containing Cys,GA and GOx on gold electrode was constructed and it is preliminary electrochemically investigatedand compared with similar sensors found in available literature data [28]. The glucose oxidaseglutaraldehyde-cysteine modified gold electrode as a biosensor exhibits excellent sensitivity,selectivity and stability for glucose monitoring. The important advantage of the investigated systemenables proper glucose detection in biological systems because of the lack of interferences with O2 orH2O2 [28].In this work we continue development of our biosensor in human serum with the physicalinsight in its layers obtained by successive attachment of Cys, GA and GOx onto gold electrode. Theelectrochemical performances of biosensor are presented showing the effective potential area forglucose sensing in human serum. The surface morphology of biosensor and structure of layers ofmodified gold electrode was analyzed and characterized by FTIR, AFM and OM techniques andconnected with the electrochemical ability.2. MATERIALS AND METHODS2.1. ChemicalsGlucose oxidase from Aspergillus niger (EC 1.1.3.4), Type VII, 149 800 U g-1 ( 150 U mg-1solid), L-cysteine and D-( )-glucose were purchased from Sigma Aldrich. Glutaraldehyde waspurchased from Acros Organics, and salts for the phosphate buffer from Merck Alkaloid. MiliporeWaters Milli-Q purification unit was used in order to obtain deionized water.The modification of Au electrode with cysteine (Au-Cys) was performed as it was describedpreviously [28].2.2. Electrochemical experimentFor cyclic voltammetry (CV), PGZ 402 Volta Lab (Radiometer Analytical, Lyon, France) wasused. The three electrode electrochemical cell and the preparation of polycrystalline gold electrode(surface area 0.5 cm2) were described in detail previously [29]. A gold wire was used as the counterelectrode and a saturated calomel electrode (SCE) as the reference electrode. All potentials are givenvs. SCE. The electrolytes were deoxygenated by purging with nitrogen.
Int. J. Electrochem. Sci., Vol. 13, 201812342The human serum was collected and clinically prepared from twenty healthy volunteers andspiked with glucose using procedure described previously [30].2.3. Surface characterizationIR spectra were recorded on a Thermo Scientific Nicolet 6700 FT-IR spectrometer, using theattenuated total reflectance (ATR) technique from the Smart accessory with diamond crystal (SmartOrbit, Thermo Scientific, Madison, WI, USA). Spectral data were collected in the mid-IR range (1800–600 cm 1) with 64 scans and 2 cm 1 resolution. A background spectrum (32 scans) was recorded beforeevery sample spectrum. IR spectra were baseline corrected and smoothed using OMNIC software(version 7.0, Thermo Scientific, USA), and exported to SPC files [31].Atomic force microscope (AFM) was employed to observe the gold surface after eachmodification step. NanoScope III A (Veeco Digital Instruments, USA) microscope was used. Tappingmode AFM images were recorded at the room temperature using etched silicon cantilevers with forceconstant 60 N/m. Image analysis was done by Nanoscope image processing software. The surfacecharacterization was also performed using optical microscope (Olympus CX41) connected to thecomputer.3. RESULTS AND DISCUSSIONFigure 1. CVs obtained on Au-Cys-GA-GOx electrode using phosphate buffer (0.1 M, pH 7.0) fordifferent glucose concentration spiked with human serum at scan rate of 100 mVs 1. Inset: j vs.E from -200 mV to 400 mV.The ability of the presented biosensor for the glucose measuring was tested by CV for the
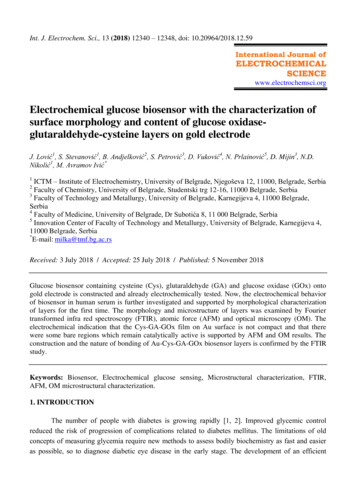
Int. J. Electrochem. Sci., Vol. 13, 201812343different glucose concentrations spiked with human serum as is presented in Fig. 1. The serum samplesobtained from 20 healthy volunteers, spiked with the glucose concentrations (clinical values forhealthy people [30, 32] gave the same electrochemical response.In the presented range of the glucose concentrations there is a linear relationship betweencurrent vs. glucose from 1.5 to 8 mmol l 1, as is presented in inset in Fig. 1. The linear current/glucoseconcentrations dependency is observed in the area of the potential from -200 mV to 400 mV.Figure 2. FTIR spectra of: a) cysteine, b) glutaraldehyde, c) glucose oxidase, d) Au-Cys-GA-GOxbiosensor (range 4000-400 cm-1), and e) Au-Cys-GA-GOx biosensor (range 2000-400 cm-1).
Int. J. Electrochem. Sci., Vol. 13, 201812344In this way the effective potential area for glucose sensing in human serum is established and itis explained as follows. It is well known that OH– enables glucose oxidation and the AuOH formationon the gold surface in the potential range -0.1 to 0.3 V occurs [33]. This indicates that the Cys-GAGOx film on Au surface is not compact and that there were some bare regions which remaincatalytically active. It is supported by AFM and OM results and will be discussed in detail. It isimportant to notice that glucose oxidation in the whole range of the potential presented in Fig1proceeds with 50% lower anodic currents on bare gold electrode than on the sensor surface [28].In order to improve further the physical insight in the construction and the nature of bonding ofAu-Cys-GA-GOx biosensor layers, the FTIR study is performed and presented in Fig. 2.Spectra of Cys, GA and GOx (Fig. 2. a, b, c) exhibit all the characteristic bands described in theliterature [34–36]. Au electrode modification is elucidated and confirmed by observing the part of thespectrum between 1800 and 500 cm-1 (Fig. 2e). The absence of band at 1715 cm-1, that in the spectrumof GA originates from –C O group, indicates that reaction with enzyme amino groups occurred. Themost prominent bands in the spectrum of biosensor at 1675 and 1160 cm 1 originates from the amide Iband and enzyme carbohydrate moiety and undoubtedly confirms the attachment of glucose oxidase.In addition, the band at 1675 cm 1 is broader in comparison to amide I band in the spectrum of freeenzyme what can be explained by overlapping with absorption of imino group formed by the reactionof glutaraldehyde carbonyl group and enzyme amino group [37].In order to obtain better insight in characteristics of this biosensor, it was necessary to makeanalysis of all elements or layers of which the biosensor is constructed. The surface characterization ofthe initial surface area (Au), as well as the surface areas after the added Cys, GA and GOx are done bythe AFM technique and the change in the surface morphology after each subsequent modification stepare presented in Fig. 3.AFM images of pure Au surface area (Fig. 3a) and those obtained with the addition of cysteine(Au-Cys; Fig. 3b and c). The AFM analysis showed that the RMS roughness of the surface area of Auwith the adsorbed cysteine (Au-Cys; Fig. 3b) compared with the same surface area of pure Au waslarger for about 30 % (Fig. 3a). Also, it can be seen from Fig. 3c that molecules of cysteine do notcover the surface area of Au completely. This is in a complete accordance with the effective potentialarea presented in inset (Fig. 1) and with the catalytic influence of pure gold electrode uncovered bybiosensor layers.The attachment of GA was confirmed by the AFM technique as shown in Fig. 3d. The linesection analysis of the part of surface area shown in Fig. 3d is given in Fig. 3e, from which can be seenthat the size of GA agglomerates was around 300 nm. It is important to note that they are uniform overthe surface, in a size as well as in a distribution.The immobilization of GOx on GA activated surface proceed through a two step mechanismwith the first being adsorption and the second covalent bonding [38]. By choosing Cys and GA aslinkers the adsorption was reduced to a minimum as it was previously confirmed [39]. It can be seenfrom Fig. 3f that the surface area is not completely covered with the enzyme. Small enzyme aggregates(10–20 nm) are properly grouped over the previously introduced GA.
Int. J. Electrochem. Sci., Vol. 13, 201812345abcdfeFigure 3. a) Au (0.65 0.65 0.1 m); (RMS: 5.875 nm), b) Au-Cys (1 1 0.15 µm); (RMS: 8.704nm), c) Au-Cys (10 10 1.5 µm), d) Au-Cys-GA (1.25 1.25 0.2 µm), e) top view and linesection analysis of the part of surface area under d), and f) Au-Cys-Ga-GOx (3 3 0.2 µm).Due to specific crystallization of serum on the biosensor surface area, the furthercharacterization of the biosensor was done by the OM technique. Figure 4 shows the surface area ofthe biosensor (Fig. 4a and b), as well as the surface areas of the biosensor with the added glucose (Fig.4c and d), with the added glucose and serum (Fig. 4e, f and g), and with the added serum only (Fig. 4hand i).
Int. J. Electrochem. Sci., Vol. 13, 201812346Figure 4. The surface morphologies characterized by optical microscopy (OM) technique: a) and b)biosensor, c) and d) the biosensor with the addition of glucose, e), f) and g) the biosensor withthe addition of glucose and serum, and h) and i) the biosensor with serum.The absence of full coverage of the biosensor by ingredients already observed by the AFMtechnique is confirmed by the OM technique (Fig. 4a and b). It can be seen from Fig. 4a and 4b thatthe biosensor consists of small grains of spherical shape size uniformly distributed on Au electrode.The addition of glucose had not any effect on the appearance of the biosensor at the macro level, asshown in Fig. 4c and d. However, the remarkable change of surface morphology is observed by theaddition of serum on the biosensor with the added glucose (Fig. 4e, f and g). The appearance of thebiosensor with added glucose and serum is spider's web-like without any similarity with previouslyobserved surface morphologies of the biosensor. It is clear that this appearance of the surface area canbe ascribed to crystallization of serum on the biosensor with glucose, because the similar surfacemorphology is observed when serum was added on the biosensor without glucose (Fig. 4h and i). It isnecessary to note that the strong effect of serum on the surface morphology has been already observedin the case of sildenafil citrate [29], but different from those observed here.
Int. J. Electrochem. Sci., Vol. 13, 201812347Anyway, it is necessary to note that similar reports dealing with the investigation of the effectof serum crystallization on morphology of the glucose biosensor by OM technique are not found in theliterature. Among reports using OM technique for surface characterization of different forms of serum,it was found [40] that several crystal forms of recombinant and wild-type human serum albumin(HSA), such as a large rhombohedral-shaped crystals and trapezoidal blades, can be grown undersuitable crystallization conditions. Investigating structural features of HSA, it was also shown [41] thatglobules or spherical particles can be formed by crystallization from 10% aqueous solution of HSA. Arod shaped micro crystals of copper complexes were formed with bovine serum albumin (BSA) using asuperficial solution-based route [42]. On the other hand, a wire shaped structures of cadmium (II)complexes with BSA and HSA were formed indicating that optical microscopy is a useful tool toinvestigate the morphology of the formed nanostructures [43].4. CONCLUSIONElectrochemical ability of presented biosensor exhibit a linear relationship between current vs.glucose from 1.5 to 8 mmol l 1 with the effective potential range from -200 mV to 400 mV in asamples containing human serum. This potential range is in accordance with the AuOH formation onthe gold surface enabling glucose oxidation. This indication that the Cys-GA-GOx film on Au surfaceis not compact and that there were some bare regions which remain catalytically active is supported byAFM and OM results. The construction and the nature of bonding of Au-Cys-GA-GOx biosensorlayers is confirmed the FTIR study.ACKNOWLEDGEMENTWe are thankful to the Ministry of Education, Science and Technological Development of the Republicof Serbia for the financial support (Grant No. ON172013 and ON172060).References1. M.N. Piero, G.M. Nzaro and J.M. Njagi, Asian J. Biomed. Pharm. Sci., 4 (2014) 1.2. D.A. Antonetti, R. Klein and T.W. Gardner, N. Engl. J. Med., 366 (2012) 1227.3. D.M. Nathan, S. Genuth, J. Lachin, P. Cleary, O. Crofford, M. Davis, L. Rand and C. Siebert. N.Engl. J. Med., 329 (1993) 977.4. R.R. Holman, S.K. Paul, M.A. Bethel, D.R. Matthews and H.A. Neil, N. Engl. J. Med., 359 (2008)1577.5. G. Ghirlanda, M.A. Di Leo, S. Caputo, S. Cercone and A.V.Greco, Diabetes- Metab. Res., 13(1997) 15.6. H.W. van Dijk, F.D. Verbraak, P.H.B. Kok, M.K. Garvin, M. Sonka, K. Lee, J.H. DeVries, R.P.J.Michels, M.E.J. van Velthoven, R.O. Schlingemann and M.D. Abràmoff, Invest. Ophth. Vis. Sci.,51 (2010) 3404.7. H.W. van Dijk, F.D. Verbraak, P.H.B. Kok, M.K. Garvin, M. Sonka, K. Lee, J.H. DeVries, R.P.J.Michels, M.E.J. van Velthoven, R.O. Schlingemann and M.D. Abràmoff, Invest. Ophth. Vis. Sci.,51 (2010) 3660.8. J. Wang, Chem. Rev., 108 (2008) 814.9. M. Cichomski, E. Tomaszewska, K. Kośla, W. Kozłowski, P.J. Kowalczyk and J. Grobelny, Mater.Charact., 62 (2011) 268.10. N.J. Lang, B. Liu and J. Liu, J. Colloid Interface Sci., 428 (2014) 78.
Int. J. Electrochem. Sci., Vol. 13, 20181234811. H. Zhang and N. Toshima, J. Colloid Interface Sci., 394 (2013) 166.12. A. Ulman, Chem. Rev., 96 (1996) 1533.13. L. Qingwen, G. Hong, W. Yiming, L. Guoan and M. Jie, Electroanal., 13 (2001) 1342.14. S.K. Moccelini, S.C. Fernandes and I.C. Vieira, Sens. Actuators B, 133 (2008) 364.15. J. Zhang, A. Demetriou, A. C. Welinder, T. Albrech, R. J. Nichols and J. Ulstrup, Chem. Phys., 319(2005) 210.16. P. Adlercreutz, Chem. Soc. Rev., 42 (2013) 6406.17. Z. Yu, Y. Kou, Y. Dai, X. Wang, H. Wei and D. Xia, Electrocatalysis, 6 (2015) 341.18. J. Liu, M. N. Paddon-Row and J.J. Gooding, Chem. Phys., 324 (2006) 226.19. A. Salimi, R.G. Compton and R. Hallaj, Anal. Biochem., 333 (2004) 49.20. R. Wilson and A. Turner, Biosens. Bioelectron., 7 (1992) 165.21. A. Noorbakhsh, A. Salimi and E. Sharifi, Electroanal., 20 (2008) 1788.22. T. Hoshi, N, Sagae, K. Daikuhara, K. Takahara and J. Anzai, Mat. Sci. Eng. C-Bio. S, 27 (2007)890.23. S. Sabury, S. Habib Kazemi and F. Sharif, Mat. Sci. Eng. C-Bio. S, 49 (2015) 297.24. K. Tian, S. Alex, G. Siegel and A. Tiwari, Mat. Sci. Eng. C-Bio. S, 46 (2015) 548.25. A. Rodrigues, M.V. Castegnaro, J. Arguello, M.C.M. Alves and J. Morais, Appl. Surf. Sci., 402(2017) 136.26. Y. Zhou, L. Wang, Z. Ye, M. Zhao, H. Cai and J. Huang, Appl. Surf. Sci., 285 (2013) 344.27. J. Jung and S. Lim, Appl. Surf. Sci., 265 (2013) 24.28. J. Lović, S. Stevanović, N.D. Nikolić, B. Andjelković, S. Petrović, D. Vuković, N. Prlainović, D.Mijin and M. Avramov Ivić, Int. J. Electrochem. Sci., 12 (2017) 5806.29. J. Lović, N. Trišović, J. Antanasijević, N.D. Nikolić, S. Stevanović D. Mijin, D. Vuković, A.Mladenović, S. Petrović and M. Avramov Ivić, J. Electroanal. Chem., 782 (2016) 103.30. K.M. Drljević-Djurić, V.D. Jović, U.Č. Lačnjevac, M.L. Avramov Ivić, S.D. Petrović, D.Ž. Mijinand S.B. Djordjević, Electrochim. Acta, 56 (2010) 47.31. B. Andjelković, Lj. Vujisuć, I. Vučković, V. Tešević, V. Vajs and D. Godjevac, J. Pharmaceut.Biomed. 135 (2017) 217.32. R. L. Brazg, L. J. Klaff and A.M. Sussman, J. Diabetes Sci. Technol., 10 (2016) 1414.33. M. Pasta, F. La Mantia and Y. Cui, Electrochim. Acta, 55 (2010) 5561.34. A. Pawlukojć, J. Leciejewicz, A.J. Ramirez-Cuesta and J. Nowicka-Scheibe, Spectrochim. Acta A,61 (2005) 2474.35. A. Barth, BBA-Bioenergetics, 1767 (2007) 1073.36. A. Natalello, D. Ami, S. Brocca, M. Lotti and S.M. Doglia, Biochem. J., 385 (2005) 511.37. J. Lambert, Introduction to Organic Spectroscopy, Mncmillan, Publ., (1987), New York, USA.38. J.M. Bolivar, J. Rocha-Martin, C. Mateo, F. Cava, J. Berenguer, D. Vega, R. Fernandez-Lafuenteand J.M. Guisan, J. Mol. Cat. B: Enzym, 58 (2009) 158.39. D. Bezbradica, C. Mateo and J.M. Guisan, J. Mol. Catal. B: Enzym, 102 (2014) 218.40. D.C. Carter, B. Chang, J.X. Ho, K. Keeling and Z. Krishnasami, Eur. J. Biochem., 226 (1994)1049.41. M.E. Buzoverya, I.V. Shishpor and Yu.P. Shcherbak, Tech. Phys., 63 (2018) 291.42. M. Hazra, T. Dolai, A. Pandey, S.K. Dey and A. Patra, Journal of Saudi Chemical Society, 21(2017) S240.43. M. Hazra, T. Dolai, S. Giri, A. Patra and S.K. Dey, Journal of Saudi Chemical Society, 21 (2017)S445. 2018 The Authors. Published by ESG (www.electrochemsci.org). This article is an open accessarticle distributed under the terms and conditions of the Creative Commons Attribution /).
1 ICTM – Institute of Electrochemistry, University of Belgrade, Njegoševa 12, 11000, Belgrade, Serbia . biosensor for monitoring blood glucose levels would be great tool combating diabetes mellitus [3–8]. There is a