Transcription
Improving Vulnerability RemediationThrough Better Exploit PredictionJay JacobsSasha RomanoskyIdris AdjeridWade duwbaker@vt.eduCyentiaRAND CorporationVirginia TechVirginia TechDespite significant innovations in IT security products and research over the past 20years, the information security field is still immature and struggling. Practitioners lack theability to properly assess cyber risk, and decision-makers continue to be paralyzed byvulnerability scanners that overload their staff with mountains of scan results. In order tocope, firms prioritize vulnerability remediation using crude heuristics and limited data,though they are still too often breached by known vulnerabilities for which patches haveexisted for months or years. And so, the key challenge firms face is trying to identify aremediation strategy that best balances two competing forces. On one hand, it couldattempt to patch all vulnerabilities on its network. While this would provide the greatestcoverage of vulnerabilities patched, it would inefficiently consume resources by fixinglow-risk vulnerabilities. On the other hand, patching a few high-risk vulnerabilities wouldbe highly efficient, but may leave the firm exposed to many other high-riskvulnerabilities. Using a large collection of multiple datasets together with machinelearning techniques, we construct a series of vulnerability remediation strategies andcompare how each perform in regard to trading off coverage and efficiency. We expandand improve upon the small body of literature that uses predictions of published exploits, by instead using exploits in the wild as our outcome variable. We implement the machinelearning models by classifying vulnerabilities according to high- and low-risk, where weconsider high risk vulnerabilities to be those that have been exploited in actual firmnetworks.Keywords: vulnerability management, exploited vulnerability, CVSS, security risk management, machinelearning, precision, recallAcknowledgements: The authors would like to sincerely thank Kenna Security and Fortinet for sharingtheir data.
IntroductionA critical challenge for many modern organization is understanding how to minimize the cost ofmanaging and protecting its information assets and business systems. A core component of this challengeis adopting a vulnerability management process that can detect, and remediate known vulnerabilities.1Unfortunately, despite decades of research and technical innovations, there have been few advances inremediation practices. Given that firms will always have more exposed vulnerabilities than resources tofix them, firms struggle trying to develop and apply a remediation strategy that will optimally patch thosevulnerabilities that pose the greatest risk, while also deprioritizing those vulnerabilities that pose thelowest risk.In theory, a firm seeks to balance two competing forces. On one hand, it could attempt to patch allvulnerabilities identified on its network, which would provide the greatest coverage of vulnerabilitiespatched, but would inefficiently consume resources to fixing vulnerabilities that pose a lower risk. On theother hand, the firm could patch a small set of high-risk vulnerabilities. While this strategy might behighly efficient, many other potentially high-risk vulnerabilities may remain exposed. In practice, mostfirms are not sophisticated about managing this tradeoff and use heuristic strategies to prioritize theirremediation efforts; for example, a common approach is to remediate all vulnerabilities above a certainseverity score. However, many of the common heuristics used by firms have been found to besub-optimal (Dey, Lahiri, and Zhang 2015; Beattie et al. 2002) and in some cases, no better thanrandomly choosing vulnerabilities to remediate (Allodi and Massacci 2014).One of the key reasons the current approaches are ineffective is that firms cannot effectively assesswhether a given vulnerability poses a meaningful threat. For instance, prior work suggests that of all thepublicly known vulnerabilities, only 10-15% actually ever have a known exploit written for them, andeven fewer still are ever weaponized as part of hacking toolkits (Bozorgi et al. 2010). An even smallerproportion of vulnerabilities are ever targeted against an organization in the wild. Sabottke, Suciu, andDumitras (2015) find that as few as 1.4% of published vulnerabilities have exploits which have beenobserved in the wild. Given that so few vulnerabilities are actually a focus for attackers in the real world,a promising approach towards remediation is to identify vulnerabilities which are likely to be actuallyexploited, and therefore prioritize firm efforts towards remediating those vulnerabilities first.1We are not concerned with zero-day vulnerabilities in this paper.
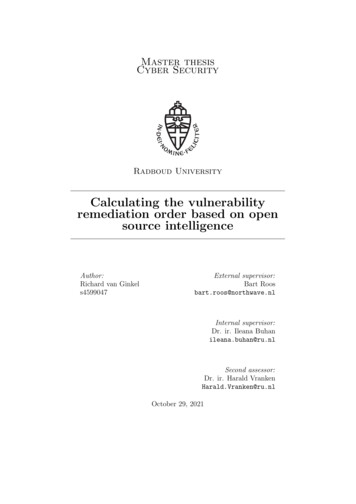
Because an exploit observed in the wild is the most relevant proxy for the probability that an exposedvulnerability can be used to compromise a firm’s network, our focus in this manuscript is on buildingpredictive models that can identify an exploited vulnerability.We start by generating ground truth data of whether a vulnerability has an exploit observed in the wild.We aggregate data from a variety of sources, including a private dataset generated by a partner securityfirm that monitors more than 100,000 corporate networks (almost 200 billion observations of networktraffic). To our knowledge, ours is the most comprehensive ground truth data used in this kind ofprediction effort, and the only one to rely on data from a diverse set of real-world intrusion detectionsystems. Notably, we observe exploits in the wild for 5.5% of vulnerabilities in our dataset compared to1.4% in prior works. We also collect a novel set of features for prediction; for example, we text minedetailed descriptions of each vulnerability to extract 191 tags (e.g. “buffer overflow”, “denial of service”)that are included as features in our prediction model. Combining this unique dataset with gradient boostedtrees we build a predictive model with exploits in the wild as the target variable.The combination of a more comprehensive measure of exploits in the wild and novel features forprediction results in a model that can effectively identify vulnerabilities with a high risk of exploitation inthe wild. Our model achieves an accuracy of 94.5 (with the ROC AUC of 0.91) and produces a significantlift in prediction coverage and efficiency compared to prior work (as shown in Figures 1a and 1b).22False Positive Rate (FPR), and True Positive Rate (TPR).
Figure 1: a) ROC curve of our model output and b) comparison of exploit prediction models (Sabottke,Suciu, and Dumitras 2015)More importantly, the lift in prediction accuracy that our model provides significantly improve theefficiency of remediation strategies. Informed by our prediction model, a firm seeking broad coverage ofvulnerabilities that are exploited in the wild (e.g. 70%) can achieve this by remediating only 7,900vulnerabilities. On the other hand, this same level of coverage would require the remediation of more than3 times the vulnerabilities using both comparable heuristic approaches ( 34,000) and ML models built onthe features utilized by prior works ( 30,000). This reduction in the number of vulnerabilities that a firmneeds to remediate is due to a dramatic decrease in the number of false positives remediated under anapproach informed by our model.Our work contributes to the literature on the economics of information systems, and computer scienceliterature on vulnerability remediation. In addition, we believe this work has significant implications fordecision makers when assessing cyber security risk, to include firms, federal agencies, and nationalsecurity policy makers.In further work, we will examine more deeply the mechanics behind our model, identify which featuresare most important to predicting exploits in the wild, and generate predictive models for important subsetsof vulnerabilities (e.g. based on the most popular vendors).The next section discusses related literature, followed by a description of the datasets used in thisresearch. We then present the results from 3 separate vulnerability remediation strategies using simplerule-based approaches, followed by a full machine learning prediction model. We conclude with adiscussion on limitations and conclusion.Related LiteratureThis paper draws on a body of work focused on the economics of information security. Our work isparticularly relevant to a stream of research evaluating the efficiency of vulnerability remediation; a keyfunction related to how organizations proactively guard against security incidents. This stream of researchincludes evaluations of the appropriateness of strategies for identifying new vulnerabilities anddisseminating that information to relevant stakeholders (Kannan and Telang 2005; Ransbotham, Mitra,and Ramsey 2012; Cavusoglu, Cavusoglu, and Raghunathan, 2007 Arora, Telang, and Xu 2008), thedesign of incentives and liability with respect to vulnerability remediation (August, Dao, and Kim, 2019;August and Tunca. 2011; Cavusoglu, Cavusoglu, and Zhang 2008), and the efficacy of strategies that firm
take when attempting to prioritize the vulnerabilities they address (Dey, Lahiri, and Zhang 2015; Beattieet al. 2002; Allodi and Massacci 2014). A consistent finding in this stream of research is that the statusquo for how organizations address vulnerability remediation is often suboptimal and has significant roomfor improvement. For example, Allodi and Massacci (2014) evaluate the effect on exploit risk ofprioritizing vulnerabilities with high severity scores (a common practice in organizations) is equivalent torandomly selecting vulnerabilities to address.Our work also relates to an emerging body of research coupling machine learning methods with diversefeature sets drawn from information security contexts and explores the value of prediction for informationsecurity management (Münz, Li, and Carle, 2007; Lakhina, Crovella, and Diot 2004; Garcia-Teodoro etal., 2009; Lakhina, Crovella, and Diot 2004). This literature holds significant potential value for a fewreasons. First, information security contexts are marked by considerable technical and managerialuncertainty. The management of this uncertainty is exacerbated by the limited resources that mostorganizations dedicate to security. Second, there are long-standing challenges with properly leveragingmassive collections of data (network traffic data, user logs, etc.) that hold within them relevant insightsfor efficiently managing current and future security risks. For instance, current tools are often inadequateat prioritizing and identifying key risks and often inundate security professionals with too many alerts andfalse alarms. As a result, critical warnings are either never generated or lost in a sea of other, often lessimportant, warnings. Third, vulnerabilities may be unknown to organizations (e.g. zero days) and thusdifficult to identify with standard approaches. In these cases, machine learning methods (e.g. thosefocused on anomalous pattern detection) can identify new attacks by recognizing changes in network oruser behavior (Garcia et al. 2009; Münz, Li, and Carle, 2007).A nascent stream in this body of work most directly relates to our work and combines machine learningapproaches with a variety of datasets in order to reduce the uncertainty surrounding exploit risk ofdisclosed vulnerabilities (Bozorgi et al. 2010; Sabottke, Suciu, and Dumitras 2015; Edkrantz and Said2015; Bullough et al. 2017). While these works start to bridge the gap between vulnerabilities and thereal-world risk they present to systems, the majority of these works (with the exception of Sabottke,Suciu, and Dumitras 2015) focus on vulnerabilities with a published exploits as opposed to an exploitobserved in the wild. This is because predicting actual exploits in the wild remains a difficult predictionproblem. In particular, and as we noted previously, exploits in the wild are rare. Of all the vulnerabilitiesthat are disclosed, only a small subset have written exploits. Even fewer still have exploits which areweaponized and become available as part of hacking toolsets. Smaller still is the proportion of exploits
that are observed in use in the real world (e.g. on corporate networks). For example, prior works find thatless than 1.4% of disclosed vulnerabilities are observed in the wild.This raises two notable problems for these prediction efforts. First, classification methods have troubledisentangling rare events and require rich feature sets to differentiate vulnerabilities with high risk ofexploit from more benign vulnerabilities. Second, there is limited ground truth data on which exploits areactually being levied against organizations. For example, Sabottke, Suciu, and Dumitras (2015) utilizeavailable signature databases from Symantec to identify vulnerabilities likely to be in the field, but thesedata have notable limitations as they are not based on actual network traffic from corporate networks andonly capture vulnerabilities in Microsoft products. As we discuss in the following section, a keycontribution of our work is to address these data limitations to build a more accurate and usable predictionmodel for vulnerability remediation. We do so by leveraging a unique set of features for prediction andamalgamating data sources to more comprehensively capture exploits that exist in the wild.DataThis paper leverages multiple datasets collected in partnership with Kenna Security, a large, U.S.-basedvulnerability and threat management company.3 As a foundation, we use a dataset of vulnerabilitiespublished by MITRE’s Common Vulnerability Enumeration (CVE) effort between 2009 and 2018. TheCVE list is widely known, and is the authoritative source of publicly known vulnerabilities. MITRE’senumeration includes a unique identifier (CVE number), a short free-text description, and a list ofreferences to additional details of the vulnerability (in the form of URLs). After cleaning, and includingonly valid and fully documented vulnerabilities, this dataset contains over 75k observations. While CVEdata exists for years prior to 2009 and past 2018, we limit the sample for the availability of data across allcategories of features.We also collect additional information for each CVE. We use NIST’s National Vulnerability Database(NVD) to gather the vulnerability score and vulnerability characteristics, as defined by the CommonVulnerability Scoring System (CVSS). We also collect the Common Platform Enumeration (CPE)information, which provides a standard machine-readable format for encoding names of IT products,platforms and vendors.Next, we retrieved the descriptive text from the list of references present in each CVE. We then extractedcommon multiword expressions from the raw text using Rapid Automatic Keyword Extraction (Rose et3See http://www.kennasecurity.com
al, 2010) and manually culled and normalized a list of 191 tags encoded as binary features for eachvulnerability.For each vulnerability, we also gather real-world information about its prevalence and exploitability. Firstwe gather information about whether exploit code was written and published for it, and then whether thevulnerability was exploited in real-world attacks. These are related, but not identical data points. Theformer relates only to vulnerabilities for which exploit code has been written (but not used), and the latterrelates to actual exploits observed in (at least attempted) malicious attacks. Since there is no authoritativeor complete source of exploit information, exploit data were assembled across many sources. Datarelating to exploits found in the wild were collected from the collective intelligence of FortiGuard Labs4which draws from Fortinet’s vast array of devices/sensors collecting billions of threat events and incidentsobserved in live production environments around the world. Evidence of exploitation was also collectedfrom SANS Internet Storm Center, Secureworks CTU, Alienvault’s OSSIM metadata, and ReversingLabs metadata. Information about written exploit code comes from Exploit DB, multiple exploitationframeworks (Metasploit, D2 Security’s Elliot Kit and Canvas Exploitation Framework), Contagio,Reversing Labs, and Secureworks CTU. In total, we acquired 4,183 observations of unique exploits usedin the wild, and 9,726 observations of written exploit code.Finally, through Kenna Security, we obtained a count of the prevalence of each vulnerability derived fromscans of hundreds of corporate (customer) networks derived from vulnerability scanner information. Thisrich feature-set of real-world data is used to enhance the performance of the models.Note that we removed those features that were sparsely populated with zero or near-zero variance. Forbinary variables, near zero-variance was set at a threshold 0.5%, and so features with less than 0.5%unique values were removed. Summary information for these data are shown in Table 1.Table 1: Data SummaryData Type4Source(s)Observations(n)Features(p)5CVE Number6Mitre CVE database, 2009-201875,976-CVSS score7NIST’s NVD75,42320See https://fortiguard.com/This refers to the number of variables collected per data source.6The CVE number is just an identifier to tie disparate data sets and was not used in any model7The version 2 base score, temporal score, and the 6 base metrics, each with 3 values per metric.5
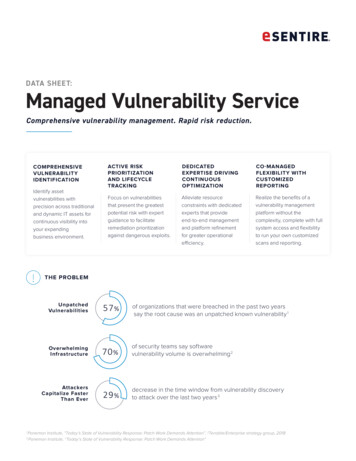
Products affected8NIST’s CPE75,58243Vendor affected9NIST’s CPE75,58226Reference ListsMITRE’s CVE list75,97631Vulnerability TagsText Scraped from referenced URLslisted in MITRE’s CVE list68,49183Exploitationobserved in thewildFortiGuard Labs, SANS Internet StormCenter, Securewords CTU, AlienvaultsOSSIM metadata, and Reversing Labsmetadata.9,7261Exploit codepublishedExploit DB, exploitation frameworks(Metasploit, D2 Security’s Elliot Kit andCanvas Exploitation Framework),Contagio, Reversing Labs andSecureworks CTU4,1834Vulnerabilityprevalence dataKenna Security35,405110Next, we highlight three of the key data sources used in our prediction models, CVSS scores, publishedexploits, and reference tagging.CVSSThe Common Vulnerability Scoring System (CVSS v2) was first developed in 2003 and has become aninternational11 and de facto standard for measuring the severity of a vulnerability. CVSS produces anumeric score between 0 (lowest severity) and 10 (highest severity) and is fundamentally an ordinal scale,based on 6 immutable characteristics of a vulnerability, and is independent of any user environmentalconfigurations, security controls, or known exploits. Figure 2 shows descriptive information regarding thedistribution of vulnerabilities by CVSS (v2) score. In addition, for each integer range, we show the8Initially we constructed a dataset of 28,647 product names, but reduced this to 43 features that exceeded thresholdfor determining near zero-variance.9Initially we constructed a dataset of 11,554 attributes, but this was again reduced to the 26 most common withoutnear-zero variance.10Initially we constructed a dataset of 191 commonly use expressions, but this was again reduced to the 83 mostcommon without near-zero variance.11ITU-T X.1521.
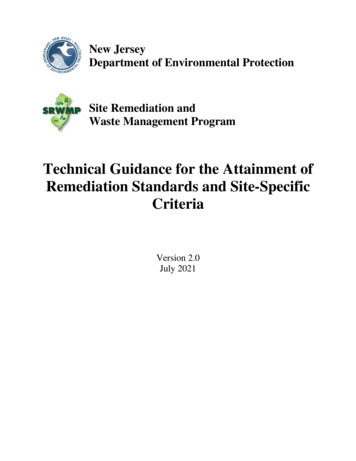
proportion of vulnerabilities that have been exploited. For example, of all vulnerabilities, 4,686 weregiven a score of 10, of which almost 17% of which were observed to be exploited.Figure 2: Exploited vulnerabilities, by CVSS severityVisual inspection shows that vulnerabilities with a CVSS score of 9 or 10 have a higher proportion ofexploited vulnerabilities, relative to the base rate of 5.5%. Also, just under half of all exploitedvulnerabilities have a CVSS score of 9 or higher.Published ExploitsAs mentioned, we consider published exploits to be software code posted publicly and designed tocompromise a weakness in another software application, while exploits in the wild are instances of thiscode observed to be targeted at actual corporate networks. There is an important relationship to notebetween published exploits, and exploits found in the wild, as shown in Figure 3.Figure 3: Published exploits vs exploits in the wild
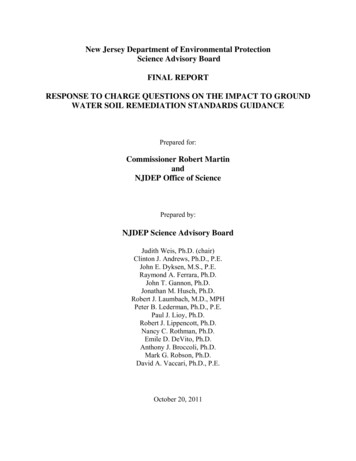
First, notice that overall our dataset contains 9.7k published exploits, and 4.2k observed exploits in thewild. That is, about 12.8% (9.7k / 76k) of all vulnerabilities between 2009 and 2018 had published exploitcode, while only about 5% (4.2k / 76k) of all vulnerabilities were exploited in the wild. Further, onlyabout half of all exploited vulnerabilities (2.1k) have associated published code. This is, in itself is, animportant finding because it suggests the need for an improved approach to vulnerability remediation.Specifically, previous research has used published exploits as the outcome target, while exploits in thewild represents, what we believe, is the preferred outcome measure. A table of results for all years isprovided in the Appendix.Reference taggingReference tags as used in our data are collected by a multistep process. We first begin by using the textdescription from MITRE’s CVE list, then scrape the text from the URLs listed in the references. We thenextract “multi-word expressions” from the text and then manually curate a list of multi-word expressions. Note that other research uses a simple “bag of words” (single word frequencies independent of context)approach. The result is tagging vulnerabilities with expressions like “code execution,” “directorytraversal,” “sql injection,” and “denial of service.”Our justification for identifying the multi-word expressions is that there is a significant difference inexploiting a “memory corruption” vulnerability and a “double free memory” vulnerability. Usingmulti-word expressions enables us to isolate those two concepts into 2 distinct features.Additionally, we found that the brief text descriptions in MITRE’s CVE list did not adequately capture allthe complexities behind each vulnerability. By scraping the referenced websites in each CVE, we expectto achieve a more complete text descriptions of attributes that may be sought out and exploited byattackers (e.g. authenticated, local/remote, labels and phrases that describe the vulnerability itself, and theimpact). The use of the Rapid Automatic Keyword Extraction (Rose et al, 2010) technique along withmanual curation was used to tag concepts within each vulnerability and is expected to outperformprevious. Figure 4 shows a random selection of 20 tags from the CVE references, along with the overallfrequency (text at the top of each bar) and the proportion of vulnerabilities with that tag that wereobserved to be exploited in the wild. After removing tags with near-zero variance, our final reference tagfeature set has 83 individual tags.
Figure 4: Prevalence and exploitation of multiword expressions (20 randomly sampled shown).Next, we describe the model evaluation criteria and machine learning configuration.Model DevelopmentExploited in the wild as the Outcome MeasureBefore we describe the modeling approach, we first describe what we mean by risk and therefore how weclassify a high-risk vulnerability. Many information security best practices, including the U.S.-basedNIST recognize that risk is a combination of threat (capability and intent of the threat actor), vulnerability(weakness or exposure) of the targeted system, and the impact (consequence or disruption) to theorganization conditional on a successful attack (See Figure 3, p12, NIST SP 800-30). In this research, weseek to develop vulnerability remediation strategies that are agnostic to individual firms, and so werestrict our definition of risk by abstracting away firm-specific criteria such as a firm’s security controlsand impact to the organization. As a result, for the purpose of this article, our use of risk reflects threatonly -- the exposure posed by an exploitable vulnerability. As mentioned, while previous work uses published exploits, we believe this is a premature measure, andthat the most appropriate measure of threat relates to whether a vulnerability has actually been exploitedin the wild, and if it has, we then consider the vulnerability to pose a high risk to the organization.Evaluation criteriaThroughout our analysis, we will evaluate the performance of the models along four dimensions:coverage, efficiency, accuracy, and level of effort.Coverage (recall) and efficiency (precision) are two common evaluation criteria used in informationtheory and machine learning (classification) models. In our context, coverage measures the completeness
of remediation. For example, of all vulnerabilities that should be remediated, what percentage waspatched?: if 100 vulnerabilities are being exploited, and yet only 15 are remediated, the coverage of thisprioritization strategy is 15%. Coverage is represented mathematically as the true positives divided by thesum of the true positives and false negatives, or TP / (TP FN), and is maximized as the number of falsenegatives tends to zero.On the other hand, efficiency measures the optimality of remediation efforts. Of all vulnerabilitiesremediated, what percentage should have been addressed? For example, if we remediate 100vulnerabilities, but only 15 are ever exploited, the efficiency of this strategy would be 15%. The other85% represents resources that would have been better spent elsewhere. Efficiency is representedalgebraically as true positives divided by the sum of the true positives and false positives, or TP / (TP FP), and is maximized as the number of false positives tends to zero.The ideal strategy, of course, achieves 100% coverage and 100% efficiency (i.e. only patch those that youneed to, and no more), but a trade-off exists between the two. A strategy that prioritizes only high-riskvulnerabilities may have a good efficiency, but it comes at the price of low coverage, because manyvulnerabilities with existing exploits have a low severity score. Conversely, we could improve coverageby remediating more vulnerabilities with high severity scores, but suffer in efficiency due to fixingvulnerabilities that were never exploited and therefore pose lower risk.Accuracy measures the overall correctness of predictions. Accuracy is the sum of the true positives andnegatives divided by the sum of samples, or (TP TN) / (TP TN FP FN). 12A given set of coverage and efficiency parameters uniquely defines the performance of a remediationstrategy. What this does not explicitly communicate, however, is the number of vulnerabilities that theorganization would need to patch in order to satisfy that strategy. Therefore, we define level of effort, asone measure of the cost to a firm from that remediation strategy.13Basic and machine learning modelsIn the next section we explore 3 distinct vulnerability remediation strategies that firms may employ. Eachstrategy uses a different set of features (i.e. distinct independent variables), and for each strategy, we firstcompute the outcome parameters (coverage, efficiency, accuracy, and the level of effort) from a simple12This particular metric can create misleading results when the data is imbalanced such as we have in theexploitation data. Since only 5.5% of our vulnerabilities have been observed exploited in the wild, a simple model ofremediating nothing yields 94.5% accuracy.13Certainly this is an imperfect measure of the cost of patching to firm because of the many efficiencies of scaleinvolved in enterprise patch management.
rule-based approach, and then compare those results to a machine learning model using the same featuresets (but which computes additional variable interactions).All machine learning models are gradient boosted trees, generated with Extreme Gradient Boosting(XGBoost) (Chen and Guestrin, 2016). We also explored using the Random Forest and linear SVMalgorithms. However with the area under the precision-recall curve being 0.51 for random forest and0.494 for the linear SVM, we selected XGBoost as our final model with the AUC of 0.5514. Because ofthe extreme class imbalance, we down-sampled (Kubat and Matwin, 2000) the majority class duringtraining. However when evaluating the models we use the entire (unbalanced) test sample. Because of thesparseness of some features, we performed 5-fold stratified cross-validation repeated 5 times to limitpossible over-fitting in the training. Since each model produces a probability that a particular sample willor will not be exploited-in-the-wild, a cutoff must be selected to classify the data. This cutoff is tunable ina way that can balance efficiency vs coverage. We select a cutoff value which maximizes the F1 score(Chinchor, 1992), which is the weighted harmonic mean of coverage and efficiency.Feature-Based Remediation StrategiesCVSS ScoreA primary aspect of vulnerabilities often considered during remediation decisions is the severity or impactthat a vulnerability would have if it were successfully exploited. Assigning remediation efforts based onCVSS score has become a familiar and popular means of prioritizing patching, especially given howCVSS considers scores from 7-8.9 to be “high severity,” while scores above 9.0 are critical. For example,The U.S. Department of Homeland Security (DHS) issued a binding operational directive to federalagencies, requiring them to patch critical vulnerabilities within 15 days and high severity ones within 30days.15 In addition, the Payment Card Industry Data Security Standard (PCI-DSS) requires that allmerchants remediate vulnerabilities with a CVSS score above 4.0 (PCI, 2018).The prediction results for a firm adopting a remediation strategy driven by CVSS score, including themachine learning model which accounts for interactions, are shown in Table 2. For brevity, we only showtabular results for 4 rules-based strategies, while we display full results in Figure 5
Keywords: vulnerability management, exploited vulnerability, CVSS, security risk management, machine learning, precision, recall . is adopting a vulnerability management process that can detect, and remediate known vulnerabilities. 1 Unfortunately, despite decades of research and technical innovations, there have been few advances in .