Transcription
THE VALUE OFMEDICAL INNOVATIONIN CANCER
2
“Just as energy is the basis of life itself,and ideas the source of innovation, so isinnovation the vital spark of all humanchange, improvement and progress.American EconomistTheodore Levitt”3
TABLE OF CONTENTSIntroduction4Chapter 1:Virtuous Cycle of InnovationChapter 2:Progress & ProsperityChapter 3:Living Longer, Better & HealthierChapter 4:Better Healthcare, Better OutcomesChapter 5:A World Free from Cancer
INTRODUCTIONMedical innovation is the greatest source oflonger life and economic prosperity. In the21st century, medical innovation willdramatically improve health outcomes, reducethe overall cost of healthcare and stimulatethe growth of the global economy, producinga world that can be free from cancer. Thisvirtuous cycle of innovation in turn stimulatesinvestment in biomedical research to furtherimprove health and create economic valuethroughout the world.5
6
1VIRTUOUS CYCLEOF INNOVATIONMEDICAL INNOVATION IS THE SOURCE OFLONGER LIFE AND BETTER HEALTH.We will show that among the technological innovationsof the 20th century, medical innovation has contributedmore to our ability to live longer, healthier and moreprosperous lives than anything else.Medical innovation is turning knowledge about diseasemechanisms at the genetic and cellular level intobreakthrough therapies that cure or prevent illness. Wewill demonstrate that medical innovation in particularbrings about a virtuous cycle of better health, longerlife and greater prosperity that in turn stimulatesadditional investment in even more advancedinnovations for preventing and treating disease.1VIRTUOUSCYCLE7
8
“This is the most exciting time in the historyof medicine. If we can make some radicalchanges to accommodate the enormousopportunities, there will be better health atlower costs for many generations to come.The Creative Destruction of Medicine AuthorEric Topol, MD”9
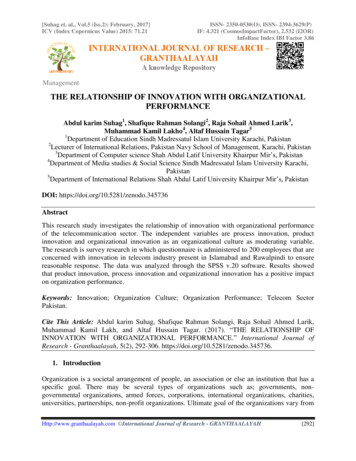
1VIRTUOUSCYCLEInnovation is a Virtuous Cycle. Requiring Commitment.Investment. Vision.InnovationInvestmentCelgene has a proven trackrecord of delivering betteroutcomes with betterhealthcare through innovation.Innovation results from continuousinvestment of time and resources bybiopharmaceutical companiessuch as Celgene.Virtuous Cycle of InnovationImprovements inhealthcare are animportant source ofgains in health,longevity andproductivityglobally.10AccessAccess and reimbursementfor current innovative therapiesfunds investment in futureinnovation.CommitmentThe unprecedented survival resultsreported with Celgene’s innovativetherapies are direct results of thecompany’s commitment to improvingthe lives of patients worldwide.
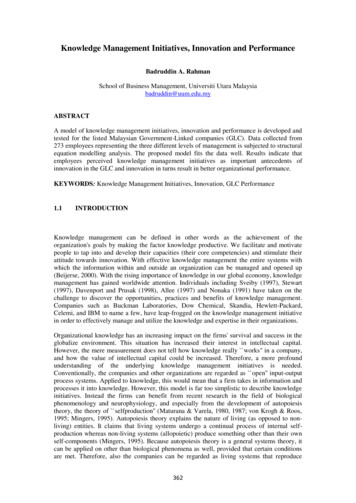
Longer Life Through Better Medicines 1900-2010Deaths per100,000people78475 62% 96%DecreaseLifeExpectancy20481987 – Azidothymidine(first HIV treatment)1936 – YellowFever Vaccine1908 – First LargeScale Adoption ofWater Chlorination1930s –PertussisVaccine1955 – PolioVaccine1940s – PenicillinFirst Used as aTreatment1935 – Sulfa Drugs(first antibiotic)1921 – Diphtheriaand TB VaccinesIncrease1974 –MeningococcalDisease Vaccine1963 – MeaslesVaccine1985 – InfluenzaVaccine1995 – Hepatitis AVaccineSource 1: The Hamilton Project at the Brookings Institution. Available /deaths from major infectious disease/. Accessed on 11/1/12.1VIRTUOUSCYCLE11
1VIRTUOUSCYCLEThe Impact of Medical InnovationIn July 1999, the U.S. Centers for DiseaseControl and Prevention’s Morbidity andMortality Weekly Report noted the death of a90-year-old woman. She had been deathly illin 1942, but as a last resort, doctors treatedher with what was then called “an obscure,experimental drug.” And this 33-year-oldwoman went from death’s door to getmarried, raise a family and live nearly 60more years. In fact, she was the first U.S.civilian whose life was saved by penicillin.12Source 2: Morbidity and Mortality Weekly Report. Achievements in Public Health, 1900-1999: Control of Infectious Diseases. Available 1.htm. July 30, 1999 / 48(29);621-629.
The Gift of Life“69U.S.47WW31New drugs are no small partof this medical miracle.Mark McClellan, FDA7969”83yrs75yrs48Life Expectancy GrowthSource 3: United Nations Development Program. World Population Prospects The 2010 Revision. Volume 1: Comprehensive Tables. Available athttp://esa.un.org/wpp/Documentation/pdf/WPP2010 Volume-I Comprehensive-Tables.pdf. Accessed 10/30/13. U.S. Food and Drug Administration. Centers for Disease Controland Prevention and National Center for Health Statistics. Health, United States, 2011: With Special Feature on Socioeconomic Status and Health. Available athttp://www.cdc.gov/nchs/index.htm. Accessed 11/12/12. Prentice T. Health, History and Hard Choices: Funding Dilemmas in a Fast-Changing World. Nonprofit and VoluntarySector Quarterly. 2008: Supplement to vol 37; no 1: 63S-75S.1VIRTUOUSCYCLE13
1VIRTUOUSCYCLELife Expectancy Gains Are Clear in the U.S.908580At Birthin Years 81.0 Women76.2 Men67.160195014196019701980199020002010Source 4: U.S. Department of Health and Human Services, Centers for Disease Control and Prevention, National Center for Health Statistics, Health,United States, 2008 With Chartbook (Hyattsville, MD: HHS, 2009); 1950-2006 data from Heron M, et al. Deaths: Final Data for 2006. National VitalStatistics Reports 57, no.14, (Hyattsville, MD: National Center for Health Statistics, August 2009): 5. Available athttp://www.cdc.gov/nchs/data/nvsr/nvsr57/nvsr57 14.pdf. Accessed June 2010]; 2007 data from Xu J, et al. Deaths: Final Data for 2007. National VitalStatistics Reports 58, no.19. (Hyattsville, MD: National Center for Health Statistics, May 2010): 13. Available athttp://www.cdc.gov/nchs/data/nvsr/nvsr58/nvsr58 19.pdf. Accessed June 2010. 2008-2009 data from K. Kochanek, et al. Deaths: Preliminary Data for2009. National Vital Statistics Reports 59, no.4, (Hyattsville, MD: National Center for Health Statistics, March 2011): 28. Available athttp://www.cdc.gov/nchs/data/nvsr/nvsr59/nvsr59 04.pdf. Accessed August 2011. 2010 data from K. Kochanek, et al. Deaths: Final Data for 2010.National Vital Statistics Reports 61, no.4, (Hyattsville, MD: National Center for Health Statistics, May 2013): 12. Available athttp://www.cdc.gov/nchs/data/nvsr/nvsr61/nvsr61 04.pdf. Accessed July 2013.14
Medical Innovation is Increasing Patient SurvivalDeaths per 100,000Cancer-Related Death Rates Have Declined Since 19902202001801601401992 1993 1994 1995 1996 1997 1998 1999 2000 2001 2002 2003 2004 2005 2006 2007 2008 20095-Year Survival Rates (%)As Cancer Patients Live 2002200320042005605040Source 5: National Cancer Institute, Surveillance Epidemiology and End Results (SEER). Available at cessed 11/14/13. Center for Disease Control (CDC) Health, United States, 2012Table 28. Death rates for malignant neoplasms, by sex, race, Hispanicorigin, and age: United States, selected years 1950–2010. Available at http://www.cdc.gov/nchs/hus/contents2012.htm#028. Accessed 11/14/13.1VIRTUOUSCYCLE15
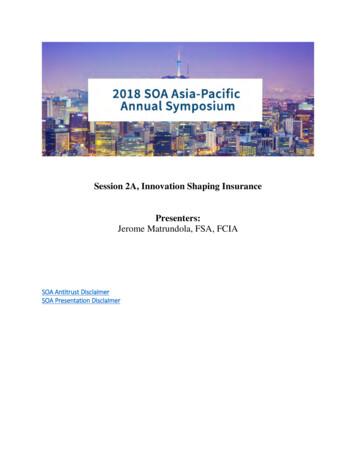
1VIRTUOUSCYCLECancer Continuum:Advancing Patients from Surviving to ThrivingAdvances in drug screeningAdvances in cancer ntifolates1976Radiationtherapy1997Cure oftesticular cancerVinca ankaloids1963First monoclonalantibody rexate inchoriocarcinoma2010 - ongoingGenomesequenced1943Nitrogen mustardin lymphomas1930Target-specificscreensCure of ALL &Hodgkin’s diseaseEvents with national impact193520071963-1970KEY1971NationalCancer ActNCI investment inmolecular biology1968-1975Immunomodulatorsepigenetics, nase inhibitorsMajor advances inthe history ofcancer treatmentAdjuvant chemotherapy19652000s - ongoingCancer linked to oncogenesPersonalized medicineSource 6: DeVita VT , Chu E. A History of Cancer Chemotherapy. Cancer Res 2008;68:8643-8653. U.S. Food and Drug Administration. Available at16www.fda.gov. Accessed 11/1/12.
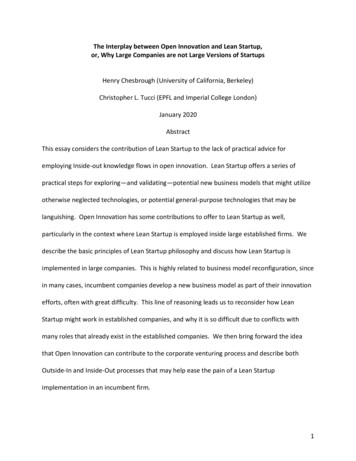
New Therapies are the Greatest Contributor toIncreased Life Expectancy40%New therapies account for 40% of theincrease in life expectancy73%New therapies account for 73% ofthe increase in life expectancySource 7: Lichtenberg FR. NBER Working Paper No. 18235. Pharmaceutical innovation and longevity growth in 30 developing and high-incomecountries, 2000-2009. Available at http://www.nber.org/papers/w18235. Accessed 10/30/13. Lichtenberg FR. NBER Working Paper No. 9754. Theimpact of new drug launches on longevity: evidence from longitudinal disease-level data from 52 countries, 1982-2001. Available athttp://www.nber.org/papers/w9754. Accessed 11/12/13.1VIRTUOUSCYCLE17
1VIRTUOUSCYCLEImpact of New Therapies on Death Rates1,50080,0001,30070,0001,100Mortality Rate(All Causes)60,00050,000Deaths per100,00090040,000700Millions ofDollars30,000500300100R&D inMillions20,00010,0000Source 8: Centers for Disease and Prevention’s National Center for Health Statistics. Health, United States, 2011: With Special Feature on Socioeconomic18 Status and Health. Available at http://www.cdc.gov/nchs/. Accessed 11/14/13. Pharmaceutical Research and Manufacturers of America, PhRMA AnnualMembership Survey, 2013. Available at www.phrma.org. Accessed 11/14/13.
Decline in Death Rates from Leading Causesin 1960 vs. 2011Liver Disease1013Pneumonia & Cancer173Heart Disease0100200559300400500600Deaths Per 100,000Source 9: Centers for Disease Control and Prevention and National Center for Health Statistics. National Vital Statistics System. 2011. Available athttp://www.cdc.gov/nchs/data/nvsr/nvsr61/nvsr61 06.pdf#page1. Accessed 11/12/12.1VIRTUOUSCYCLE19
1VIRTUOUSCYCLENotes and Sources1.The Hamilton Project at the Brookings Institution. Available at eaths from major infectious disease/. Accessed11/1/12.2.Morbidity and Mortality Weekly Report. Achievements in Public Health, 1900-1999: Control of Infectious Diseases. July 30, 1999. 48(29);621-629. Available 1.htm. Accessed 11/1/12.3.United Nations Development Program. World Population Prospects The 2010 Revision. Volume 1: Comprehensive Tables. Available athttp://esa.un.org/wpp/Documentation/pdf/WPP2010 Volume-I Comprehensive-Tables.pdf. Accessed 10/30/13. U.S. Food and Drug Administration. Centers forDisease Control and Prevention and National Center for Health Statistics. Health, United States, 2011: With Special Feature on Socioeconomic Status and Health.Available at http://www.cdc.gov/nchs/index.htm. Accessed 11/12/12. Prentice T. Health, History and Hard Choices: Funding Dilemmas in a Fast-Changing World.Nonprofit and Voluntary Sector Quarterly. 2008: Supplement to vol 37; no 1: 63S-75S.4.U.S. Department of Health and Human Services, Centers for Disease Control and Prevention, National Center for Health Statistics, Health, United States, 2008 WithChartbook (Hyattsville, MD: HHS, 2009); 1950-2006 data from Heron M, et al. Deaths: Final Data for 2006. National Vital Statistics Reports 57, no.14, (Hyattsville,MD: National Center for Health Statistics, August 2009): 5. Available at http://www.cdc.gov/nchs/data/nvsr/nvsr57/nvsr57 14.pdf. Accessed June 2010]; 2007 datafrom Xu J, et al. Deaths: Final Data for 2007. National Vital Statistics Reports 58, no.19. (Hyattsville, MD: National Center for Health Statistics, May 2010): 13.Available at http://www.cdc.gov/nchs/data/nvsr/nvsr58/nvsr58 19.pdf. Accessed June 2010. 2008-2009 data from K. Kochanek, et al. Deaths: Preliminary Data for2009. National Vital Statistics Reports 59, no.4, (Hyattsville, MD: National Center for Health Statistics, March 2011): 28. Available athttp://www.cdc.gov/nchs/data/nvsr/nvsr59/nvsr59 04.pdf. Accessed August 2011.National Vital Statistics Reports 61, no.4, (Hyattsville, MD: National Center for Health Statistics, May 2013): 12. Available athttp://www.cdc.gov/nchs/data/nvsr/nvsr61/nvsr61 04.pdf. Accessed July 2013.5.National Cancer Institute, Surveillance Epidemiology and End Results (SEER). Available at http://seer.cancer.gov/faststats/selections.php. Accessed 11/14/13.Center for Disease Control (CDC) Health, United States, 2012Table 28. Death rates for malignant neoplasms, by sex, race, Hispanic origin, and age: United States,selected years 1950–2010. Available at http://www.cdc.gov/nchs/hus/contents2012.htm#028. Accessed 11/14/13.6.DeVita VT , Chu E. A History of Cancer Chemotherapy. Cancer Res 2008;68:8643-8653. U.S. Food and Drug Administration. Available at www.fda.gov. Accessed11/1/12. . 2008 by American Association for Cancer Research7.Lichtenberg FR. NBER Working Paper No. 18235. Pharmaceutical innovation and longevity growth in 30 developing and high-income countries, 2000-2009. Availableat http://www.nber.org/papers/w18235. Accessed 10/30/13. Lichtenberg FR. NBER Working Paper No. 9754. The impact of new drug launches on longevity:evidence from longitudinal disease-level data from 52 countries, 1982-2001. Available at http://www.nber.org/papers/w9754. Accessed 11/12/13.8.Centers for Disease and Prevention’s National Center for Health Statistics. Health, United States, 2011: With Special Feature on Socioeconomic Status and Health.Available at http://www.cdc.gov/nchs/. Accessed 11/14/13. Pharmaceutical Research and Manufacturers of America, PhRMA Annual Membership Survey, 2013.Available at www.phrma.org. Accessed 11/14/13.2020
Notes and Sources9.1Centers for Disease Control and Prevention and National Center for Health Statistics. National Vital Statistics System. 2011.Available at http://www.cdc.gov/nchs/nvss.htm. Accessed 11/12/12.VIRTUOUSCYCLE21
2222
2PROGRESS &PROSPERITYMEDICAL INNOVATION LEADS TO GREATERECONOMIC GROWTH AND PROSPERITY.We will demonstrate that medical innovation leads toimproved health outcomes, lower costs, higherproductivity, reduced disability, greater economic valueto society increased wealth and expanding grossdomestic product (GDP).We will show through specific examples (polio,infectious disease, diabetes, heart disease, HIV, and inrecent years, cancer) how innovations have reduced thecost of care and increased economic well-being.The value of increasing the quality and length of life issubstantial; longer life and greater well-being leads togreater productivity and economic growth.2PROGRESS &PROSPERITY23
24
“Over the last half century, improvements inhealth have been as valuable as all othersources of economic growth andproductivity combined.”University of Chicago EconomistsKevin Murphy, Ph.D., and Robert Topel, Ph.D.25
2PROGRESS &PROSPERITYIncreasing Life Expectancy Sustains Economic Growth10.88010.47610.0729.6689.2648.8608.456Real GDP per Person (Log)Life Expectancy26 Source 1: Professor Mark J. Perry's Blog for Economics and Finance. Carpe Diem blog. Available at http://mjperry.blogspot.com/. Accessed 11/14/12.AgeReal GDP per PersonU.S. Life Expectancy vs. Real GDP per Person 1929 to 2010
Tremendous Contributions to Economic GrowthOver the past 50 years, medical innovationhas been the source of more than12of all economic growthSource 2: Murphy KM and Topel RH. The Value of Health and Longevity. J Polit Econ. 2006: 114(4); 871-904.2PROGRESS &PROSPERITY27
2PROGRESS &PROSPERITYMedical Innovation Adds Value,Reduces Costs and Saves Lives 7.20 Innovative Medicines28For every dollar spent oninnovative medicines, totalhealthcare spending isreduced by 7.20.Healthcare SpendingSource 3: Lichtenberg FR. Benefits and Costs of Newer Drugs: An Update. National Bureau of Economic Research, Working Paper No. 8996. June2007. Available at http://www.nber.org/papers/w8996.pdf. Accessed 11/14/13.28
Greatest Source of Jobs in 21st CenturyEach directbiopharmaceutical jobsupports 5 additional jobsin other sectorsOPENBIOPHARMA JOBSMore than 810,000 jobs in theU.S. biopharmaceutical sectorTOTAL JOBS SUPPORTED3.4 million total U.S. jobs supportedby the biopharmaceutical sectorSource 4: Battelle Technology Partnership Practice. The U.S. Biopharmaceuticals Sector:Economic Contribution to the Nation. July 2013. Available at f.Accessed 7/23/12.2PROGRESS &PROSPERITY29
2PROGRESS &PROSPERITYHuman Genome ProjectWhy Incentivize the Innovators? 3.8 billionU.S. Investment in theHuman Genome Project30ROI on Human GenomeProject: 796 billion310,000 jobsSource 5: Celebration of Science. Available at www.celebrationofscience.org/about. Accessed 9/10/12.
Investments in Medical Innovation YieldSignificant Future Health Benefits to Society 1 3Invested inMedical InnovationValue ofFuture Health BenefitsSource 6: Hughes JW, Moore MJ and Snyder EA. “Napsterizing” Pharmaceuticals: Access, Innovation, and Consumer Welfare. Published 1/19/11.Available at ts/snydermoorehughes.pdf. Accessed 11/15/13.2PROGRESS &PROSPERITY31
2PROGRESS &PROSPERITYNotes and Sources1.Professor Mark J. Perry's Blog for Economics and Finance. Carpe Diem blog. Available at http://mjperry.blogspot.com/. Accessed 11/14/12.2.Murphy KM and Topel RH. The Value of Health and Longevity. J Polit Econ. 2006: 114(4); 871-904.3.Lichtenberg FR. Benefits and Costs of Newer Drugs: An Update. National Bureau of Economic Research, Working Paper No. 8996. June 2007. Available athttp://www.nber.org/papers/w8996.pdf. Accessed 11/14/13.4.Battelle Technology Partnership Practice. The U.S. Biopharmaceuticals Sector:Economic Contribution to the Nation. July 2013. Available at . Accessed 7/23/12.5.Celebration of Science. Available at www.celebrationofscience.org/about. Accessed 9/10/12.6.Hughes JW, Moore MJ and Snyder EA. “Napsterizing” Pharmaceuticals: Access, Innovation, and Consumer Welfare. Published 1/19/11. Available ents/snydermoorehughes.pdf. Accessed 11/15/13.3232
2PROGRESS &PROSPERITY33
34
3LIVING LONGER,BETTER AND HEALTHIERRECENT MEDICAL INNOVATIONS IN CANCER ARELEADING TO LONGER LIFE, BETTER HEALTH,MORE PRODUCTIVITY AND LOWER HEALTH CARECOSTS.This section will show what has been accomplished inthe last 20 years. We have made substantial progress inhelping people become free from cancer, allowing themto live longer, healthier lives.Innovative cancer treatments that produce longer andbetter lives also reduce the cost and complexity ofcancer care. As with other diseases discussed, peopletreated for cancer can live and prosper as well assomeone without the illness. Much of this progress hasoccurred in just the past five to 10 years.3LIVING LONGER,BETTER & HEALTHIER35
36
“In 2005, a man diagnosed with multiple myeloma askedme if he would be alive to watch his daughter graduatefrom high school in a few months. In 2009, bound to awheelchair, he watched his daughter graduate fromcollege. The wheelchair had nothing to do with hiscancer. The man had fallen down while coaching hisyoungest son's baseball team.”The Emperor of All Maladies AuthorDr. Siddhartha Mukherjee37
3LIVING LONGER,BETTER & HEALTHIERProgress Against Diseases 1960-201219811965Surfactants forInfantRespiratoryDistress1974First ACEInhibitor to TreatHigh BloodPressure19631986Measles Vaccine1967First BetaBlockers38Statins forCholesterolSSRIs(Anti-depressants)Polio Vaccine1981Hepatitis BVaccineFirst BloodThinners forHeart Attack,Stroke19891987MeningococcalDisease -angiogenicApproved forColon CancerEpigeneticApproved forMyelodysplasticSyndrome2010TargetedTherapies forLung, Colon,Prostate andSkin CancerBreast Cancer Rx1995 – AIDS RxAdvance (HAART)1993FirstAlzheimer’sRx 19951989First HIV DrugsNew HIVDrugs2002ProteasomeInhibitor Approvedfor MultipleMyeloma20082001Targeted1996TherapyFirst EnzymeApproved forReplacement Drug for LeukemiaGaucher's DiseaseImmunomodulatorApproved forMultiple MyelomaSource 1: American Society of Clinical Oncology’s CancerProgress.net. Available at www.cancerprogress.net. Accessed 11/12/12. Müller DC, Ellen MA, Duffy MC, et al.Timeline: 200 Years of the New England Journal of Medicine. N Engl J Med 2012; 366:e 3January 5, 2012DOI: 10.1056/NEJMp1114819 . Available 9. Accessed 11/12/13. U.S. Food and Drug Administration. Hematology/Oncology (Cancer) Approvals & SafetyNotifications. Available at eddrugs/ucm279174.htm. Accessed 11/12/13.
The Worldwide Cost of CancerEconomic value of disability-adjusted life-years lost (U.S. billion) in 2008895.2Cancer753.2Heart Diseases298.2Cerebrovascular 145.424.88.1Diabetes MellitusRoad Traffic AccidentsChronic Obstructive Pulmonary DiseaseHIV/AidsPerinatal ConditionsSuicidesLower Respiratory InfectionsCirrhosis of the LiverDiarrheal DiseasesTuberculosisMaleriaMeasles0100200300 B4005006007008009001000Source 2: Soerjomataram I, et al Global burden of cancer in 2008: a systematic analysis of disability-adjusted life-years in 12 world regions. Lancet 2012;10.1016/S0140-6736(12)60919-2.3LIVING LONGER,BETTER & HEALTHIER39
3LIVING LONGER,BETTER & HEALTHIERIncreased Life Expectancy Driven by MedicalProgress, Including in Heart Disease and Cancer650600550500Deaths per 450100,000 0% of Deaths Due to Heart Diseases198019902000% of Deaths Due to Cancer201062Life ExpectancySource 3: Centers for Disease Control and Prevention’s National Vital Statistics System. Available at www.cdc.gov/nchs/nvss.htm. Accessed 11/15/13.40 Centers for Disease Control and Prevention and National Center for Health Statistics. Health, United States, 2011: With Special Feature on SocioeconomicStatus and Health. Available at http://www.cdc.gov/nchs/index.htm. Accessed 11/12/13.
Cancer Innovation Tells the Story1War onCancer – 1972Annual 0.5Percent0Change inDeath Ratefrom Year of DeathDeath Rate from Cancer Has Been on the Decline for Over 30 YearsSource 4: Kort EJ, Paneth N, Vande Woude GF. Cancer Res. 2009;69:6500-6505.National Cancer Institute, Surveillance Epidemiology and End Results (SEER). Available athttp://seer.cancer.gov/csr/1975 2009 pops09/browse csr.php?section 18&page sect 18 table09.html. Accessed 7/25/13.3LIVING LONGER,BETTER & HEALTHIER41
3LIVING LONGER,BETTER & HEALTHIERFive-Year Survival Rates for People with CancerContinue to Climb805-Year Survival Rates (%)706050495056606367403020100424953611975-1977 1978-1980 1981-1983 1984-1986 1987-1989 1990-1992 1993-1995 1996-1998 1999-2008Source 5: National Cancer Institute, Surveillance Epidemiology and End Results (SEER), Available at http://seer.cancer.gov/. Accessed 11/12/12.
Cost of Treating Cancer Remains Small Portionof Total Health Care 6319721980198519901995200420052010Source 6: U.S. Department of Health and Human Services. Centers for Medicare and Medicaid Services. Available at http://www.cms.gov/. Accessed11/14/13. Mariotto AB, Yabroff KR, Shao Y, et al. Projections of the Cost of Cancer Care in the United States: 2010–2020. J Natl Cancer Inst. 2011.103 (2); 117.3LIVING LONGER,BETTER & HEALTHIER43
3LIVING LONGER,BETTER & HEALTHIERNew Cancer Therapies: Small Cost,Large Impact on SocietyOtherPrescriptionDrugs 0.8%Cancer-Related TherapiesDoctorsHospitalizationDentalOnly 10% of U.S. healthcarespending is dedicated to newtherapies, with cancer treatmentsaccounting for 0.8%.All Healthcare-Related Costs44Source 7: Centers for Medicare and Medicaid Services. National Health Expenditure Data. Available at ExpendData/Downloads/Proj2011PDF.pdf. 2011. Accessed 11/15/13. Statista. Statistics andfacts about cancer in the U.S. Available at us/. Accessed 11/15/13.
Living Longer, Better and Healthier Benefits SocietyA1%REDUCTIONImprovedquality of lifeStimulates theeconomy* 500 BillionIn Societal ValueMaximized lifeexpectancyin CANCER-relatedDEATHS in the U.S.*Extended survival contributes to economic stimulus by affording people more time to purchase and enjoy leisure activitiesSource 8: Murphy KM and Topel RH. The Value of Health and Longevity. J Political Econ 2006: 114; 5; 871-904.3LIVING LONGER,BETTER & HEALTHIER45
3LIVING LONGER,BETTER & HEALTHIEREstimated Value of Additional Life Years Gained fromInnovative Cancer Treatments 1990-201350 MillionLife Years46 4.8TrillionGDPSource 9: Estimate derived from the National Bureau of Economic Research. Sun EC, Jena AB, Lakdawalla DN, et al. An Economic Evaluation of theWar on Cancer. NBER Working Paper No. 15574. Issued in December 2009. Available at http://www.nber.org/papers/w15574. Accessed 11/16/12.Updated 7/22/13. Methodology discussed at http://valueofinnovation.org/about-the-clock.html le/Philipson%20FF.pdf.
“ ”I planted a new rose bush every time I underwent a treatment. Now, I’ve gota regular garden. The bees love them. So do I. Reminds me of all I’ve gonethrough to get here.– Multiple Myeloma Patient3LIVING LONGER,BETTER & HEALTHIER47
3LIVING LONGER,BETTER & HEALTHIERMyeloma Survivorship Rapidly Increasing200981,089Survivors200046,86573%Increase in Myeloma SurvivorsSurvivors48Source 10: National Cancer Institute, Surveillance Epidemiology and End Results (SEER). Cancer Statistics Review: 1975-2009. Estimates of completeprevalence. Available at http://seer.cancer.gov/csr/1975 2009 pops09/. Accessed 11/15/13.
Advances Made in Myeloma Point to aBrighter FutureDr. Brian DurieInternational Myeloma Foundation Chair,Professor of Medicine, Hematologist/Oncologist,Cedars-Sinai Outpatient Cancer Center,Los Angeles“W ith the noveltherapies w e're seeing aquantum leap in tw o-yearsurvival from 50% to now93% , w hich is just 3%short of w hat a healthyperson of a com parableage could expect.”3LIVING LONGER,BETTER & HEALTHIER49
3LIVING LONGER,BETTER & HEALTHIERSurvival Rate for Myeloma Patients Soarwith New Innovative Therapies5-year relative survival rate, myeloma5-YearSurvivalRates (%)32.633.841.450%INCREASE1992-200828.426.6Year of diagnosis50Source 11: National Cancer Institute. Surveillance Epidemiology and End Results (SEER). SEER 18 Regs Research Data Hurricane Katrina ImpactedLouisiana Cases, Nov 2011 Sub, Vintage 2009 Pops (2000-2009) Katrina/Rita Population Adjustment. Analysis based on seer.cancer.gov/seerstat.Version 8.1. Accessed 10/31/13.
Five-Year Survival from MyelodysplasticSyndromes (MDS) Increasing 60%24%38%Source 12: Smout R, Horn S, Goldberg R. Age Period Cohort Analysis of Cancer Survival In SEER 18 Registry. Center for Medicine in the Public Interest.3LIVING LONGER,BETTER & HEALTHIER51
3LIVING LONGER,BETTER & HEALTHIERChronic Myeloid Leukemia (CML) PatientsBenefiting from Medical Innovation805-YearSurvivalRates (%)604020052Source 13: SCB Analysis, National Cancer Institute, Surveillance Epidemiology and End Results (SEER). Available . Accessed 7/31/13.
Significant Strides Made in Reducing MortalityRates Among Hard-to-Treat Blood CancersMORTALITY RATE PER 100,000 PEOPLE FROM 1992-201019%43%67%*Includes people aged 0 to 19Source 13: National Cancer Institute, Surveillance Epidemiology and End Results (SEER). Available at http://seer.cancer.gov/. Accessed 7/31/13.3LIVING LONGER,BETTER & HEALTHIER53
3LIVING LONGER,BETTER & HEALTHIERImproving Non-Hodgkin Lymphoma (NHL) Diagnosisand Survival80605-YearSurvivalRates (%)4020054Source 13: SCB Analysis, National Cancer Institute, Surveillance Epidemiology and End Results (SEER). Available at http://seer.cancer.gov/faststats/.Accessed 7/31/13.
Advances Continue in Breast Cancer100805-YearSurvivalRates (%)Based onYear ofDiagnosis6040200Source 13: SCB Analysis, National Cancer Institute, Surveillance Epidemiology and End Results (SEER). Available at http://seer.cancer.gov/faststats/.Accessed 7/31/13.3LIVING LONGER,BETTER & HEALTHIER55
3LIVING LONGER,BETTER & HEALTHIERLung Cancer 5-Year Survival Rate on the Rise25AgesSurvival Rate20 501550-5960-691070-79580 015623Years45Source 12: Smout R, Horn S, Goldberg R. Age Period Cohort Analysis of Cancer Survival In SEER 18 Registry. Center for Medicine in the Public Interest.
Hopeful Signs in Extending 5-Year SurvivalAmong Patients with Pancreatic Cancer109AgesSurvival Rate876543245-546.750 55-644.743.93.32.765 65-7475 101996-19981999-20082001-2008Source 12: Smout R, Horn S, Goldberg R. Age Period Cohort Analysis of Cancer Survival In SEER 18 Registry. Center for Medicine in the Public Interest.3LIVING LONGER,BETTER & HEALTHIER57
Notes and Sources3LIVING LONGER,BETTER & HEALTHIER1.American Society of Clinical Oncology’s CancerProgress.net. Available at www.cancerprogress.net. Accessed 11/12/12. Müller DC, Ellen MA, Duffy MC, et al.Timeline: 200 Years of the New England Journal of Medicine. N Engl J Med 2012; 366:e 3January 5, 2012DOI: 10.1056/NEJMp1114819 . Available 9. Accessed 11/12/13. U.S. Food and Drug Administration. Hematology/Oncology (Cancer) Approvals & SafetyNotifications. Available at eddrugs/ucm279174.htm. Accessed 11/12/13.2.Soerjomataram I, et al Global burden
Medical innovation is the greatest source of longer life and economic prosperity. In the 21 st century, medical innovation will dramatically improve health outcomes, reduce the overall cost of healthcare and stimulate the growth of the global economy, producing a world that can be free f