Transcription
CVEN 2012Name:Group #:FIELDBOOK(Lab Manual Spring 2016)Lab #Date:Signature:TOPIC:1234567891011Sr. Instructor: Milan HalekWebsite: http://bechtel.colorado.edu/ halek/index
Lab #1: IntroductionObjectives:1.Create a freehand topographical sketch of your group’s plot of land.2.Practice converting angles from decimal degrees to DMS (Degrees Minutes Seconds), and backby hand and with the calculator.Equipment:Field book, pencil, and calculatorLab Procedure:Topographical SketchCreate a sketch of your plot of land on the data page below.AnglesBy Hand:DMS to decimal:760 5.1019 606 5 6' 7" 5 Decimal to DMS:5.1019 5 (0.1019 60)' 5 6.114 ' 5 6'(0.114 60)" 5 6' 7"With your calculator (TI 83/84 and 89 shown here):1. Press the ‘Mode’ key, and verify that angles are set to degrees, and NOT radians.2. It is simple to work with angles on TI calculators. Simply type in the examples like the onesshown below. The difficult part is finding the , ‘, “, and DMS symbols.- For the TI83/84, the “ symbol is just above the key. The ‘ DMS symbols arefound under the Second Angle menu.- For the TI89, the ‘ “ symbols are found on the keypad, and thefound under the Second Math menu.3. Practice the conversions shown below.Input: 5 6’7”Output: 5.10194Input: 5.1019444 DMSOutput: 5 6’7”Input: (23 3' 45" 32 43'12") DMSOutput: 55 46’57”Input: 359 52' 32.3"(21.568222 /24) 180 37'25.5" 360 DMSOutput: 144 2’7.2” DMS symbol is
Lab #1: IntroductionNote PageName:Phone:E-mail:Crew #:Crew Members:Weather:Equipment:Notes:
Lab #1: IntroductionData Page - Topographical Sketch (Free-hand)
Lab #2: Interior Angle MeasurementObjectives:3.Practice theodolite setup (Centering, Leveling)4.Measure angle twice at direct and reversed position. Repeat the process for each of three points.5.Practice computing adjusted angles from measured data.Equipment:Theodolite, Tripod, Rod, Plumb bob, and Field BookLab ProcedureCenteringOur theodolites have two types of centering features. One is an optical plumb bob, and the other is alaser plumb bob. A little scope is located at the lower part of the theodolite. Through the scope, locatethe rebar or point of beginning. Some of the theodolites are equipped with a laser plumb bob, in thiscase, locate the laser right on the center of the rebar.Approximate levelingLevel the instrument with the adjustable legs of the tripod. Doyour best to bring the air bubble as close as possible to centerLeveledUnleveledmark. Adjusting the length of the tripod legs, without movingthem, does not change the location of the point that the opticalplum bob or laser is pointed at.Fine tune levelingLeveling with leveling screws changes the location of the pointthat the optical plum bob or laser is pointed at. Therefore, use itonly for fine tune. A circular level bubble can be found on one side of the scope. Operate threeleveling screws to locate the bubble to the center of the circular window. Three leveling screws arelocated at the bottom of the scope. Turning each screw, raise or lower one side of the plate. Startingwith any two three screws, rotate them simultaneouslyinward or outward as the picture on the left shows.Turning two screws simultaneously clockwise orcounterclockwise won’t do anything.
Lab #2: Interior Angle MeasurementAngle MeasurementMeasuring Interior Angle at each of your three points1.Setup the equipment at one of your point (center and level the equipment)2.Take a Direct Reading and record.3.Plunge the scope4.Take a Reverse Reading and record5.Repeat the process for other two pointsRecording the DataT @ A, CWBCInterior AngleAngle AdjustmentStationABCDirect0 00’00”60 00’00”60 00’00”Reverse180 00’00”240 02’20”60 02’20”Measured60 01’10”60 00’00”59 59’50”Sum 60 01’10” 60 00’00” 59 59’50” 180 01’00”Misclosure: 0 01’00”Adjustment: - 0 01’00” / 3 - 0 00’20”Mean60 01’10”Adjusted60 00’50”59 59’40”59 59’30”
Lab #2: Interior Angle MeasurementNote PageName:Crew:Date:Weather:Equipment:Notes:Sketch:
Lab #2: Interior Angle MeasurementData PageSTA @DirectReverseSighting To:Sighting To:MeanInterior AngleSTA @DirectReverseSighting To:Sighting To:MeanInterior AngleSTA @DirectReverseSighting To:Sighting To:MeanInterior AngleSTA @DirectReverseSighting To:Sighting To:MeanInterior AngleStationABCSUMMisclosure Measured Correction AdjustedCorrection
CBASunSunSunFeb 1Feb 2-17 16’ 42.6”-16 59’ 40.5”176 37’ 53.3”176 35’ 48.8”0 16’ 13.9”0 16’ 13.8”Theodolite @ ASighting ToTelescopeTimeReadingPoint BDirect----------------------0 00’ 00”SunDirect1:46:10 PM204 00’ 40”SunDirect1:46:56 PM204 10’ 54”SunReversed1:49:05 PM25 40’ 24”SunReversed1:49:52 PM25 50’ 42”Point B (same as above)Reversed----------------------180 00’ 41”Wolfpack input file:Lab Manual Example39 58 23.9 105 11 44.9176 37 53.3 176 35 48.8-17 16 42.6 -16 59 40.5 0 16 13.85 170001 13 46 10 0 0 0 204 00 402 13 46 56 0 0 0 204 10 543 13 49 05 180 0 41 25 40 244 13 49 52 180 0 41 25 50 42File TitleObserver’s latitude and longitudeGHA at 0 and 24 HoursDeclination at 0 and 24 Hours, Semi-DiameterTime correction (7 hrs for MST and 6 for MDT)First reading ( #, Time, BS Angle, Horiz. Angle)Second readingThird readingFourth reading
Output data:---------------------------------------Lab Manual ExampleObserver's Astronomic Position:Latitude 39 58'23.9"Longitude 105 11'44.9"Semi-diamter at 0h UT : 0 16'13.8" sighting trailing edge.StopWatch Start Time, UTC: 7:00:00.0DUT correction: 0.0secGHA of Sun at 0h UT : 176 37'53.30"GHA of Sun at 24h UT : 176 35'48.80"Declination of Sun at 0h UT : -17 16'42.60"Declination of Sun at 24h UT : -16 59'40.50"Pointing Time Hor. Angle DeclinationLHAAzimuth to StarAz of ------------------1 20:46:10.0 204 00'40" -17 01'59.09" 22 56'50.7"205 15'30"0 56'15"2 20:46:56.0 204 10'54" -17 01'58.54" 23 08'20.6"205 27'19"0 57'51"3 20:49:05.0 205 39'43" -17 01'57.01" 23 40'35.4"206 00'22"0 02'07"4 20:49:52.0 205 50'01" -17 01'56.45" 23 52'20.3"206 12'22"0 --------------------Average Astronomic Azimuth of Line 0 30'00.4"Deviation in the mean 937.1"- Sun shots corrected for leading/trailing edges.Some notes about using Wolfpack software to complete solar calculations: The file must have a title. If it does not, the input will be misread and results willbe incorrect.For every entry involving an angle, input data in DMS (degree, minute, second)format. Ex: 180 23’ 45” would be entered 180 23 45. The only formattingrequired is a space between each value.In the third line of input data, be sure to include a “1” at the very end of the line.This tells the program to make a semi-diameter correction for trailing edgeobservations.For the time correction, be sure to note whether MST or MDT should be used.Also, the three place holders in this line after the “7” are for minutes, seconds andfinally a correction in seconds. For example: a reading taken during MDT on awatch that was known to be 45 seconds slow would be entered: 6 0 0 45. Becausethe watch was slow, a ( ) 45 seconds is included, if the watch is fast, make thisvalue negative.The last four lines are each specific to your observations; the first number is thenumber of the observation. This is followed by the time of that observation (in 24hour format) entered with the same formatting as an angle. Ex: 1:33:43 PM wouldbe entered as: 13 33 43. Following this value, enter the measured backsight value(probably either 0 0 0 or 180 0 0) and then the measured horizontal angle.In the output file, a deviation in the mean below 180” is acceptable.
Name:Crew:Date:Weather:Equipment:Notes:Sketch:
Data PageTheodolite @ This observation is for (name of group member):Sighting ----SunDirectSunDirectSunReversedSunReversedPoint (same as above)Reversed---------------------Theodolite @ This observation is for (name of group member):Sighting ----SunDirectSunDirectSunReversedSunReversedPoint (same as above)Reversed---------------------Theodolite @ This observation is for (name of group member):Sighting ----SunDirectSunDirectSunReversedSunReversedPoint (same as above)Reversed---------------------Theodolite @ This observation is for (name of group member):Sighting ----SunDirectSunDirectSunReversedSunReversedPoint (same as above)Reversed----------------------
Lab #3: DistancesObjectives:1. Find distance of your four property lines2. Familiarize yourself with the functions of total station3. Practice manual distance measurement using measuring tapeEquipment:Total Station, Tripod, Pin, Plumb bob, reflection rod, and Field BookLab ProcedureA: EDMMeasuring the distance from A to B using Total Station1.Setup total station at a point on traverse (Center and level), and hold reflection rodat another point (not the diagonal point).2.Point telescope at the reflection mirror and press distance button.3.Record distance (in feet) and zenith angle (Z). Be sure the telescope is still pointedto the middle of the reflection mirror, and press the distance button again to get asecond reading. Record the second reading.4.Move reflection rod to the other available point, and repeat the measurements.5.Move your station to the point diagonally across from where your station iscurrently set up, and take measurements to the same two points to get the lengths ofthe other two lines in your traverse.B: TapeMeasuring the distance from A to B using Tape1. Hold one end of tape at one point, and extend it out to another.2. Note that we are measuring horizontal distance not slop distance (tape should beleveled)3. Read the tape and record.4. Repeat the process one more time on the same line for accuracy.5. Measure the other 3 lines in your traverse.6. If your tape is not long enough, setup a temporary point and use a pin to mark thepoint.7. Always measure from higher elevation to lower elevation.
Lab #3: DistancesNote PageName:Crew:Date:Weather:Equipment:Notes:Sketch:
Lab #3: DistancesData PageA: EDMTotal Station at PointDist.1Dist.2MeanDistance to Point///Distance to Point///Total Station at PointDist.1Dist.2MeanDistance to Point///Distance to Point///Total Station at PointDist.1Dist.2MeanDistance to Point///Distance to Point///D2MeanB: Tape ( Minimum one distance 2x )D1Point to PointPoint to PointPoint to PointPoint to Point
Lab #4Traverse & AreaObjectives: Use your solar data to find the azimuth of a line in your traverse Use your interior angles, distance data, and the azimuth of a line to do traverse computations onyour plot of land and find the X and Y coordinates of all your points. Make an AutoCAD drawing of your plot of land using your calculation. Discussion (1/2 – 1 page): A brief statement of the objective and methodology for your traverselayout should be given here. Address how the latitude and longitude values were determined andhow the correct time was chosen. This section should also be used to state any assumptions madeor comments about your calculations, including any corrections applied and the eliminations oferroneous field data and results. Finally, you should discuss the agreement of all manual andcomputer calculations. Wolfpack solar calculations: Compute the azimuth of your line using Wolfpack. Submit the inputdata and the corresponding output. A Wolfpack solar example is in the section with the solar lab.Note: Each person must use their own set of solar data. Hand Traverse Computations: Submit all of your traverse computations. Spreadsheets areacceptable, but you must show all of the formulas that you used (CTRL - makes all the formulasappear in Excel). The traverse computation sheet is helpful with this, but it does not facilitateshowing all of the necessary computations. Wolfpack Traverse Computations: Use Wolfpack to do your traverse calculations. Submit theinput data and the corresponding output. The data must agree with your hand calculations. An example is on the next page.11 x 17 AutoCAD drawing of the traverse in scale. (Note: 11x17 must be folded properly).Submittal Instructions:Solar Calculations: Find the approximate latitude and longitude of your traverse. Use Google Earth for this,which can be downloaded for free from http://earth.google.com. As of this writing, GoogleEarth can be found in the Bechtel Lab as well. Look up the ephemeris data for the date that you took your solar data. Ephemeris tables canbe found here: http://www.cadastral.com Calculate and print the azimuth using Wolfpack (see example at the end of this section). Besure to account for the Semi-diameter of the sun.
Lab #4Traverse & AreaTraverse Calculations: Using the azimuth of the line that you found or was given, the distance of all of the lines, andthe interior angles, sketch your traverse with the correct direction and shape. Use this for acheck later on to be sure everything makes sense. Use the traverse computation sheet to adjust your measurements and get the coordinates ofeach point on your traverse as well as the adjusted length and bearing of each line.Calculations must be shown, the traverse computation sheet is simply a way to summarizeyour calculations when you are done with them. You must also show your calculations forthe area using either the Double Area or D.M.D method.AutoCAD Drawing: Note: You have the option of doing this drawing either by hand or by AutoCAD. Handdrawings are expected to be done using standard drafting methods and will be subject to thesame standards as computer generated drawings. Your drawing must have a border and title block. The title block should include your name,crew number, date, course title, course number, your lab time, drawing title, and the scale. Show the actual traverse, including individually labeled traverse points, length of eachtraverse line, and the bearing of each line with the direction of the typing in agreement withthe orientation of the li ne (a label for a line at N 45 E should be oriented at an angle of 45 degrees from true northread from left to right) Once you’ve drawn the traverse lines go to your layout and set your scale to an engineeringscale (1” 10’ 1” 20’ etc). Do NOT use the default font. Create a text style so that the textin your drawing prints out at either 1/8” or 1/16”, and use City Blueprint as your font. Thedefault font in AutoCAD is unreadable, and points will be taken off for the overall quality andreadability of your presentation if you do not change the font. Show the interior angles of your traverse to the nearest second. Show the north arrow, and the correct, labeled declination for the date specified in your titleblock. Here is an example of what the north arrow and declination should look like:Using Wolfpack to complete Traverse calculations:
Lab #4Traverse & AreaThere are several different methods by which traverse calculations can be completed usingWolfpack. For purposes of this project, calculating the traverse by azimuths will be the chosen method.Example input file:Traverse4100.34 0 0 0200.54 90 0 0100.34 180 0 0200.34 270 0 010000.00 5000.00Title of input fileNumber of sides of propertyLength of first side and AzimuthLength of second side and AzimuthLength of third side and AzimuthLength of fourth side and AzimuthCoordinates of point of beginningNotes about using Wolfpack to complete traverse calculations: Just like the solar calculations, the traverse input file must have a title. When running the file in Wolfpack, be sure to choose “Polygon Traverse with Azimuths”from the options list. For the last line (coordinates of beginning) you may choose any value that you like. Besure to include at least two decimal places after the value because this is how Wolfpackknows which decimal place to round to. There are several other ways to complete these calculations using Wolfpack, if you sodesire the help menu of the program is a good resource for information about thesemethods.
Name:Lab: Party:Traverse Computation os(α)Departure L*sin(α)CorrectionAdjusted(Compass djustedBearingLab #4StaXTraverse & Area Linear Misclosure:Precision:Area (ft2,acres,m2, and hectares):
Lab #5 DDL (Direct Differential Leveling)Objectives:1.Learn and practice rod reading, instrument leveling.2.Understand Direct Differential Leveling method.3.Use DDL technique to find unknown elevation of various locations.Equipment:1.Leveling Instrument (Telescope)2.Tripod3.Rod4.Field BookTheory & Method:Reading the RodRod reading is similar to reading a ruler, the big difference being that the rods for this class are markedin feet, tenths of a foot, and hundredths of a foot. First, check that the rod is right side up, and that thenumbers are counting upwards from the ground. One side of the rod counts upward from the top of therod. This is used for construction surveying and is not needed for this class, so be sure not toaccidentally site to the wrong side of the rod. The smaller black numbers are tenths of a foot. Eachwhite block and each black block counts as 0.01’. In other words, if you count a white space, a blackline, another white space and another black line, you’ve counted 0.04’, and NOT 0.02’.Direct Differential LevelingDDL is the most fundamental method among various leveling techniques. It directly measures theheight difference between two points. If the elevation of one point is known, the elevation of the otherpoint can be easily calculated. First, setup the leveling equipment somewhere between two points. Inorder to minimize error due to curvature and refraction, the distance to two points from the leveling
Lab #5 DDL (Direct Differential Leveling)equipment should be approximately same. Place the rod at the point with known elevation and take areading. We call this the backside (B.S.). Move the rod to the next point and take another reading.This is the foreside. Let’s do a sample problem which is shown in the picture above:Elevation of BM Rock 820.00B.S. 8.42 ftF.S. 1.20 ftElevation Difference B.S. – F.S. 8.42 – 1.20 7.22 ftElevation of Point X Elevation of BM Rock Elevation Difference 820 7.22 827.22 ftLab Procedure:The goal of this lab is to find the elevation of the four points which are assigned to each group.Starting from the closest NGS (National Geodetic Survey) benchmark that will be shown to you in lab,follow the DDL procedure to find the elevation of your four points.After all four points are found, measure back to your benchmark to check your numbers and calculateyour misclosure. Do not make multiple F.S. measurements from one B.S., otherwise you will run intotrouble calculating your misclosure. If you can not get a reading from one point to the next pointeither because it is too far or the slope difference is too big, setup one or several temporary points.
Lab #5 DDL (Direct Differential Leveling)Text page 108This table is a sample page of field book recording of DDL lab. After this lab you should be able toconstruct a table similar to this. You do not need to complete the whole chart during the lab. During thelab, you only need to record B.S., F.S., and B.M. elevation. The rest can be calculated afterward.
Lab #5 DDL (Direct Differential Leveling)Note PageName:Crew:Date:Weather:Equipment:Notes:Sketch:
Lab #5 DDL (Direct Differential Leveling)Data PageSTAPage Check:Adjustment:B.S.H.I.F.S.Elev.Adj. Elev.
Lab #6 Trigonometric LevelingObjectives:1.Practice utilization of a theodolite2.Understand trigonometric leveling method3.Use trigonometric leveling technique to find a relative elevation of a buildingEquipment:Theodolite, Tripod, Rod, Tape, and Field BookTheory & Method:TVZADRCalculate the height of a buildingUnknown V,A Measured R,D,Z1.V R T R D * tan A2.A 90 – ZLab Procedure:1.Pick a building that you would like to measure the height of2. Setup the theodolite to where you can see the top of the building. Try to avoid a place right belowthe point you would like to site to.3. Sight to the point on the building that you would like to know the height of. Measure R, D, and Z(or A). When measuring distance D, note that you must measure to a point directly below whereyou are sighting to. This means that you need to site to a point on the outside wall of the building,otherwise you won’t know where exactly to measure to.4. Calculate V
Lab #6 Trigonometric LevelingNote PageName:Crew:Date:Weather:Equipment:Notes:Sketch:
Lab #6 Trigonometric LevelingData PageR D Z A V
Lab #7: StadiaObjectives:1.Collect data for approximately 60 to 90 points around your triangular property using total station.2.Calculate necessary information on your points.3.Prepare data for use in final project where you will be creating a topographical map withAutoDesk Land Desktop.Equipment:Total Station, tripod, Plumb Bob, Pin, ReflectorLab ProcedureThe Goal is to collect data points so as to construct topographic map around your property lines:(A) Planimetry PointsBXXNXXXXXXXXXChXαX1.XADPlanimetry Points are the data points which show locations (Direction, Distance) of variousobjects and key landscapes.2.Location and the number of points is decided based on necessity, where the landscapechanges shape, slope, direction, etc.3.From a station and backside line, in order to identify a point, two key data is requiredDirection (α) and Distance (h).(B) Ground Points (G.P)1.Ground Points are the ground data points which are collected mainly for the purpose ofcontour line construction.2.Set up a data point where the slope changes. For steeper slope use shorter interval.
Lab #7: StadiaStadia Computation Sheet (for total station)Total Station @ B.S. @: Station Elevation: HI: HR:Pt. 252627282930B.S.Horizontal AngleZenith levationPoint Description
Objectives: Continue your project with your stadia points and create a topographical map using AutoDeskCivil 3D .Project Submittals: Title page and Table of Contents Discussion: Discuss briefly any aspects of your data collection that deviated from standardprocedures. Discuss the procedures used in your leveling (loops, error correction) and how theymight affect your topographical results. Identify the objectives of the stadia portion and commenton your point selection in the field (were the points properly distributed, did you have enough?).Identify any bad field points that were omitted from the contour generation. Conclude by brieflycommenting on your overall results and what this course has taught you. DDL Computations: Show BS, FS, HI, elevations, corrected elevations, page check, andmisclosure. Express your data to the nearest hundredth of a foot Stadia Computations: Include your stadia computation sheets that should have your horizontalangle, horizontal distance, vertical distance, and elevation filled out. Transform this data intoX,Y,Z coordinates using an Excel spreadsheet. To show your calculations print out your Excelspreadsheet with the numbers and another with the formulas that you used (CTRL - ). Your datashould be in the nearest 10th of a foot. Look over the data before importing it into Civil 3D to besure that all of the numbers make sense. ( A template spreadsheet can be found on the coursewebsite). Working Map: The working map is essentially a tool with which you can verify and process yourfield data. This map will present ALL the data collected in the field. This initial contourgeneration will be modified by manual manipulation of contours and deletion of bad data points.Information should be legible, although it is expected to be somewhat cluttered. Include thefollowing on the map: Traverse stations marked by number and elevation. You can use the existing 11x17 traverse map and add adjusted DDL elevations to stations. All stadia points marked by number and elevation Show all planimetry (trees, paths, ponds, boulders, lights, buildings, etc.) with anaccompanying legend. Contour Lines generated with Civil 3D Name Crew number, section number and title.
Use 11 x 17 of larger.Final Map: The final map is the culmination of all the data you’ve worked to collect. Themajority of the grade will focus on presentation, professionalism, and accuracy. Spend timemaking sure things are not cluttered together and all data is clearly legible (no lines throughnumbers, etc.). Include the following: Border and title block, including: name, crew number, date, course number, course title,section number, scale, project title, and location of traverse (“Part of SW ¼, Sec. 32, T1N,R70W, 6th P.M.”) Your traverse lines Smooth contours (Choose a contour interval that is appropriate for your property). Each fifthcontour should be bold and labeled (0’s and 5’s). Also label any contours that are notexplicitly clear. Traverse stations marked by number, coordinates, and elevation. Elevations should fallbetween correct contours. A separate table in the corner with this data often is the mostreadable. Use 11 x 17 paper . True north with declination The final map should be the same as your working map, but it should not show any of theStadia points. Use layers in Civil 3D and set up two layouts – one for your working map andone for your final map. Freeze the points layer in the final map. Additional requirements are listed in the Civil 3D instructions below.Original Field Book that is properly marked with name, section number and crew number. Thefront page should be filled out, as well as the appropriate notes for each lab. Neatness andprofessionalism will be checked (organized, clear, no erasing).
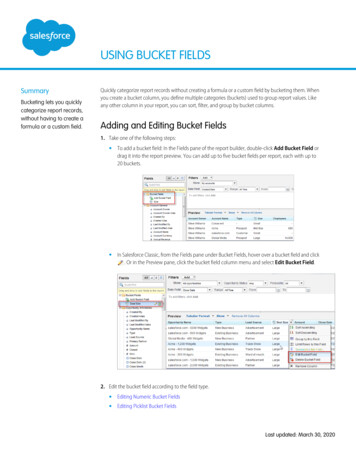
Using Autodesk AutoCAD Civil 3D to complete the ProjectIt is recommended that each group follow these instructions exactly. Civil 3D is acomplicated program, and even doing some of these steps out of order can causeproblems. Read through these directions completely first.- Open Civil 3D- Be sure that the Toolspace is shown on the left of the screen. From the Home tab,select the Toolspace button if it is missing. The Prospector tab within Toolspace willbe used primarily. (The command “showTS” will bring Toolspace back if itaccidentally closed.)- Type in “units” in the command line.- Change the Length Type to Decimal and change the Angle Type to Deg/Min/Sec.Choose the appropriate precision for each. Check the “Clockwise” box beneath theAngle units to set the default angle measurement to clockwise.- Ensure that the Insertion Scale is in “Feet.” Click “OK.”Inserting your points:- You will need to create a text file (.txt) that contains all of your points, with at least X,Y, and Z coordinates of all of your points.- Begin with creating an Excel spreadsheet with separate columns for Point #, X, Y, andZ, entering coordinates in feet.- Copy the point information from the Excel file into a text (.txt) file (the Notepadprogram in Windows works well for this.) Save your text file so that you can upload itin the coming steps.- The file should look something like this, with a single space separating each set ofnumbers along a 0.0765351.1195350.5415350.702- For this text file, your traverse points should be assigned a number as well, otherwisethe text file will not import into Civil 3D. (101, 102 and 103 work well here).- Civil 3D allows you to import point files that are formatted in several different ways.The example shown above would be called “PENZ space delimited.”
P Point NumberE Easting (X Coordinate)N Northing (Y Coordinate)D Optional Point DescriptionZ Elevation- To Import Point File into Civil 3D, from the Insert tab, select Points from File.- Ensure that the Format corresponds to the format your text file is set up using. Theexample text file above would require “PENZ (space delimited)” to be chosen here.- Click the “ ” button on the right and browse for and select your text file.- Click “Add Points to Point Group” and assign a name for your points group (“FinalProject” for example).- Uncheck “Do Elevation Adjustment if Possible.”- Click “OK” to import points.- You should now have a group of points on your screen that are labeled with some smalltext.- If you cannot see the points, type the letter “z” (for zoom), press “Enter,” then type theletters “ex” (for extents) and press “Enter” again. This will zoom in so that the pointsfill the screen.- It is suggested that you change your traverse points to a separate layer than your stadiapoints. The stadia points layer can then be turned “off” when plotting your Final Maplater on. To do this, under the Home tab, in the top left of the Layers section, click theLayer Properties button and dock the Layer Properties Manager to the right of thescreen. Click the New Layer button within the Layer Properties Manager and name thenew layer whatever you choose.- Select your three traverse points (you likely have assigned a number to these in the textfile) and right click and choose Properties. Under the Layer option, assign these pointsto the new layer you have just created.- To turn a layer on or off, in the Layer Properties Manager, click the Lightbulb icon off.If the layer is still displayed, you may also need to turn off the “Freeze” button for thelayer.Select your plotting scale:- Click on the “Layout 1” button in the bottom right of the screen:- Click the File button, then under Print, Select Page Setup“File” button
- Click the Modify button while Layo
Also, the three place holders in this line after the “7” are for minutes, seconds and finally a correction in seconds. For example: a reading taken during MDT on a watch that was known to be 45 seconds slow would be entered: 6 0 0 45. Because the watch was slow, a ( ) 45 seconds is