Transcription
PROCESS CAPABILITYMuhammad Asif1
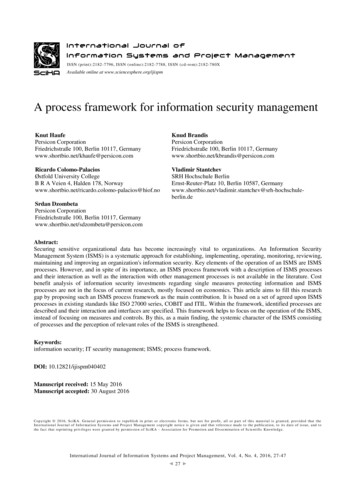
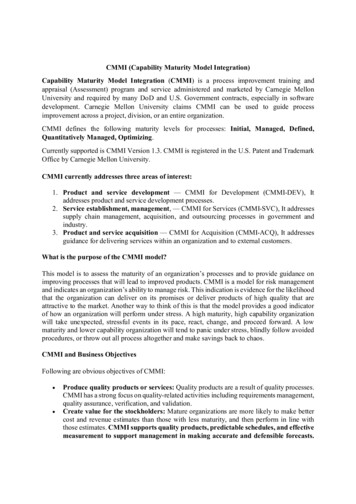
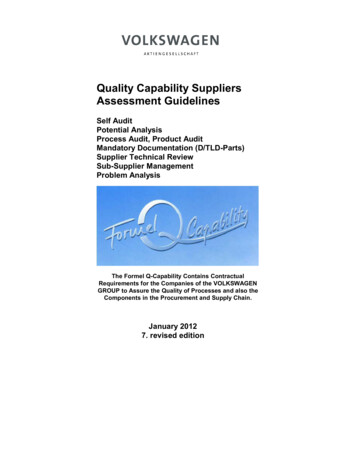
The Normal Distribution 1 S.D, 68% of population 2 S.D, 95% of population 3S.D, 99.7% of population95.46 %99.73 %µ-3σ µ-2σ µ-1σ µ µ 1σ µ 2σ µ 3σXAt 3-sigma away from process mean expect 99.73% ofobservations fall within these limits. At 2σ expect 95.46%2
3Z- DISTRIBUTION TABLE
Process CapabilityThe ability of a process to meet productdesign/technical specificationsConducted only when the process is normallydistributed4
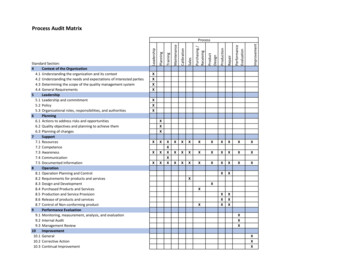
HOW TO MEASURE CpLTL(UTL LTL)Cp 6σUTL3σ3σ6σCp 16σ-4X
Process Capability Index:Cp -- Measure of Potential Capabilityallowable process variation USL LSLCp actual process variation6σLSLUSLCp 1Cp 1Cp 16
12σCp 26σUTLLTL6σ-46σXSIX SIGMAPROCESS
What value of cp is acceptable Cp 1.0Cp 1.0Cp1.3 - 1.5Cp 2poor processso okgoodExcellent, that is6 sigma8
Process Capability IndexExampleA manufacturing process produces a certain part with amean diameter of 2 inches and a standard deviation of0.03 inches. The lower and upper engineeringspecification limits are 1.90 inches and 2.05 inches.USL LSL 2.05 1.90 0.83Cp 6σ6(0.03)Process is not a capable process since Cp 1.09
Process Capability Index:Cpk -- Measure of Actual CapabilityC pkσ X LSL USL X , min 3σ 3σis the standard deviation of the process10
WHY Cpk IS NEEDED? IS Cp NOT ENOUGH?11
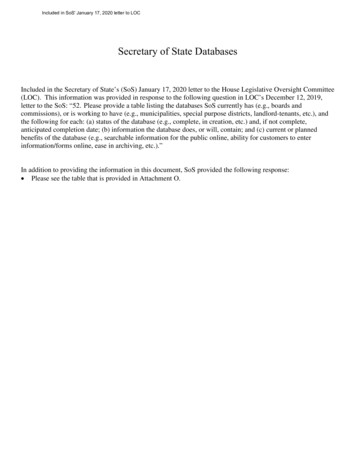
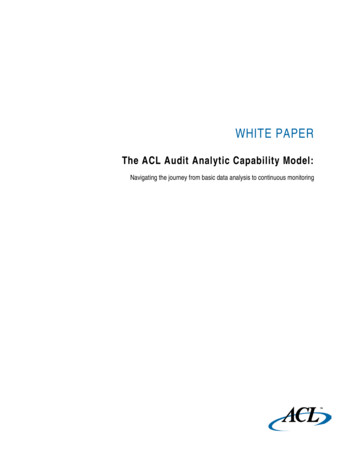
Impact of Process Location onProcess CapabilityLSLUSLσ 238445056Cp 2.0Cpk 2.062Cp 2.0Cpk 1.5384450535662Cp 2.0Cpk 1.03844505662Cp 2.0Cpk 0384450566212
WHY Cpk IS NEEDED?IS Cp NOT ENOUGH?Cp TELLS U ONLY ABOUT THE SMARTNESS OFCURVECpk TELLS U ABOUT THE POSITIONING / LOCATIONOF THE CURVE13
Process Capability IndexExampleA manufacturing process produces a certain part with amean diameter of 2 inches and a standard deviation of0.03 inches. The lower and upper engineeringspecification limits are 1.90 inches and 2.05 inches. 2 1.90 2.05 2 X LSL USL X ,min,C pk min 3σ 3σ 3(0.03) 3(0.03) min[1.11,0.56] 0.56Therefore, the process is not capable (the variation istoo large and the process mean is not on target)14
Process CapabilityNominal valueSix sigmaFour sigmaTwo sigmaLowerspecificationUpperspecificationMean15
Six Sigma Is the relentless and rigorous pursuit of the reductionof variation in all critical processes to achievecontinuous and breakthrough improvements thatimpact the bottom line of the organization andincrease customer satisfaction.It is an organizational initiative designed to createmanufacturing, service and administrative processesthat produce approximately 3.4 defects per million.Opportunities (DPMO).16
WITH OUT ANY DEVIATION76543210-1-2-3-4-5-6-7σbetween / - 1σ68.27 %between / - 2σ95.45 %45500 ppmbetween / - 3σ99.73 %2700 ppmbetween / - 4σ99.9937 %63 ppmbetween / - 5σ99.999943 %0.57 ppmbetween / - 6σ99.9999998 %0.002 ppmresult: 317300 ppm outside(deviation)17
Distribution shifted 1.518
DMAIC Model The model that is used to improve a processin Six Sigma management is called theDMAIC model. This stands for: DefineMeasureAnalyzeImproveControl19
LEADERSHIP Six Sigma must be implementedfrom the top-down.20
Green Belt. Green Belts are project leaders who receive two weeksof training on the Six Sigma roadmap and essentialelements of Statistical methodologies supporting SixSigma projects. Successful Green Belts are able to allocate 50% of theirtime to their four to six month Six Sigma Project.21
CHAMPIONSAn executive level business leader whofacilitates the leadership, implementation, anddeployment of Six Sigma philosophies.22
Black Belt. Black Belts are project leaders who receive four weeks oftraining focusing on the Six Sigma Road map andextensive statistical methodologies Successful Black Belts normally dedicate at least 75% oftheir time to 4 -6 month Six Sigma Project.23
MasterBlack Belt. Master Black Belt provides technical leadershipto Six Sigma program. The mentor and teacher of the of Six SigmaBlack Belt and Six Sigma Green Belt.24
6 Sigma Support Personnel25
Process capability calculationusing MinitabPlease refer to the examples discussed in class26
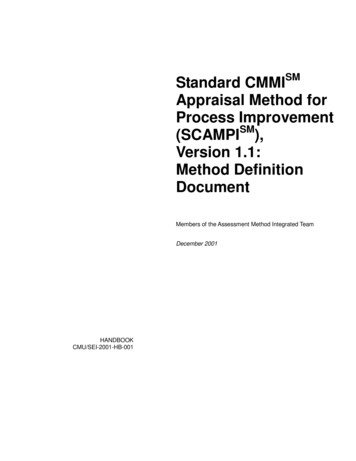
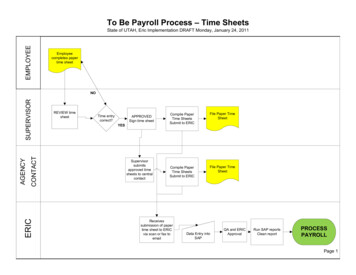
Process Capability of Supp1LSLTargetUSLWithinOverallProcess DataLSL598Target600USL602Sample Mean599.548Sample N100StDev(Within) 0.576429StDev(Overall) 0.620865Potential (Within) CapabilityCp1.16CPL 0.90CPU 1.42Cpk 0.90Overall CapabilityPpPPLPPUPpkCpm1.070.831.320.830.87597.75 598.50 599.25 600.00 600.75 601.50Observed PerformancePPM LSL 10000.00PPM USL0.00PPM Total10000.00Exp. Within PerformancePPM LSL 3621.06PPM USL10.51PPM Total3631.57Exp. Overall PerformancePPM LSL 6328.16PPM USL39.19PPM Total6367.3527
Process Capability of Supp2LSLTargetUSLWithinOverallProcess DataLSL598Target600USL602Sample Mean 600.23Sample N100StDev(Within) 1.67231StDev(Overall) 1.87861Potential (Within) CapabilityCp0.40CPL 0.44CPU 0.35Cpk 0.35Overall CapabilityPpPPLPPUPpkCpm0.350.400.310.310.35597.0 598.5 600.0 601.5 603.0 604.5Observed PerformancePPM LSL 110000.00PPM USL 180000.00PPM Total290000.00Exp. Within PerformancePPM LSL91186.50PPM USL 144933.01PPM Total236119.51Exp. Overall PerformancePPM LSL 117604.95PPM USL 173049.32PPM Total290654.2728
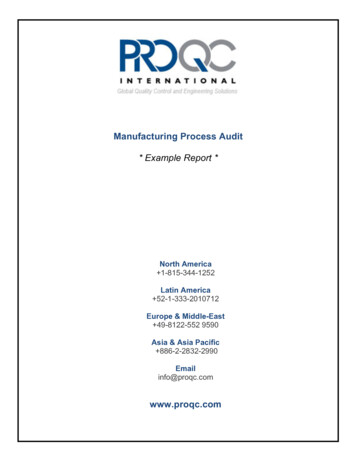
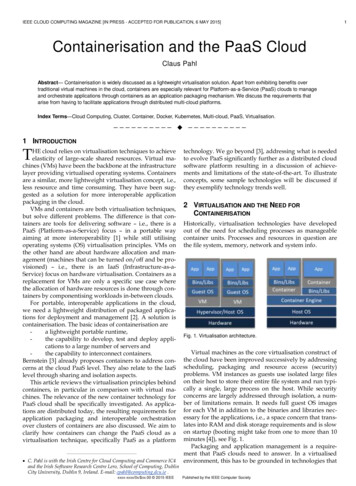
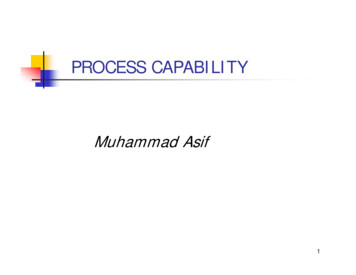
Process Capability Sixpack of Supplier 2Xbar ChartSample Mean1Capability Histogram1UCL 602.474602600X 600.23598LCL 597.986135791113151719LSLSpecificationsLSL 598USL 602597.0 598.5 600.0 601.5 603.0 604.5Sample RangeR Chart8UCL 8.2254R 3.8900LCL 01357911131517USL19Normal Prob PlotAD: 0.287, P: 0.615595Values604WithinStDev 1.67231Cp0.4Cpk0.3560059610Sample605Capability PlotLast 20 Subgroups56001520WithinOverallOverallStDev 1.87861Pp0.35Ppk0.31Cpm *Specs29
their time to 4 -6 month Six Sigma Project. 24 Master Black Belt. Master Black Belt provides technical leadership to Six Sigma program. The mentor and teacher of the of Six Sigma Black Belt and Six Sigma Green Belt. 25 6 Sigma