Transcription
Quantitative Techniques for ManagementMBA First YearPaper No. 6School of Distance EducationBharathiar University, Coimbatore - 641 046
Author: P N Mishra & S JaisankarCopyright 2007, Bharathiar UniversityAll Rights ReservedEdited by: Dr. Subodh KesharwaniProduced and PrintedbyEXCEL BOOKS PRIVATE LIMITEDA-45, Naraina, Phase-I,New Delhi-110028forSCHOOL OF DISTANCE EDUCATIONBharathiar UniversityCoimbatore-641046
CONTENTSPage No.Unit -ILesson 1Lesson 2Lesson 3Lesson 4Lesson 5Quantitative Techniques – IntroductionMeasures of Central TendencyMathematical ModelLinear Programming: Graphical MethodLinear Programming: Simplex Method724110119143Unit -IILesson 6Lesson 7Transportation ModelAssignment Model167209Unit -IIILesson 8Lesson 9Network ModelWaiting Model (Queuing Theory)241272Unit -IVLesson 10Lesson 11Lesson 12ProbabilityTheoretical Probability DistributionsProbability Distribution of a Random Variable299359409Unit-VLesson 13Lesson 14Lesson 15Inventory ModelGame TheorySimulation449472495
QUANTITATIVE TECHNIQUES FOR MANAGEMENTNumber of Credit Hours : 3 (Three)Subject Description: This course presents the various mathematical models, networking, probability,inventory models and simulations for managerial decisions.Goals: To enable the students to learn techniques of operations research and resources managementand their application in decision making in the management.Objectives: On successful completion of the course the students should have:1.Understood the basic of the quantitative techniques.2.Learnt the feasible solution and optimum solution for the resource management.3.Learnt the time estimation and critical path for project.4.Learnt about the application of probability techniques in the decision making.5.Learnt the various inventory models and simulations in the resource planning and management.UNIT IQT – Introduction – Measures of Central Tendency – Mean, Median, Mode.Mathematical Models – deterministic and probabilistic – simple business examples – OR andoptimization models – Linear Programming – formulation – graphical solution –simplex – solution.UNIT IITransportation model – Initial Basic Feasible solutions – optimum solution for non – degeneracy anddegeneracy model – Trans-shipment Model – Assignment Model – Travelling Salesmen problem.UNIT IIINetwork Model – networking – CPM – critical path – Time estimates – critical path – crashing,Resource levelling, Resources planning. Waiting Line Model – Structure of model – M/M/1 forinfinite population.UNIT IVProbability – definitions – addition and multiplication Rules (only statements) – simple businessapplication problems – probability distribution – expected value concept – theoretical probabilitydistributions – Binomial, Poison and Normal – Simple problems applied to business.UNIT VInventory Models – Deterministic – EOQ – EOQ with Price Breaks – Probabilistic Inventory Models- Probabilistic EOQ model – Game theory-zero sum games: Arithmetic and Graphical Method.Simulation – types of simulation – Monte Carlo simulation – simulation problems.Decision Theory – Pay off tables – decision criteria – decision trees.
Quantitative Techniques –IntroductionUnit-I5
LESSON1QUANTITATIVE TECHNIQUES – INTRODUCTIONCONTENTS1.0 Aims and Objectives1.1 Introduction1.2 Historical Development1.3 About Quantitative Technique1.4 Methodology of Quantitative Techniques1.4.1 Formulating the Problem1.4.2 Defining the Decision Variables and Constraints1.4.3 Developing a Suitable Model1.4.4 Acquiring the Input Data1.4.5 Solving the Model1.4.6 Validating the Model1.4.7 Implementing the Results1.5 Advantages of Mathematical Modelling1.6 Scope of Quantitative Technique1.7 Statistics : An Introduction1.7.1 Origin and Growth of Statistics1.7.2 Meaning and Definition of Statistics1.7.3 Statistics as Data1.7.4 Statistics as a Science1.7.5 Statistics as a Science different from Natural Sciences1.7.6 Statistics as a Scientific Method1.7.7 Statistics as a Science or an Art1.8 Let us Sum Up1.9 Lesson-end Activities1.10 Keywords1.11 Questions for Discussion1.12 Terminal Questions1.13 Model Answers to Questions for Discussion1.14 Suggested Readings
Quantitative Techniquesfor Management1.0 AIMS AND OBJECTIVESIn this first lesson we discuss the distinguished approaches to quantitative techniquesand its various applications in management, statistical analysis and other industries. Herewe will discuss the approaches of quantitative techniques.1.1 INTRODUCTIONScientific methods have been man’s outstanding asset to pursue an ample number ofactivities. It is analysed that whenever some national crisis, emerges due to the impactof political, social, economic or cultural factors the talents from all walks of life amalgamatetogether to overcome the situation and rectify the problem. In this chapter we will seehow the quantitative techniques had facilitated the organization in solving complexproblems on time with greater accuracy. The historical development will facilitate inmanagerial decision-making & resource allocation, The methodology helps us in studyingthe scientific methods with respect to phenomenon connected with human behaviourlike formulating the problem, defining decision variable and constraints, developing asuitable model, acquiring the input data, solving the model, validating the model,implementing the results. The major advantage of mathematical model is that its facilitatesin taking decision faster and more accurately.Managerial activities have become complex and it is necessary to make right decisionsto avoid heavy losses. Whether it is a manufacturing unit, or a service organization, theresources have to be utilized to its maximum in an efficient manner. The future is cloudedwith uncertainty and fast changing, and decision-making – a crucial activity – cannot bemade on a trial-and-error basis or by using a thumb rule approach. In such situations,there is a greater need for applying scientific methods to decision-making to increase theprobability of coming up with good decisions. Quantitative Technique is a scientific approachto managerial decision-making. The successful use of Quantitative Technique formanagement would help the organization in solving complex problems on time, withgreater accuracy and in the most economical way. Today, several scientific managementtechniques are available to solve managerial problems and use of these techniques helpsmanagers become explicit about their objectives and provides additional information toselect an optimal decision. This study material is presented with variety of these techniqueswith real life problem areas.1.2 HISTORICAL DEVELOPMENTDuring the early nineteen hundreds, Fredrick W. Taylor developed the scientificmanagement principle which was the base towards the study of managerial problems.Later, during World War II, many scientific and quantitative techniques were developedto assist in military operations. As the new developments in these techniques were foundsuccessful, they were later adopted by the industrial sector in managerial decision-makingand resource allocation. The usefulness of the Quantitative Technique was evidencedby a steep growth in the application of scientific management in decision-making invarious fields of engineering and management. At present, in any organization, whethera manufacturing concern or service industry, Quantitative Techniques and analysis areused by managers in making decisions scientifically.Check Your Progress 1.1Explain with the help of example some of the important Quantitative Techniquesused in modern business and in industrial unit.8Contd.
Notes: (a)Quantitative Techniques –IntroductionWrite your answer in the space given below.(b)Please go through the lesson sub-head thoroughly you will get youranswers in it.(c)This Chek Your Progress will help you to understand the lesson better.Try to write answers for them, but do not submit your answers to theuniversity for assessment. These are for your practice only.1.3 ABOUT QUANTITATIVE TECHNIQUEQuantitative Techniques adopt a scientific approach to decision-making. In this approach,past data is used in determining decisions that would prove most valuable in the future.The use of past data in a systematic manner and constructing it into a suitable model forfuture use comprises a major part of scientific management. For example, consider aperson investing in fixed deposit in a bank, or in shares of a company, or mutual funds, orin Life Insurance Corporation. The expected return on investments will vary dependingupon the interest and time period. We can use the scientific management analysis to findout how much the investments made will be worth in the future. There are many scientificmethod software packages that have been developed to determine and analyze theproblems.In case of complete non-availability of past data, quantitative factors are considered indecision-making. In cases where the scope of quantitative data is limited, qualitativefactors play a major role in making decisions. Qualitative factors are important situationslike sudden change in tax-structures, or the introduction of breakthrough technologies.Application of scientific management and Analysis is more appropriate when there isnot much of variation in problems due to external factors, and where input values aresteady. In such cases, a model can be developed to suit the problem which helps us totake decisions faster. In today's complex and competitive global marketplace, use ofQuantitative Techniques with support of qualitative factors is necessary.Quantitative Technique is the scientific way to managerial decision-making, while emotionand guess work are not part of the scientific management approach. This approachstarts with data. Like raw material for a factory, this data is manipulated or processedinto information that is valuable to people making decision. This processing and manipulatingof raw data into meaningful information is the heart of scientific management analysis.Check Your Progress 1.2Do you think the day will come when all decision in a business unit are made withassistance of quantitative techniques? Give reasons for your answer.Notes: (a)(b)Write your answer in the space given below.Please go through the lesson sub-head thoroughly you will get youranswers in it.Contd.9
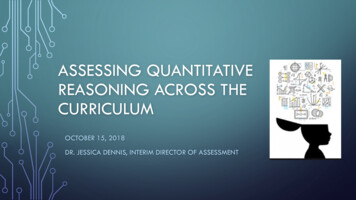
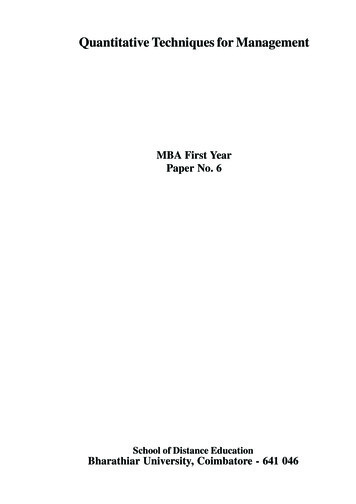
Quantitative Techniquesfor Management(c)This Chek Your Progress will help you to understand the lesson better.Try to write answers for them, but do not submit your answers to theuniversity for assessment. These are for your practice only.1.4 METHODOLOGY OF QUANTITATIVE TECHNIQUESThe methodology adopted in solving problems is as follows:Formulating the problemDefining decision variables andconstraints.Developing a suitable modelAcquiring the Input DataSolving the modelValidating the modelImplementing the resultsFigure 1.11.4.1 Formulating the Problem10As a first step, it is necessary to clearly understand the problem situations. It is importantto know how it is characterized and what is required to be determined. Firstly, the keydecision and the objective of the problem must be identified from the problem. Then, thenumber of decision variables and the relationship between variables must be determined.The measurable guaranties that are represented through these variables are notified.The practical limitations or constraints are also inferred from the problem.
1.4.2 Defining the Decision Variables and ConstraintsQuantitative Techniques –IntroductionIn a given problem situation, defining the key decision variables are important. Identifyingthese variables helps us to develop the model. For example, consider a manufacturerwho is manufacturing three products A, B and C using two machines, I and II. Each unitof product A takes 2 minutes on machine I and 5 minutes on machine II. Product Btakes 1 minute on machine I and 3 minutes on machine II. Similarly, product C takes 4minutes and 6 minutes on machine I and machine II, respectively. The total availabletime on machine I and machine II are 100 hours and 120 hours, respectively. Each unitof A yields a profit of Rs. 3.00, B yields Rs. 4.00 and C yields Rs. 5.00. What should belevel of production of products A, B and C that should be manufactured by the companyso as to maximize the profit?The decision variables, objective and constraints are identified from the problem.The company is manufacturing three products A, B and C. Let A be x1, B be x2 and Cbe x3. x1, x2 and x3 are the three decision variables in the problem. The objective is tomaximize the profits. Therefore, the problem is to maximize the profit, i.e., to know howmany units of x1, x2 and x3 are to be manufactured. There are two machines available,machine I and machine II with total machine hours available as 100 hours and 120 hours.The machine hours are the resource constraints, i.e., the machines cannot be used morethan the given number of hours.To summarize,lKey decisionlDecision variables :x1, x2 and x3lObjective:To maximize profitlConstraint:Machine hours:How many units of x1, x2 and x3 are to be manufactured1.4.3 Developing a Suitable ModelA model is a mathematical representation of a problem situation. The mathematicalmodel is in the form of expressions and equations that replicate the problem. For example,the total profit from a given number of products sold can be determined by subtractingselling price and cost price and multiplying the number of units sold. Assuming sellingprice, sp as Rs. 40 and cost price, cp as Rs. 20, the following mathematical modelexpresses the total profit, tp earned by selling number of unit x.TP (SP – CP) x (40 – 20) xTP 20 xNow, this mathematical model enables us to identify the real situation by understandingthe model. The models can be used to maximize the profits or to minimize the costs. Theapplications of models are wide, such as:lLinear Programming ModellInteger ProgramminglSensitivity AnalysislGoal ProgramminglDynamic ProgramminglNon Linear ProgramminglQueuing TheorylInventory Management Techniques11
Quantitative Techniquesfor ManagementlPERT/CPM (Network Analysis)lDecision TheorylGames TheorylTransportation and Assignment Models.1.4.4 Acquiring the Input DataAccurate data for input values are essential. Even though the model is well constructed,it is important that the input data is correct to get accurate results. Inaccurate data willlead to wrong decisions.1.4.5 Solving the ModelSolving is trying for the best result by manipulating the model to the problem. This is doneby checking every equation and its diverse courses of action. A trial and error methodcan be used to solve the model that enables us to find good solutions to the problem.1.4.6 Validating the ModelA validation is a complete test of the model to confirm that it provides an accuraterepresentation of the real problem. This helps us in determining how good and realisticthe solution is. During the model validation process, inaccuracies can be rectified bytaking corrective actions, until the model is found to be fit.1.4.7 Implementing the ResultsOnce the model is tested and validated, it is ready for implementation. Implementationinvolves translation/application of solution in the company. Close administration andmonitoring is required after the solution is implemented, in order to address any proposedchanges that call for modification, under actual working conditions.1.5 ADVANTAGES OF MATHEMATICAL MODELLINGThe advantages of mathematical modelling are many:(a)Models exactly represent the real problem situations.(b)Models help managers to take decisions faster and more accurately.(c)Models save valuable resources like money and time.(d)Large and complex problems can be solved with ease.(e)Models act as communicators to others by providing information and impact inchanging conditions.Check Your Progress 1.3“Quantitative Technique is a very powerful tools and analytical process that offersthe presentation of an optimum solutions in spite of its limitations”. Discuss.Notes: (a)12Write your answer in the space given below.(b)Please go through the lesson sub-head thoroughly you will get youranswers in it.(c)This Chek Your Progress will help you to understand the lesson better.Try to write answers for them, but do not submit your answers to theuniversity for assessment. These are for your practice only.Contd.
Quantitative Techniques –Introduction1.6 SCOPE OF QUANTITATIVE TECHNIQUEThe scope and areas of application of scientific management are very wide in engineeringand management studies. Today, there are a number at quantitative software packagesavailable to solve the problems using computers. This helps the analysts and researchersto take accurate and timely decisions. This book is brought out with computer basedproblem solving. A few specific areas are mentioned below.lFinance and Accounting: Cash flow analysis, Capital budgeting, Dividend andPortfolio management, Financial planning.lMarketing Management: Selection of product mix, Sales resources allocationand Assignments.lProduction Management: Facilities planning, Manufacturing, Aggregate planning,Inventory control, Quality control, Work scheduling, Job sequencing, Maintenanceand Project planning and scheduling.lPersonnel Management: Manpower planning, Resource allocation, Staffing,Scheduling of training programmes.lGeneral Management: Decision Support System and Management of InformationSystems, MIS, Organizational design and control, Software Process Managementand Knowledge Management.From the various definitions of Quantitative Technique it is clear that scientific managementhen got wide scope. In general, whenever there is any problem simple or complicatedthe scientific management technique can be applied to find the best solutions. In thishead we shall try to find the scope of M.S. by seeing its application in various fields ofeveryday lift this include define operation too.Check Your Progress 1.4Discuss the significance and scope of Quantitative Techniques in modern businessmanagement.Notes: (a)Write your answer in the space given below.(b)Please go through the lesson sub-head thoroughly you will get youranswers in it.(c)This Chek Your Progress will help you to understand the lesson better.Try to write answers for them, but do not submit your answers to theuniversity for assessment. These are for your practice only.13
Quantitative Techniquesfor Management1.7 STATISTICS : AN INTRODUCTION1.7.1 Origin and Growth of StatisticsStatistics, as a subject, has a very long history. The origin of STATISTICS is indicated bythe word itself which seems to have been derived either from the Latin word 'STATUS'or from the Italian word 'STATISTA' or may be from the German word 'STATISTIK.'The meaning of all these words is 'political state'. Every State administration in the pastcollected and analysed data. The data regarding population gave an idea about the possiblemilitary strength and the data regarding material wealth of a country gave an idea aboutthe possible source of finance to the State. Similarly, data were collected for other purposesalso. On examining the historical records of various ancient countries, one might findthat almost all the countries had a system of collection of data. In ancient Egypt, the dataon population and material wealth of the country were collected as early as 3050B.C., for the construction of pyramids. Census was conducted in Jidda in 2030 B.C. andthe population was estimated to be 38,00,000. The first census of Rome was done asearly as 435 B.C. After the 15th century the work of publishing the statistical data wasalso started but the first analysis of data on scientific basis was done by Captain JohnGraunt in the 17th century. His first work on social statistics, ‘Observation on LondonBills of Mortality' was published in 1662. During the same period the gamblers of westerncountries had started using statistics, because they wanted to know the more preciseestimates of odds at the gambling table. This led to the development of the 'Theory ofProbability'.Ancient India also had the tradition of collection of statistical data. In ancient works,such as Manusmriti, Shukraniti, etc., we find evidences of collection of data for thepurpose of running the affairs of the State where population, military force and otherresources have been expressed in the form of figures. The fact and figures of theChandragupta Mauraya's regime are described in 'Kautilya's Arthashastra'. Statisticswere also in use during the Mughal period. The data were collected regarding population,military strength, revenue, land revenue, measurements of land, etc. The system of datacollection was described in Tuzuk - i - Babri and Ain-i-Akabari. During Akbar's period,his revenue minister, Raja Todarmal, made a well organised survey of land for the collectionof land revenue. During the British period too, statistics were used in various areas ofactivities.Although the tradition of collection of data and its use for various purposes is very old,the development of modern statistics as a subject is of recent origin. The development ofthe subject took place mainly after sixteenth century. The notable mathematicians whocontributed to the development of statistics are Galileo, Pascal, De-Mere, Farment andCardeno of the 17th century. Then in later years the subject was developed by AbrahamDe Moivre (1667 - 1754), Marquis De Laplace (1749 - 1827), Karl Friedrich Gauss(1777 - 1855), Adolphe Quetelet (1796 - 1874), Francis Galton (1822 - 1911), etc. KarlPearson (1857 - 1937), who is regarded as the father of modern statistics, was greatlymotivated by the researches of Galton and was the first person to be appointed as GaltonProfessor in the University of London. William S. Gosset (1876 - 1937), a student ofKarl Pearson, propounded a number of statistical formulae under the pen-name of 'Student'.R.A. Fisher is yet another notable contributor to the field of statistics. His book 'StatisticalMethods for Research Workers', published in 1925, marks the beginning of the theory ofmodern statistics.The science of statistics also received contributions from notable economists such asAugustin Cournot (1801 - 1877), Leon Walras (1834 - 1910), Vilfredo Pareto(1848 - 1923), Alfred Marshall (1842 - 1924), Edgeworth, A.L. Bowley, etc. They gavean applied form to the subject.14Among the noteworthy Indian scholars who contributed to statistics are P.C. Mahalnobis,V.K.R.V. Rao, R.C. Desai, P.V. Sukhatme, etc.
Quantitative Techniques –Introduction1.7.2 Meaning and Definition of StatisticsThe meaning of the word 'Statistics' is implied by the pattern of development of thesubject. Since the subject originated with the collection of data and then, in later years,the techniques of analysis and interpretation were developed, the word 'statistics' hasbeen used in both the plural and the singular sense. Statistics, in plural sense, means aset of numerical figures or data. In the singular sense, it represents a method of studyand therefore, refers to statistical principles and methods developed for analysis andinterpretation of data.Statistics has been defined in different ways by different authors. These definitions canbe broadly classified into two categories. In the first category are those definitions whichlay emphasis on statistics as data whereas the definitions in second category emphasisestatistics as a scientific method.1.7.3 Statistics as DataStatistics used in the plural sense implies a set of numerical figures collected with referenceto a certain problem under investigation. It may be noted here that any set of numericalfigures cannot be regarded as statistics. There are certain characteristics which must besatisfied by a given set of numerical figures in order that they may be termed as statistics.Before giving these characteristics it will be advantageous to go through the definitionsof statistics in the plural sense, given by noted scholars.1."Statistics are numerical facts in any department of enquiry placed in relation toeach other.”- A.L. BowleyThe main features of the above definition are :(i)Statistics (or Data) implies numerical facts.(ii)Numerical facts or figures are related to some enquiry or investigation.(iii) Numerical facts should be capable of being arranged in relation to each other.On the basis of the above features we can say that data are those numerical factswhich have been expressed as a set of numerical figures related to each other andto some area of enquiry or research. We may, however, note here that all thecharacteristics of data are not covered by the above definition.2."By statistics we mean quantitative data affected to a marked extent by multiplicityof causes.”- Yule & KendallThis definition covers two aspects, i.e., the data are quantitative and affected by alarge number of causes.3."Statistics are classified facts respecting the conditions of the people in a stateespecially those facts which can be stated in numbers or in tables of numbers or inany other tabular or classified arrangement.”- Webster4."A collection of noteworthy facts concerning state, both historical and descriptive.”- AchenwallDefinitions 3 and 4, given above, are not comprehensive because these confine thescope of statistics only to facts and figures related to the conditions of the people ina state. However, as we know that data are now collected on almost all the aspectsof human and natural activities, it cannot be regarded as a state-craft only.5."Statistics are measurements, enumerations or estimates of natural or socialphenomena, systematically arranged, so as to exhibit their interrelations.”- L.R. ConnorThis definition also covers only some but not all characteristics of data.15
Quantitative Techniquesfor Management6."By statistics we mean aggregate of facts affected to a marked extent by amultiplicity of causes, numerically expressed, enumerated or estimated accordingto a reasonable standard of accuracy, collected in a systematic manner for apredetermined purpose and placed in relation to each other.”- H. SecristThis definition can be taken as a comprehensive definition of statistics since mostof the characteristics of statistics are covered by it.Characteristics of Statistics as DataOn the basis of the above definitions we can now state the following characteristics ofstatistics as data :1.Statistics are numerical facts: In order that any set of facts can be called asstatistics or data, it must be capable of being represented numerically orquantitatively. Ordinarily, the facts can be classified into two categories : (a) Factsthat are measurable and can be represented by numerical measurements.Measurement of heights of students in a college, income of persons in a locality,yield of wheat per acre in a certain district, etc., are examples of measurable facts.(b) Facts that are not measurable but we can feel the presence or absence of thecharacteristics. Honesty, colour of hair or eyes, beauty, intelligence, smoking habitetc., are examples of immeasurable facts. Statistics or data can be obtained insuch cases also, by counting the number of individuals in different categories. Forexample, the population of a country can be divided into three categories on thebasis of complexion of the people such as white, whitish or black.2.Statistics are aggregate of facts: A single numerical figure cannot be regardedas statistics. Similarly, a set of unconnected numerical figures cannot be termed asstatistics. Statistics means an aggregate or a set of numerical figures which arerelated to one another. The number of cars sold in a particular year cannot beregarded as statistics. On the other hand, the figures of the number of cars sold invarious years of the last decade is statistics because it is an aggregate of relatedfigures. These figures can be compared and we can know whether the sale of carshas increased, decreased or remained constant during the last decade.It should also be noted here that different figures are comparable only if they areexpressed in same units and represent the same characteristics under differentsituations. In the above example, if we have the number of Ambassador cars soldin 1981 and the number of Fiat cars sold in 1982, etc., then it cannot be regarded asstatistics. Similarly, the figures of, say, measurement of weight of students shouldbe expressed in the same units in order that these figures are comparable with oneanother.163.Statistics are affected to a marked extent by a multiplicity of factors: Statisticaldata refer to measurement of facts in a complex situation, e.g., business or economicphenomena are very complex in the sense that there are a large number of factorsoperating simultaneously at a given point of time. Most of these factors are evendifficult to identify. We know that quantity demanded of a commodity, in a givenperiod, depends upon its price, income of the consumer, prices of other commodities,taste and habits of the consumer. It may be mentioned here that these factors areonly the main factors but not the only factors affecting the demand of a commodity.Similarly, the sale of a firm in a given period is affected by a large number offactors. Data collected under such conditions are called statistics or statistical data.4.Statistics are either enumerated or estimated with reasonable standard ofaccuracy:This characteristic is related to the collection of data. Data are collectedeither by counting or by measurement of units or individuals. For example, thenumber of smokers in a village are counted while height of soldiers is measured.
We may note here that if the area of investigation is large or the cost of measurementis high, the statistics may also be collected by examining only a fraction of the totalarea of investigation.Quantitative Techniques –IntroductionWhen statistics are being obtained by measurement of units, it is necessary tomaintain a reasonable degree or standard of
Quantitative Techniques for Management School of Distance Education Bharathiar University, Coimbat