Transcription
SECTION 6: BATTERY BANKSIZING PROCEDURESESE 471 – Energy Storage Systems
Batteries for Stationary Applications2 Battery energy storage systems are used in a variety of stationaryapplications Telecom., remote communication systemsBridging supply for UPS applications Utilities – switch gear – black start Power plantSubstationOff-grid PV systems Data centersHospitalsWafer fabs, etc.ResidentialCommercialRemote monitoringLead-acid batteries still commonly used in these applicationsK. WebbESE 471
Autonomy3 Autonomy Length of time that a battery storage system must provideenergy to the load without input from the grid or PV sourceTwo general categories: Short duration, high discharge ratePower plants Substations Grid-powered Longer duration, lower discharge rateOff-grid residence, business Remote monitoring/communication systems PV-powered K. WebbESE 471
Battery Bank Sizing Standards4 Two IEEE standards for sizing lead-acid battery banks forstationary applications IEEE Std 485IEEE Recommended Practice for Sizing Lead-Acid Batteries forStationary Applications Short duration, high discharge rate IEEE Std 1013IEEE Recommended Practice for Sizing Lead-Acid Batteries forStand-Alone Photovoltaic Systems Longer duration, lower discharge rate We’ll look first at the common considerations for bothstandards beforeK. WebbESE 471
Basic Battery Sizing Approach5 Determine the load profile over the autonomy periodSize a battery bank to have sufficient capacity toprovide the required energy over the autonomyperiod, accounting for:System voltage Temperature Aging Maximum depth of discharge Rate of discharge K. WebbESE 471
6K. WebbCommon Battery-Sizing ConsiderationsESE 471
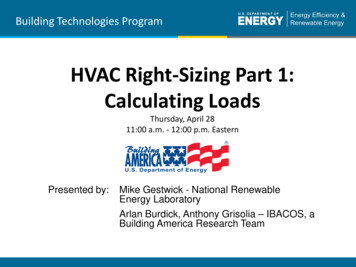
Duty Cycle7 Tabulate and, possibly, plot system loads over theautonomy period Duty-cycle diagram (plot) often more useful for shorterduration, higher current applicationsFor example, consider a 2-hr autonomy period with thefollowing loads:K. WebbLoad #Current (A)tstart (min)T (min)1501202301510310257544010010ESE 471
Duty-Cycle Diagram8Load #K. WebbCurrent (A)tstart (min)T (min)L150120L2301510L3102575L44010010ESE 471
Duty-Cycle Diagram9 Total energy (actually, charge) required by the load overthe autonomy period is the area under the curve K. WebbSizing procedures map the load profile to a battery capacitycapable of supplying the loadESE 471
Constant-Current vs. Constant-Power Loads10 Typically easiest to deal with constant-current loadsConvert constant-power loads to constant current Approximate,because battery voltage decreases duringdischarge Use a minimum voltage to provide a conservativeestimate𝐼𝐼 𝑃𝑃𝑉𝑉𝑚𝑚𝑚𝑚𝑚𝑚can be either the manufacturer’s recommendedminimum voltage or 95% of the nominal voltage 𝑉𝑉𝑚𝑚𝑚𝑚𝑚𝑚K. WebbESE 471
System Voltage11 Batteries are comprised of multiple series-connected cells Common battery configurations: For lead-acid batteries at 100% SoC, nominal voltage is 2.1 V/cell1 cell: 2 V3 cells: 6 V6 cells: 12 VMultiple batteries can be connected in series for highersystem voltage K. WebbEfficiencyCapacity optimizationOther system-specific considerationsESE 471
Operating Temperature12 Standard temperature for battery capacity rating is 25 CCapacity decreases at lower temperaturesFor minimum electrolyte temperatures below 25 C,multiply determined capacity by a correction factor For example, from IEEE 485, Table 1:Electrolyte Temp. [ F] Electrolyte Temp. [ C]Correction 0 0.5%/ F (0.9%/ C) reduction in capacity below 77 F (25 C)Capacity is typically not corrected for electrolytetemperatures above 25 CK. WebbESE 471
Aging13 Battery capacity degrades with ageIEEE standards recommend replacing batteries whencapacity has degraded to 80% of initial valueAdjust battery capacity for aging to ensure adequatecapacity at end of lifetime𝐶𝐶𝑎𝑎𝑎𝑎𝑎𝑎𝐶𝐶0 0.8𝐶𝐶𝑎𝑎𝑎𝑎𝑎𝑎100 𝐴𝐴𝐴 125 𝐴𝐴𝐴0.8For example, if 100 Ah of capacity is required, initialaging-adjusted capacity isK. WebbESE 471
Maximum Depth of Discharge14 For many battery types (e.g. lead acid), lifetime is affectedby maximum depth of discharge (DoD) Calculated capacity must be adjusted to account formaximum DoD Higher DoD shortens lifespanTradeoff between lifespan and unutilized capacityDivide required capacity by maximum DoD𝐶𝐶𝐷𝐷𝐷𝐷𝐷𝐷𝐶𝐶0 ��𝐷100 𝐴𝐴𝐴 167 𝐴𝐴𝐴0.6For example, if 100 Ah is required, but DoD is limited to60%, the required capacity isK. WebbESE 471
Battery Capacity vs. Rate of Discharge15 Consider two different 10-hour duty cycle diagrams: Equal energy requirements:𝐸𝐸1 20 𝐴𝐴 10 ℎ 200 𝐴𝐴𝐴 𝐸𝐸2 50 𝐴𝐴 2 ℎ 50 𝐴𝐴 2 ℎ 200 𝐴𝐴𝐴But, different required battery capacities: Battery capacity is a function of discharge rateAs discharge rate increases K. WebbLosses increaseCapacity decreasesESE 471
Battery Performance Curves16 Capacity vs. discharge current Different curves for different minimum cell fications 1.pdf Straight lines are lines of constant discharge time K. WebbHere, 1 to 10 hoursESE 471
Battery Performance Curves17 Same cells, 1-60 minute discharge ations 1.pdf Capacity decreases at higher discharge ratesK. WebbESE 471
Battery Capacity vs. Rate of Discharge18 When sizing a battery, we must account fordischarge rates in addition to total energy Largerrates nominal capacity required for higher dischargeFor example, consider a cell with the followingconstant-current discharge data for a minimum cellvoltage of 1.8 VDischargeTime [hr]24121087654321DischargeCurrent [A]12232732354045536688141Capacity [Ah]288276270256245240225212198176141K. WebbESE 471
Battery Capacity vs. Rate of Discharge19 Choose sizing procedure based on maximum load current Relative to discharge rates for the selected/proposed batteries Greater than or less than the 20-hr rate?Relative to average load Significantly greater than average load? For example: Max current for #2, 50 A, significantly exceeds average current, 20 A K. WebbIEEE std 485 is the appropriate procedureIEEE std 1103 may yield an overly-conservatively-sized batteryESE 471
Battery Capacity vs. Rate of Discharge20 Two methods for accounting for reduced capacity athigher discharge rates: Capacity Usedfactor, 𝑘𝑘𝑡𝑡in IEEE std 485 Functional Used hour ratein IEEE std 1013Next, we’ll look at each of these procedures indepthK. WebbESE 471
21K. WebbIEEE Std 485ESE 471
IEEE Std 48522 IEEE std 485 battery sizing procedureShorter-duration, higher-current applications Max current greater than 20-hr rate Max current much greater than average current Common applications: Bridging supply for UPS applicationsData centers Hospitals Wafer fabs, etc. Utilities – switch gear – black startPower plant Substation K. WebbESE 471
IEEE Std 485 – Tabulate Loads23 First, tabulate loads over during the autonomyperiod For example:Load #Current (A)tstart (min)T (min)1501202301510310257544010010Next, generate the duty cycle diagramK. WebbESE 471
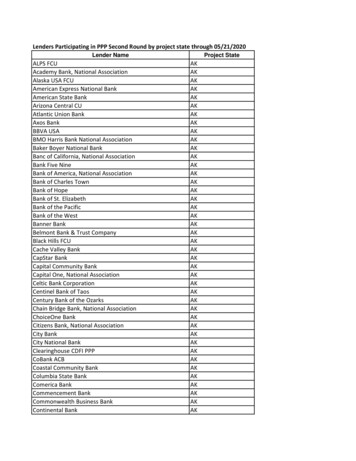
IEEE Std 485 – Duty Cycle Diagram24 Duty cycle diagram is divided into periods and sections Period– a portionof the duty cyclewith a constantload, 𝑃𝑃𝑖𝑖 SectionK. Webb– portion ofthe duty cycle fromthe beginning of thecycle to the end ofeach period, 𝑆𝑆𝑗𝑗ESE 471
IEEE Std 485 – General Procedure25 Determine the required capacity for each section Rate Discharge factor, 𝑘𝑘𝑡𝑡Maximum section capacity identified This of discharge is accounted for hereis the uncorrected capacityUncorrected capacity is adjustedby temperature correction factor Multiplied by design margin Divided by aging factor Multiplied Result is the required capacityK. WebbESE 471
Section Capacity – Worksheet26Load[A]PeriodChange in Load[A]Duration of Period[min]Time to End of Section[min]Section 1 - First period only1A1 5A1 - 0 5P1 15T P1 15Section 2 - First two periods only1A1 52A2 35A1 - 0 5A2 - A1 30P1 15P2 10T P1 P2 25T P2 10Section 3 - First three periods only1A1 52A2 353A3 15A1 - 0 5A2 - A1 30A3 - A2 -20P1 15P2 10P3 75 T P1 P2 P3 100T P2 P3 85T P3 75DischargeFactor, kt[Ah/A]RequiredSection Size[Ah]0.783.9Section Total: 3.90.9984.990.69920.97Section Total: 25.962.4722.2172.048Section Total:12.3666.51-40.9637.91Capacity determined for each section Sum of capacities required for Change in the load at the start of each periodAssuming that load persists until the end of the sectionScaled by the discharge factor, 𝑘𝑘𝑡𝑡 , for the time from the start of the period tothe end of the section𝑠𝑠K. Webb𝐶𝐶𝑠𝑠 𝐴𝐴𝑝𝑝 𝐴𝐴𝑝𝑝 1 𝑘𝑘𝑡𝑡𝑝𝑝 1ESE 471
Discharge Factor27Load[A]PeriodChange in Load[A]Duration of Period[min]Time to End of Section[min]Section 1 - First period only1A1 5A1 - 0 5P1 15T P1 15Section 2 - First two periods only1A1 52A2 35A1 - 0 5A2 - A1 30P1 15P2 10T P1 P2 25T P2 10 RequiredSection Size[Ah]0.783.9Section Total: 3.90.9980.6994.9920.97So, what is 𝑘𝑘𝑡𝑡 ? DischargeFactor, kt[Ah/A]Note different 𝑘𝑘𝑡𝑡 values for different times-to-end-of-sectionsManufacturers provide data for current available for different times Time-current product gives capacity at that discharge rateData given for a range of final cell voltages K. WebbThis is how max depth of discharge is accounted forFor example, for final cell voltage of 1.8 ications 1.pdfESE 471
Discharge Factor28 Discharge factor, 𝑘𝑘𝑡𝑡 , for time-to-end-of-section, 𝑇𝑇: 𝐶𝐶𝑛𝑛𝑛𝑛𝑛𝑛 [𝐴𝐴𝐴]𝑘𝑘𝑡𝑡 𝐴𝐴 𝑇𝑇 [𝐴𝐴]𝐶𝐶𝑛𝑛𝑛𝑛𝑛𝑛 : nominal capacityTyp. 8 or 20 hr capacity From manufacturer’s data Arbitrary – used as reference capacity for final sizing For example: 𝐴𝐴 𝑇𝑇 : current available for time-to-end-of-section, 𝑇𝑇 K. Webb𝐶𝐶𝑛𝑛𝑛𝑛𝑛𝑛 50 𝐴𝐴𝐴 (8 hr)Calculated capacity requirement: 150 AhRequired number of cells: 3From manufacturer’s dataESE 471
Discharge Factor29 Consider the following battery data for discharge to 1.8 V/cell:Discharge timeDischarge current [A]Capacity [Ah] K. 15858Minutes30151941331894733.3 3.15Let 𝐶𝐶𝑛𝑛𝑛𝑛𝑛𝑛 104 𝐴𝐴𝐴 (8 hr capacity)Discharge factor for 1 hr: 245.1122Hours61696𝑘𝑘𝑡𝑡 𝐶𝐶𝑛𝑛𝑛𝑛𝑛𝑛 104 𝐴𝐴𝐴 1.79 ℎ𝑟𝑟𝐴𝐴 𝑇𝑇58 𝐴𝐴That is, for 1-hr discharge, size for 1.79 hr using the 8 hr capacity as areferenceAccounts for capacity reduction at high currentDischarge factor for 15 min:𝐶𝐶𝑛𝑛𝑛𝑛𝑛𝑛 104 𝐴𝐴𝐴𝑘𝑘𝑡𝑡 0.782 ℎ𝑟𝑟𝐴𝐴 𝑇𝑇133 𝐴𝐴Linearly interpolate currents for intermediate discharge timesESE 471
Discharge Factor - Example30Discharge timeDischarge current [A]Capacity [Ah] 858309447Minutes15113318933.3 3.15Each battery can provide 13 A for 8 hrDetermine the # of batteries required to supply 100 A for 2 hr (200 Ah) 129.3112Again, let 𝐶𝐶𝑛𝑛𝑛𝑛𝑛𝑛 104 𝐴𝐴𝐴 (8 hr capacity) 245.1122Discharge factor:Required capacity:𝑘𝑘𝑡𝑡 𝐶𝐶𝑛𝑛𝑛𝑛𝑛𝑛 104 𝐴𝐴𝐴 2.81 ℎ𝑟𝑟𝐴𝐴 𝑇𝑇37 𝐴𝐴𝐶𝐶 𝐴𝐴 𝑘𝑘𝑡𝑡 100 𝐴𝐴 2.81 ℎ𝑟𝑟 281 𝐴𝐴𝐴Required number of batteries:𝑁𝑁 𝐶𝐶𝐶𝐶𝑛𝑛𝑛𝑛𝑛𝑛 281 𝐴𝐴𝐴 2.7 3104 𝐴𝐴𝐴Note that failure to account for discharge rate would yield N 2K. WebbESE 471
Section Capacity31 Section capacity given by:𝑠𝑠𝐶𝐶𝑠𝑠 𝐴𝐴𝑝𝑝 𝐴𝐴𝑝𝑝 1 𝑘𝑘𝑡𝑡 𝑝𝑝 1[𝐴𝐴𝑝𝑝 𝐴𝐴𝑝𝑝 1 ] is the change in current at the start of each period Each current scaled by the discharge factor for time 𝑇𝑇:orK. WebbAssumed to last until the end of the section, duration 𝑇𝑇Adjusted by the change in current at the next periodMay be positive or negative𝐴𝐴𝑝𝑝 𝐴𝐴𝑝𝑝 1𝐶𝐶𝑛𝑛𝑛𝑛𝑛𝑛 𝑘𝑘𝑡𝑡 ��𝑐 𝑟𝑟𝑟𝑟𝑟𝑟. 𝑓𝑓𝑓𝑓𝑓𝑓 𝑇𝑇 ��𝑐 𝑎𝑎𝑎𝑎𝑎𝑎𝑎𝑎𝑎𝑎. 𝑓𝑓𝑓𝑓𝑓𝑓 𝑇𝑇𝐴𝐴𝑝𝑝 𝐴𝐴𝑝𝑝 1 𝑘𝑘𝑡𝑡 ��𝑐 𝑟𝑟𝑟𝑟𝑟𝑟. 𝑓𝑓𝑓𝑓𝑓𝑓 𝑇𝑇 ��𝑐𝑐𝑐𝑐𝑐𝑐𝑐𝑐𝑐 𝑎𝑎𝑎𝑎𝑎𝑎𝑎𝑎𝑎𝑎. 𝑓𝑓𝑓𝑓𝑓𝑓 𝑇𝑇ESE 471
Section Capacity – Worksheet32 Consider the third section:determined for each 𝑇𝑇 Change in load scaled by𝑘𝑘𝑡𝑡 to give requiredcapacity for each periodwithin the section Section capacity is the sumof the period capacities 𝑘𝑘𝑡𝑡PeriodLoad[A]Section 3 - First three periods only1A1 52A2 353A3 15Change in Load[A]A1 - 0 5A2 - A1 30A3 - A2 -20Duration of Period[min]P1 15P2 10P3 75Time to End of Section[min]T P1 P2 P3 100T P2 P3 85T P3 75DischargeFactor, kt[Ah/A]2.4722.2172.048RequiredSection Size[Ah]12.3666.51-40.96Section Total: 37.91K. WebbESE 471
Uncorrected Capacity33 Uncorrected capacity is the largest total section capacity Capacity then adjusted for TemperatureDesign marginAgingMaximumRandomUncorrectedSection Size Section Size esignAgingSize xFactor xMargin /Factor 61.4451.191.15RequiredCapacity [Ah]0.8105.11Result is the required capacity Plus capacity for any random loadsNumber of cells required is determined from the required capacity andthe reference capacity𝑁𝑁 𝐶𝐶𝐶𝐶𝑛𝑛𝑛𝑛𝑛𝑛Note that DoD was accounted for by selecting capacity data for theappropriate final cell voltageK. WebbESE 471
34K. WebbIEEE Std 1013ESE 471
IEEE Std 101335 IEEE std 1013 battery sizing procedure Longer-duration,lower-current applications Max current less than 20-hr rate Max current not significantly greater than average Typically for off-grid PV systems Residential Commercial RemoteK. WebbmonitoringESE 471
IEEE Std 1013 – General Procedure36 Determine the required autonomy periodLoad determination Calculate energy requirement (Ah) over the autonomy period System voltage and allowable rangeTabulate loads – daily or over the autonomy periodLoad profile (duty cycle) diagramUnadjusted capacityAdjust capacity for K. WebbDepth of dischargeAgingTemperatureDesign marginDischarge rateESE 471
Load Determination37 Tabulate loads over autonomy periodCurrent Start time and duration Momentary (e.g. motor starting) and running loads Plot load profile where appropriateAre timing, duration, and coincidence of loads known? If not, determine worst-case scenarios Determine:Maximum momentary current Maximum running current Total daily load (Ah/day) Maximum and minimum allowable system voltages K. WebbESE 471
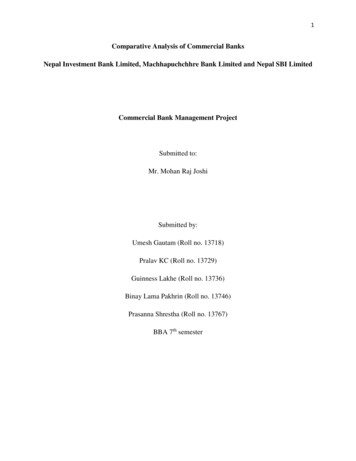
Load Determination – Example38 Consider, for example, a remote refrigerator/freezer unit formedical storage and ice making Solar chargingSix-day autonomy periodDaily load profile:K. WebbESE 471
Load Determination – Example39 Tabulate the load data, accounting for Running currentStarting currentParasitic load current (e.g. control electronics, etc.)DC load deviceCompressor(chill)Compressor(ice making)Compressor(starting)Parasitic load(controls, etc.)Voltage ncesDurationRun TimeDaily Load[#/day][hr/occurance][hr/day][Ah/day]Vmax [V]Vmin 242.4150.1Total Daily Load [Ah/day] 51.4Motor starting currents conservatively assigned durations ofone-minute (0.0167 hr)K. WebbESE 471
Load Determination405) Load Data Summarya) Maximum momentary currentb) Maximum running currentc) Maximum currentd) Total daily loade) Maximum system voltagef) Minimum system voltage Max lines 5a and 5bMotor starting current may be much larger than running currentAssumed duration is 1 minUsed for total daily load calculation and max currentMaximum running current (line 5b) AAAAh/dayVVMaximum momentary current (line 5a) 15.16.115.151.41510.5If load coincidence is unknown, determine worst caseUsed for total daily load calculation and max currentMaximum current (line 5c) K. WebbUsed when determining minimum system voltage when accounting forvoltage dropsESE 471
Load Determination415) Load Data Summarya) Maximum momentary currentb) Maximum running currentc) Maximum currentd) Total daily loade) Maximum system voltagef) Minimum system voltage Max lines 5a and 5bDaily energy (charge, really) requirement in Ah/daySum of products of currents and durationsUsed for determining required capacityMaximum system voltage (line 5e) AAAAh/dayVVTotal daily load (line 5d) 15.16.115.151.41510.5Lowest max. allowable voltage for all system componentsUsed for determining number of series-connected cellsMinimum system voltage(line 5f) K. WebbHighest min. allowable voltage for all system componentsUsed for determining number of series-connected cellsESE 471
Battery Capacity42 First, calculate the unadjusted capacity Productof total daily load and number of days ofautonomy Next, adjust capacity for: Maximumdepth of discharge Maximum daily depth of discharge Minimum operating temperature Design marginK. WebbESE 471
Battery Capacity436) Battery Capacitya) Unadjusted capacityb) Max DoDc) Capacity adjusted for MDoDd) Max daily DoDe) Capacity adjusted for MDDoDf) 3088038620257Ah%Ah%Ahline 5d * line 3line 6a/line 6bline 5d/line 6dUnadjusted capacity (line 6a)Product of total daily load and number of days of autonomy Daily energy (charge, really) requirement in Ah/day Maximum depth of discharge (MDoD, line 6b)From manufacturer’s data/recommendation Tradeoff between capacity and lifetime Capacity adjusted for MDoD (line 6c) K. WebbUnadjusted capacity divided by MDoDESE 471
Battery Capacity446) Battery Capacityc) d) Max daily DoDe) Capacity adjusted for MDDoDf) End-of-life capacityg) Capacity adjusted for EoLh) line 6a/line 5fFrom manufacturer’s data/recommendationTotal daily load divided by MDDoDEnd of life (EoL) capacity (line 6f) line 5d/line 6dCapacity adjusted for MDDoD (line 6e) %Ah%AhMaximum daily DoD (MDDoD, line 6d) 2025780386Battery to be replace when capacity degrades to this percentage ofrated capacityTypically 80% for lead-acid batteriesCapacity adjusted for EoL (line 6g) K. WebbUnadjusted capacity divided by EoL capacityESE 471
Battery Capacity456) Battery Capacityg) h) Capacity adjusted for DoD or EoLi) Min. operating temperaturej) Temperature correction factork) Capacity adjusted for temperaturel) line 6h *line 6jLargest of the three adjusted capacitiesSatisfies all three requirementsTemperature correction factor (line 6j) Max of lines 6c, 6e, and 6gCapacity adjusted for MDoD, MDDoD, or EoL (line 6h) 386 Ah25 degC1386 AhCorrection factor for minimum electrolyte temperatures below 25 CDon’t compensate for temperature above 25 CFrom manufacturer’s data (or IEEE std 485, Table 1) 0.5%/ F (0.9%/ C) reduction in capacity below 77 F (25 C)Capacity adjusted for temperature (line 6k) DoD/EoL-adjusted capacity multiplied by temperature correction factorK. WebbESE 471
Battery Capacity466) Battery Capacityk) l) Design margin factorm) Capacity adjusted for design margin7) Functional Hour Rate 70 hrline 6m/line 5bAllows for load uncertainty and growthTypically 10% – 25% (i.e. 1.1 – 1.25)Capacity adjusted for design margin (line 6m) line 6k * line 6lDesign margin factor (line 6l) 1.1424 AhTemperature-corrected capacity multiplied by design marginFunctional hour rate (line 7) K. WebbUsed to account for discharge rate in final capacity determinationA conservative ‘average’ discharge rate for the duty cycleAdjusted capacity divided by the maximum running currentESE 471
Functional Hour Rate47 Functional hour rateAdjusted capacity divided by the max running current The discharge time at the max running current Used to account for capacity dependence on discharge rate An alternative to the discharge factor used in IEEE std 485 For example:Adjusted capacity: 424 Ah Maximum running current: 6.1 A Functional hour rate ��𝑚𝑚𝑚 424 𝐴𝐴𝐴6.1 𝐴𝐴 70 ℎ𝑟𝑟For final cell selection, use the capacity rating at thefunctional hour rateK. WebbESE 471
Voltage Window Adjustment488) Voltage Window Adjustmenta) Controller low-voltage disconnectb) Adjusted minimum voltagec) Controller full-charge voltage set pointd) Adjusted maximum voltage Min of lines 5e and 8cVoltage at which the charge controller is set to disconnect the battery from the loadVoltage at the maximum DoDLarger of the LVD set point and the minimum allowable system voltageUsed when determining number of series-connected cellsController full-charge voltage set point (line 8c) Max of lines 5f and 8aAdjusted minimum voltage (line 8b) VVVVController low-voltage disconnect (LVD, line 8a) 10.810.814.714.7Voltage at which the charge controller stops charging the batteryVoltage at full SoCAdjusted maximum voltage (line 8d) Smaller of the controller full-charge set point and the maximum allowable system voltageUsed when determining number of series-connected cellsK. WebbESE 471
Series-Connected Cells499) Series-Connected Cellsa) Recommended per-cell full-charge voltageb) Maximum number of cells in seriesc) Rec. per-cell end-of-discharge voltaged) Calculated per-cell EoD voltage From manufacturer’s dataMaximum allowable system voltage divided by the maximumvolts/cell, rounded downRecommended per-cell end of discharge voltage (line 9c) line 8b/line 9bMaximum number of cells in series (line 9b) line 8d/line 9a rounded downRecommended per-cell full-charge voltage (line 9a) 2.45 V/cell61.8 V/cell1.8 V/cellFrom manufacturer’s dataCalculated per-cell EoD voltage (line 9d) K. WebbMinimum system voltage divided by number of series cellsESE 471
Series-Connected Cells509) Series-Connected Cellsd) If 9.d) 9.c) proceed to 9.g), otherwise continue with 9.e)e) Decremented # series-connected cellsf) Adjusted maximum per-cell voltage- VVerify that 9.f) is within maximum allowable cell voltage. If not, adjustg) Number of cells in series6 line 9b or, if applicable, line 9eCalculated per-cell EoD voltage (line 9d) line 9b - 1line 8d/line 9eMinimum system voltage divided by number of series cellsMinimum voltage seen by each cell at EoDIf less than recommended, decrement the number of series cells by one(line 9e)Adjusted maximum per-cell voltage (line 9f) K. WebbMaximum system voltage divided by the decremented number of seriescellsMax per-cell voltage after reducing number of series cellsIf greater than recommended maximum, adjustments are requiredESE 471
Series-Connected Cells519) Series-Connected Cellsd) If 9.d) 9.c) proceed to 9.g), otherwise continue with 9.e)e) Decremented # series-connected cellsf) Adjusted maximum per-cell voltage- VVerify that 9.f) is within maximum allowable cell voltage. If not, adjustg) Number of cells in series6 If not, iteration is requiredAdjust some combination of the following: line 9b or, if applicable, line 9eMinimum and maximum per-cell voltages must be withinrecommended range line 9b - 1line 8d/line 9eNumber of series-connected cellsLow-voltage disconnect set pointController full-charge voltage set pointNumber of cells in series (line 9g) K. WebbThe selected number of series cellsESE 471
Cell Selection and Capacity Determination5210) Cell Selection and Capacity Determinationa) Smallest cell capacity available for selected celltype that satisfies capacity requirement, line6m, when discharged to per-cell EoD voltage,line 9d or 9e, at functional hour rate, line 7.OR, if no single cell satisfies requirements,capacity of cell to be paralleled.b) Number of parallel stringsc) Final battery capacity Really, a battery with the selected number of series-connected cells (line 9g)The smallest single cell, or smaller cells to be paralleled, to: Satisfy adjusted capacity requirement (line 6m) line 6m/line 10a rounded upline 10a * line 10bSelect a cell and enter the capacity (line 10a) 110 Ah4440 AhWhen discharged at the functional hour rate (line 7)When discharged to the determined per-cell EoD voltage (section 9)Minimize excess, unutilized capacityThis is the capacity at the functional hour rate K. WebbNot necessarily the battery’s nominal capacityESE 471
Cell Selection and Capacity Determination5310) Cell Selection and Capacity Determinationa) Smallest cell capacity available for selected celltype that satisfies capacity requirement, line6m, when discharged to per-cell EoD voltage,line 9d or 9e, at functional hour rate, line 7.OR, if no single cell satisfies requirements,capacity of cell to be paralleled.b) Number of parallel stringsc) Final battery capacity line 6m/line 10a rounded upline 10a * line 10bNumber of parallel strings (line 10b) 110 Ah4440 AhNumber of parallel batteries needed to satisfy the adjustedcapacity requirement (line 6m)Adjusted capacity divided by the per-battery capacity, rounded upFinal battery capacity (line 10c) K. WebbCapacity of the resulting battery bankPer-battery capacity multiplied by the number of parallel stringsBattery bank capacity at the functional hour rateESE 471
Battery Bank Summary54SummaryBattery manufacturer and model:Cells in series:Cells in parallel:Full-charge voltage:End-of-discharge voltage:XYZ Batteries: 123-ABC6414.7 V10.8 V Battery sizing procedure is now completeSummarize key battery bank specifications at the end ofthe worksheet For our example: Four of the specified batteries in parallel K. WebbSix cells per batteryBattery bank voltage range: 10.8 V – 14.7 VESE 471
IEEE Std 485 IEEE std 485 battery sizing procedure Shorter-duration, higher-current applications Max current greater than 20-hr rate Max current much greater than average current Common applications: Bridging supply for UPS applications Data centers Hospitals Wafer fab