Transcription
Accountability Report Transmittal FormOrganization Name Greenville Technical CollegeDate of Submission September 11, 2007Organization Director Dr. Thomas E. Barton, Jr., PresidentOrganization Contact Person Lucy Hinson, IE CoordinatorOrganization Contact’s Telephone Number (864) 250-8028
GREENVILLE TECHNICAL COLLEGECOLLEGE THAT WORKSANNUAL ACCOUNTABILITYREPORTFISCAL YEAR 2006-2007
GREENVILLE TECHNICAL COLLEGEANNUAL ACCOUNTABILITY REPORTTABLE OF CONTENTSI. Executive Summary.11.1.Organization Purpose, Mission and Values.11.2.Major Achievements from Past Year .11.3.Key Strategic Goals .21.4.Opportunities and Barriers Affecting Organizational Success.21.5.Use of Accountability Report to Improve Organizational Performance .3II. Organizational Profile.42.1.Primary Educational Programs, Offerings, Services, and Delivery Methods .42.2.Key Student Segments, Stakeholders, and Market Populations .42.3.Operating Locations.52.4.Number of Employees .52.5.Regulatory Environment.52.6.Governance System .52.7.Partners and Key Suppliers.62.8.Key Competitors.62.9.Factors Determining Competitive Success.62.10.Key Strategic Challenges.62.11.Performance Improvement Systems .72.12.Organizational Structure.82.13.Expenditures/Appropriations Chart .92.14.Major Program Areas Chart.10III. Elements of Malcolm Baldrige Criteria.12Category 1 – Senior Leadership, Governance, and Social Responsibility .12Category 2 – Strategic Planning .153.2.1. Strategic Planning Process.153.2.2. Addressing the Strategic Challenges .163.2.3. Evaluation of Strategic Planning Process .173.2.4. Developing and Tracking Action Plans and Allocating Resources.173.2.5. Communicating and Deploying Strategic Initiatives, Action Plans and RelatedPerformance Measures.173.2.6. Measuring the Progress on Action Plans .173.2.7. Strategic Plan Accessibility .173.2.8. Strategic Planning Chart .18Category 3 – Student, Stakeholder, and Market Focus .223.3.1. Determining Student and Market Segments .223.3.2. Maintaining Currency of Student and Stakeholder Expectations.233.3.3. Using Student and Stakeholder Information for Continuous Improvement.243.3.4. Determining Student and Stakeholder Satisfaction .243.3.5. Building Positive Relationships to Attract and Retain Students and Stakeholders .24
GREENVILLE TECHNICAL COLLEGEANNUAL ACCOUNTABILITY REPORTTABLE OF CONTENTSCategory 4 – Measurement, Analysis, and Knowledge Management.263.4.1. Selecting Operations, Processes and Systems for Measurement.263.4.2. Using Data/Information Analysis to Provide Effective Support for DecisionMaking.263.4.3. Key Measures .263.4.4. Selecting Key Comparative Data to Support Decision Making .273.4.5. Ensuring Data Integrity, Timeliness, Accuracy, Security and Availability .273.4.6. Translating Organizational Performance Review Findings into Priorities forContinuous Improvement .283.4.7. Collecting, Transferring, and Maintaining Organizational and EmployeeKnowledge.28Category 5 – Faculty and Staff Focus.303.5.1. Organizing and Managing Work to Enable Faculty/Staff Development.303.5.2. Evaluation and Improvement of the Organization and Human Resource RelatedProcesses.303.5.3. Achieving Effective Communication and Sharing .303.5.4. FPMS/EPMS Support of Performance .313.5.5. Accomplishing Succession Planning and Career Progression.313.5.6. Faculty/Staff Development Effectiveness .313.5.7. Motivating Faculty/Staff to Utilize Potential .313.5.8. Assessment Measures and Methods .323.5.9. Use of Assessment Findings to Identify and Determine Priorities forImprovements .323.5.10. Maintaining Safe, Secure, Healthy Work Environment .32Category 6 – Process Management.343.6.1. Key Learning-Centered Processes.343.6.2. Input for Determining Key Learning-Centered Process Requirements.353.6.3. Incorporating Organizational Knowledge into Process Design.363.6.4. Key Performance Measures for Improvement of Learning-Centered Processes.363.6.5. Key Support Processes .373.6.6. Ensuring Adequate Budgetary and Financial Resources.37Category 7 – Organizational Performance Results.383.7.1. Key Measures on Student Learning and Improvements in Student Learning .383.7.2. Key Measures on Student and Stakeholder Satisfaction and Dissatisfaction.423.7.3. Key Measures on Budgetary and Financial Performance.493.7.4. Key Measures on Work System Performance .513.7.5. Key Measures of Organizational Effectiveness/Operational Efficiency .533.7.6. Key Measures Related to Leadership and Social Responsibility .58
Section I – Executive SummaryI.Executive Summary1.1.Organization Purpose, Mission and ValuesPurpose: Founded in 1962 as the first of sixteen colleges in the South Carolina TechnicalEducation System, Greenville Technical College (GTC) is an accredited, state-supportedpostsecondary institution dedicated to providing affordable, quality educational opportunities toresidents throughout the Greenville metropolitan area. The college is further committed topreparing both traditional and non-traditional students for entry-level employment, admission toa four-year college or university, professional career advancement, and personal developmentactualization.Mission and Values: GTC’s Mission Statement was revised at its Strategic Planning retreatMay 16, 2007, to reflect its commitment to learning that enables student success and promoteseconomic development. “Greenville Technical College drives personal and economic growththrough learning.” GTC is committed to the following values: learning, integrity, diversity,cooperation, excellence and accountability.1.2.Major Achievements from Past YearAcademic & Student Access GTC became part of Health Sciences SC, the state’s first patient simulation trainingcenter. GTC partnered with Embry-Riddle Aeronautical University to enhance opportunities forstudents in aviation maintenance, allowing students to move seamlessly from GTC toEmbry-Riddle for a bachelor’s degree. GTC and the University of South Carolina signed an agreement establishing a bridgeprogram. Bridge opportunities are also available through USC Upstate and College ofCharleston. GTC signed historic articulation agreements with each of the Historically Black Collegesand Universities (HBCU). This new venture will create new avenues for minoritystudents to access the HBCU’s.Leadership in Workforce Development Training and Education GTC is one of four colleges which, with State Tech, have received a 1.25 million grantfrom AdvanceSC to support the manufacturing sector by developing a state-of-the-artindustrial maintenance/mechatronics consistent among the college partners. As part ofthe project, student recruitment programs will be intensified in an effort to attract morepeople into this high-paying career much needed by industry. The Quick Jobs with a Future program celebrated its fifth anniversary with 10,266registrations.Proactive Planning for Future Development and Leadership GTC Leadership Team revised the college’s Mission Statement, focusing ondemonstrating student success and becoming a learning college.1
Section I – Executive SummaryExpanded Facilities to Support Student and Community Needs Greenville Tech Foundation Student Housing opened, allowing students to live wherethey learn. McCall Hospice House opened on the Brashier Campus, providing care for terminally illpatients and affording nursing students at GTC an additional site for hands-on learning.Increased Extramural Funding In addition to the AdvanceSC grant cited above, grant awards included SC Allied Health Initiative to support nursing and allied health programs: 1.6M( 1,604,166) National Science Foundation grant to support AMT research with Clemson: 887K ( 886,886)1.3.Key Strategic GoalsNoted below are the 2006-2010 strategic initiatives that are essential to the growth,improvement, and expansion of the college. They are also intended to support Greenville Tech’slong-range goal to reach and effectively serve 20,000 students by the year 2010-11. 1.4.Focus on student learning and experience by providing exemplary student supportservices and teaching/learning environments and by exceeding customer expectations inall college processes.Nurture and support an environment of caring learning community among our inclusiveGTC family, with attention to wellness, security, personal growth opportunities,collegiality, and open communications.Ensure optimal learning through integral use of technology in all college functions.Demonstrate a commitment to continuous development of our human resources.Use reliable data in the planning and generation of resources.Focus on corporate, economic, and community development.Opportunities and Barriers Affecting Organizational SuccessFIGURE 1.4-1: ORGANIZATIONAL OPPORTUNITIES AND BARRIERS Organizational BarriersBalancing the cost of growth with existingprograms and servicesInadequate technology infrastructure andmanagementInsufficient data collection capabilities requiredfor institutional research and statewidecompliancy reporting OpportunitiesHighly collaborative, participative strategicplanning processEntrepreneurial spirit aimed at generating newrevenuesLocated in the heart of the Upstate, one ofSouth Carolina’s most progressive and rapidlydeveloping regionsStrong and deep-rooted partnerships with thecommunity, local industry and othereducational facilitiesLottery tuition and merit-based assistance tostudentsCompetency-based curriculum and 60 advisorycommittees2
Section I – Executive Summary1.5.Use of Accountability Report to Improve Organizational PerformanceGTC intends to use the annual accountability reporting exercise as a means to drive itscommitment to continuous organizational improvement. More specifically, this process helpsthe college focus on how well it is performing in seven key areas including: senior leadership,strategic planning, student engagement, data collection and analysis, human resourcedevelopment, process management, and measurable outcomes. Additionally, it will serve as aprimary informational source relative to college operations and management.3
Section II – Organizational ProfileII.Organizational Profile2.1.Primary Educational Programs, Offerings, Services, and DeliveryMethodsCollege that Works is GTC’s motto and refers to Tech’s long-standing commitment to workingnot only to provide quality education to its students but also to enhance the economic vitality ofthe community. Established in 1962 as the first of 16 colleges in the South Carolina TechnicalEducation System, GTC’s study options include technical courses, certificates, diplomas, andassociate degrees in the areas of business, nursing, health sciences, engineering technologies,industrial technologies, and public service, as well as a comprehensive university transferprogram. Students may select from 35 associate degree, 12 diploma, and 131 certificate programalternatives. The college further provides continuing education for occupational advancementand personal interest, as well as economic development services that support business andindustrial growth in the community. Traditional didactic classroom instruction, online distancelearning, hands-on laboratory application, and convenient telecourses are all blended to create anoptimum study environment.2.2.Key Student Segments, Stakeholders, and Market PopulationsKey Student Segments: As an open admission institution, GTC’s population includestraditional students entering college directly from high school and a growing number of nonconventional students including adults in mid-life career change, displaced or under-employedtextile workers, newly arriving immigrants, transplants from neighboring states, and thoseseeking enhanced workforce training. The student body is diverse and generally reflects theethnic makeup of the service area as noted below.FIGURE 2.2-1: STUDENT PROFILEPopulationGreenville TechGreenville CountyWhite ther5%2.9%Sources: Greenville Technical College, 2006 Fact Book, August 2006 and State and County Quick Facts, US Census BureauFIGURE 2.2-2: STUDENT EXPECTATIONSAcademic Program Students14,322 (Fall 2006) Continuing Education Students55,696 (05-06 registrations) Learning ExpectationsEarn credits for transfer to four-yearcollege or universityObtain associate degree, diploma, orcertificateObtain skills needed for careeradvancementReceive entry-level job skills trainingObtain technical or job development skillsEngage in personal growth opportunities4
Section II – Organizational ProfileStakeholders: Many groups have a stake in the college. The state and local community, forexample, want to ensure that the institution serves the public interest. The faculty is concernedthat the institution upholds the standards of the academic disciplines. Students, on the otherhand, want an affordable, convenient, and productive educational experience. The challenge isin blending these various expectations to produce outcomes valued by all.2.3.Operating LocationsGTC maintains seven satellite locations throughout Greenville County including:Barton Campus: Offers students a full menu of degree, diploma, certificate, and university transfer options.Brashier Campus: Provides industrial technology programs, welding, fire service, as well as university transfer,nursing, and respiratory care.Greer Campus: Provides university transfer courses along with visual and performing arts, a variety of health careprovider programs, and cosmetology.Northwest Campus: Focuses on training related to small animal and veterinary care in addition to the universitytransfer classes.Donaldson Industrial Air Park: Places its emphasis on aircraft maintenance and truck driver training.McKinney Regional Automotive Technology Center: Specializes in automotive technology and maintenancetraining.Buck Mickel Center: The college’s primary site for professional development, continuing education, and QuickJobs with a Future training.Other operating locations of interest include the Admissions and Registration Center situated at McAlister Square,(several blocks from the main campus) and the new 438 bed Student Housing complex.2.4.Number of EmployeesGTC has 718 faculty (318 full-time and 400 part-time) and 631 staff (360 full-time and 271 parttime).2.5.Regulatory EnvironmentThe college president and the leadership team provide direct oversight of college operations inaccordance with standards set by the South Carolina State Board for Technical andComprehensive Education, which is responsible for the state-level development, implementationand coordination of postsecondary occupational and technical training, and education to supportarea-wide economic development. The South Carolina Commission on Higher Education acts asa coordinating board for both public and private higher educational institutions across the state.Additionally, GTC is fully accredited with the Commission on Colleges of the SouthernAssociation of Colleges and Schools (SACS) through 2012. Individual programs are accreditedby specific state, national, and professional organizations.2.6.Governance SystemGTC’s president is directly responsible for organization and operation of the college under thedirection of the Greenville County Commission for Technical Education (Area Commission).This board is comprised of ten constituents from GTC’s primary service area, including sevenmembers appointed by the governor to three-year terms, and three ex-officio members.5
Section II – Organizational Profile2.7.Partners and Key SuppliersGreenville Tech maintains ongoing strategic alliances with a variety of partners for the purposeof 1) recruiting new students, 2) transferring existing students to four-year college and universityprograms, and 3) providing workforce development and job skills training. Organizationsinclude local secondary and postsecondary institutions; Upstate workforce and economicdevelopment agencies; civic, community, and faith-based groups; as well as industry leaders andemployers.2.8.Key CompetitorsTwo public institutions (Spartanburg Community College and Tri-County Technical College) arelocated in service areas close to Greenville Tech. Additionally, two private vocational schools,ECPI College of Technology and ITT Technical Institute provide programming to populationsalso targeted by GTC.2.9.Factors Determining Competitive SuccessFIGURE 2.9-1: SUCCESS FACTORSFactors Impacting Competitive Success1. Maintaining a diversity of educational options2. Expanding partnerships with secondary andfour-year institutions3. Hiring and maintaining talented andprofessionally engaged faculty4. Providing competency-based curriculums thathave real-life applications and meet specificprofessional and occupational skillsets/standards5. Creating a multidimensional learningenvironment to accommodate a variety ofstudents with varying academic, career, andpersonal goals6. Developing new industry-driven trainingoptions7. Recognizing opportunities to recruit nontraditional student populations8. Using technology to optimally serve students,faculty, and staff9. Establishing a sense of community andcollegiate spirit on campus10. Seeking additional extramural fundingActions and Activities to Ensure SuccessEnhancing internal assessments including revisionof Mission Statement and identification ofassessment management software to integrateprocessesRestructuring Human Resource policies andimproving recruitment, hiring, and retentionproceduresMoving to a resource planning model where dataare used to drive decisionsNegotiated articulation agreements with sixhistorically black colleges, as well as transferagreements with Clemson, USC, and USC UpstateExpanding facilities to meet growing student needswith new facilities under construction atNorthwest CampusMoving to learning-centered focus in all areas of thecollege2.10. Key Strategic ChallengesImprove student retention and graduation rates. Received score of 2 (achieved standards) out of possible 3 (exceeds standards) forgraduation success rates from SC Commission on Higher Education (Jan 2005). Overall retention rates for first year, degree-seeking students for the combined 16technical colleges have declined from 55.7% in 2003 to 53.6% in 2006. Shift to student learning outcomes.6
Section II – Organizational ProfileMaintain academic quality and student support services despite continuing decline in stateallocations. In the last five years, state resources have declined from 37% of the college’s totalrevenue resources to 22.3%.Upgrade the information technology infrastructure. As a result of 2006 technology assessment, the college has hired a Chief InformationOfficer to address technology issues.Continue to be the leader in workforce development training with an emphasis on technicalskills enhancement. Community assessment surveys indicate the need for the college to add new training andacademic programs in the areas of advanced manufacturing, industrial maintenance,critical incident management, and health care technologies. All of these activities requiresubstantial fiscal, operational, academic, and spatial commitments.2.11. Performance Improvement SystemsStrategic Planning: The college has adopted a revised Mission Statement that focuses on itscommitment to putting learning first in all areas of the college. Plans were made to purchase anassessment management software, WEAVEonline, to organize and assess both academic andadministrative programs.Institutional Effectiveness Reporting: In response to Act 629 passed by the South Carolinalegislature in June 1988, all technical colleges are required to report to the SC Commission ofHigher Education (CHE) on the status of six major functional areas (see Figure 2.10-1). Thecollege submits data to CHE on accredited programs and credentialing exam pass rates that arecompiled annually in CHE’s Closer Look at Public Higher Education in South Carolina,Institutional Effectiveness, Accountability, and Performance.FIGURE 2.11-1: CHE REQUIRED REPORTING CATEGORIESReporting PeriodAnnuallyEvery Two YearsEvery Four YearsReporting ComponentMajors or ConcentrationsAchievement of Students Transferring from Two- to Four-Year InstitutionsGeneral Education – Student Development – Academic Advising – Library ResourcesStudent Surveys and Reports: The Office of Planning and Grants produces a number of inhouse surveys and reports and uses externally-developed surveys to determine performanceoutcomes and satisfaction ratings including, but not limited to: Community College Survey ofStudent Engagement (CCSSE), Graduate Follow-Up (annually), Employer Evaluation (annually), andAcademic Advising Survey (biennially).7
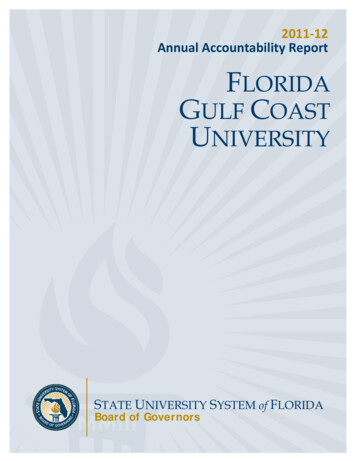
Section II – Organizational Profile2.12. Organizational StructureThe college’s organizational structure is comprised of a ten-member executive leadership teamcharged with setting policy, direction, and vision for the institution.FIGURE 2.13-1: GREENVILLE TECHNICAL COLLEGE ORGANIZATIONAL CHARTDr. Thomas E. Barton, Jr.PresidentJacqueline DiMaggioVice President for FinanceDr. Ben P. Dillard, IIISenior Vice PresidentJ. Curtis HarknessVice President forAdministration and DiversityDr. Barbara P. LassiterVice President for Planning &TechnologyDr. Nancy T. WelchVice President forStudent ServicesCynthia G. EasonVice President for Corporate &Economic DevelopmentSteven B. ValandVice President forEducationMarilyn K. HendrixAssociate Vice President forSatellite Campus OperationsJoel D. WelchAssociate Vice Presidentfor Administration8
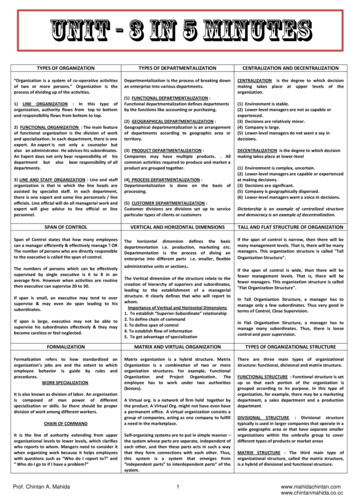
Section II – Organizational Profile2.13. Expenditures/Appropriations ChartAccountability Report Appropriations/Expenditures ChartBase Budget Expenditures and Appropriations: Greenville Technical College05-06 Actual Expenditures06-07 Estimated Expenditures07-08 Budgeted ExpendituresMajor BudgetCategoriesTotal FundsGeneralFundsTotal FundsGeneralFundsTotal FundsGeneralFundsPersonal Service 40,666,965 17,715,806 41,612,983 18,056,130 45,597,299 18,056,130Other Operating 13,529,516 0 14,637,550 0 13,954,178 0 7,380,005 0 7,720,765 0 6,752,918 0 474,761 0 174,332 0 859,410 0Special ItemsPermanentImprovementsCase ServicesDistributions toSubdivisions 0 0 0 0 0 0 0 0 0 0 0 0Fringe Benefits 9,513,668 3,364,827 9,945,606 4,144,850 10,784,345 4,144,850Non-recurring 4,036,409 0 7,522,945 0 1,508,255 0 75,601,324 21,080,633 81,614,181 22,200,980 79,456,405 22,200,980TotalOther ExpendituresSources of FundsFY 05-06 Actual ExpendituresFY 06-07 Actual Expenditures 554,511 291,047Supplemental BillsCapital Reserve FundsBonds - Deferred Maintenance9
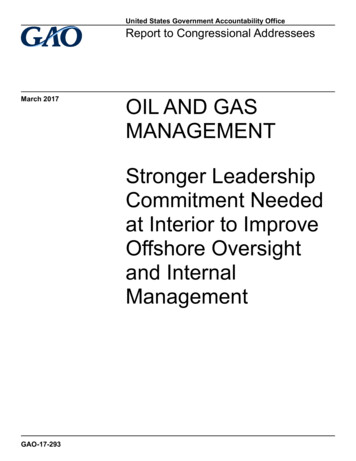
Section II – Organizational Profile2.14. Major Program Areas ChartAccountability Report Major Programs Areas Chart: Greenville Technical CollegeMajor Program AreasProgramNumberand TitleII. InstructionMajorProgram AreaPurpose(Brief)FY 05-06Budget ExpendituresState:FY 06-07Budget 00% of Total 85.006%% of Total ,042.00State:Federal:12%Federal:10%3,237,041.00% of Total otal:8,295,132.00Total:7,847,771.00% of Total ,303.00% of Total 0Other:% of Total Budget:VII. eral:% of Total Budget:VI.AdministrativeSupport% of Total Budget:State:Federal:% of Total Budget:V. PlantMaintenance46%3,646,958.00% of Total Budget:IV. StudentSupport13,627,278.00Federal:% of Total Budget:III. AcademicSupportKey CrossReferencesforFinancialResults*% of Total Budget:10%7%10
Section II – Organizational ProfileProgramNumberand TitleVIII. RestrictedOperationsMajorProgram AreaPurpose(Brief)FY 05-06Budget ExpendituresState:Federal:IX. CapitalExpendituresFY 06-07Budget .00Total:4,036,409.00Total:7,522,945.00% of Total Budget:5%% of Total ,832.00% of Total Budget:Key CrossReferencesforFinancialResults*2%% of Total Budget:9%3%*Key Cross-References are a link to the Category 7 - Organizational Performance Results. These References provide a Chart number that is included in the7th section of this document.11
Section III – Elements of Malcolm Baldrige CriteriaCategory 1 – Senior Leadership, Governance, and Social ResponsibilityIII. Elements of Malcolm Baldrige CriteriaCategory 1 – Senior Leadership, Governance, and Social ResponsibilitySenior Leadership: GTC embraces a learning approach to leadership where leadership teammanagement facilitates learning in others (staff and faculty) so that they can develop asprofessionals and peers, assume more collective responsibility relative to their work, engage ingroup planning and decision-making activities, as well as set
Sources: Greenville Technical College, 2006 Fact Book, August 2006 and State and County Quick Facts, US Census Bureau Population Greenville Tech Greenville County White (non-Hispanic) 68% 73.2% Black 23% 18.5% Hispanic 3% 5.7% Other 5% 2.9% FIGURE 2.2-2: STUDENT