Transcription
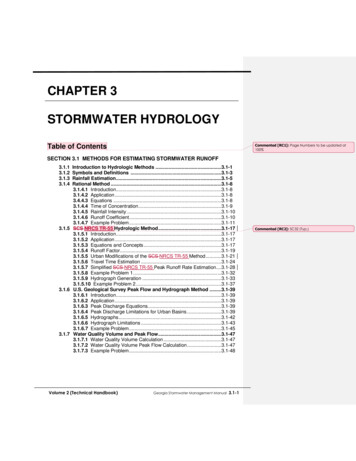
Chapter 8:Stormwater Management Design ExamplesThis chapter presents design examples for two hypothetical development sites in the State of New York.The first site, “Stone Hill Estates,” is a residential development near Ithaca. The second is a commercialsite in Albany. The chapter is divided into five sections, each of which focuses on a particular element ofstormwater management design. Section 8.1 provides an example of detailed hydrology calculations at the residential site. Section 8.2 presents a pond design example based on the hydrology calculated in Section 8.1. Thisdesign example demonstrates the hydrologic and hydraulic computations to achieve water quality andwater quantity control for stormwater management. Other specific dam design criteria such as soilcompaction, structural appurtenances, embankment drainage, outlet design, gates, reservoir drawdownrequirements, etc. are stated in Guidelines For Design of Dams. This design example in Section 8.2 requires an Article 15 Permit from NYS-DEC since the dam is 15feet high measured from the top of dam to the low elevation at the downstream outlet, and the storagemeasured behind the structure to the top of the dam is 2.2 MG. Sections 8.3 through 8.5 present design examples for three practices on the commercial site: a sandfilter, infiltration trench, and bioretention practice.Section 8.1Sizing Example - Stone Hill EstatesFollowing is a sizing example for the hypothetical “Stone Hill Estates,” a 45-acre residential developmentin Ithaca, New York (Figure 8.1). The site also drains approximately 20 acres of off-site drainage, whichis currently in a meadow condition. The site is on mostly C soils with some D soils.8-1
New York State Stormwater Management Design ManualChapter 8Figure 8.1 Stone Hill Site PlanDrainage Area Offsite Drainage Light Gray Fill/ HatchCNtc(hr)Hydrologic DataPrePost72780.460.35Ult.820.35Base DataLocation: Ithaca, NYSite Area 45.1 ac; Offsite Area 20.0 ac (meadow)Total Drainage Area (A) 65.1Measured Impervious Area 12.0 ac;8-2
New York State Stormwater Management Design ManualChapter 8Site Soils Types: 78% “C”, 22% “D”Offsite Soil Type: 100% “C”Zoning: Residential (½ acre lots)Hazard Class: Low “A”, Dam Size small per table #1 Appendix A.Computation of Preliminary Stormwater Storage Volumes and Peak DischargesThe layout of the Stone Hill subdivision is shown on the previous page.Water Quality Volume, WQv Compute Impervious CoverUse both on-site and off-site drainage:I 12.0 acres/65.1 acres 18.4% Compute Runoff Coefficient, RvRv 0.05 (I) (0.009)0.05 (18.4) (0.009) 0.22Compute WQv (Includes both on-site and off-site drainage)Use the 90% capture rule with 0.9” of rainfall. (From Figure 4.1)WQv (0.9”) (Rv) (A) (0.9”) (0.22) (65.1 ac) (1ft/12in) 1.07 ac-ftEstablish Hydrologic Input Parameters and Develop Site Hydrology (see Figures 8.2, 8.3, and 8.4)ConditionAreaCN 0.35Ultimate buildout*65.1820.35*Zoned land use in the drainage area.8-3
New York State Stormwater Management Design ManualChapter 8Hydrologic opedUltimate 72112NAQ100-yrcfs1412022278-4
New York State Stormwater Management Design ManualChapter 8Figure 8.2 Stone Hill Pre-Development Conditions8-5
New York State Stormwater Management Design ManualChapter 8Figure 8.3 Stone Hill Post-Development Conditions8-6
New York State Stormwater Management Design ManualChapter 8Figure 8.4 Stone Hill Ultimate Buildout Conditions8-7
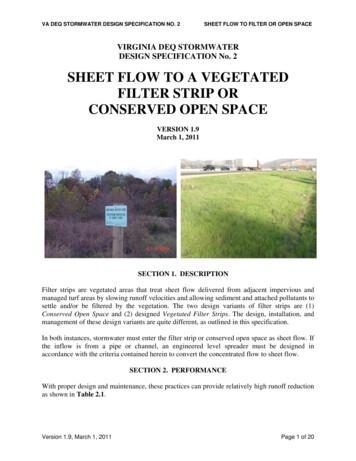
New York State Stormwater Management Design ManualChapter 8Compute Stream Channel Protection Volume, (Cpv) (see Section 4.3 and Appendix B)For stream channel protection, provide 24 hours of extended detention (T) for the one-year event.Compute Channel Protection Storage VolumeFirst, determine the value of the unit peak discharge (qu) using TR-55 and Type II Rainfall Distribution Initial abstraction (Ia) for CN of 78 is 0.564: [Ia (200/CN - 2)] Ia/P (0.564)/ 2.3 inches 0.245 Tc 0.35 hours Using the above data and Exhibit 4-II from TR-55 (NRCS, 1986), qu 570 csm/in (cubic feet persecond per square mile per year) Knowing qu and T 24 hours, find qo/qi using Figure 8.5 (also see methodology in Appendix B) Peak outflow discharge/peak inflow discharge (qo/qi) 0.035 Vs/Vr 0.683 - 1.43(qo/qi) 1.64(qo/qi) 2 - 0.804(qo/qi) 3 (from Appendix B)Where Vs equals channel protection storage (Cpv) and Vr equals the volume of runoff in inches.Figure 8.5 Detention Time vs. Discharge Ratios (Source: MDE, 2000)8-8
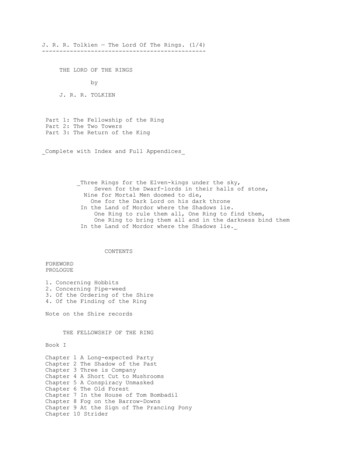
New York State Stormwater Management Design ManualChapter 8 Vs/Vr 0.63 and, from figure 8.3, Q 0.7” Solving for VsVs Cpv 0.63(0.7”)(1/12)(65.1 ac) 2.4 ac-ft (104,214 cubic feet)Define the Average Release Rate The above volume, 2.4 ac-ft, is to be released over 24 hours (2.4 ac-ft 43,560 ft2/ac) / (24 hrs 3,600 sec/hr) 1.2 cfsCompute Overbank Flood Protection Volume, (Qp10)(see Section 4.4)For both the overbank flood protection volume and the extreme flood protection volume, size is determinedusing the TR-55 “Short-Cut Method,” which relates the storage volume to the required reduction in peakflow and storm inflow volume (Figure 8.6). For a qi of of 112 cfs (post-developed), and an allowable qo of 72 cfs (pre-developed), the value of(qo)/(qi) is 0.64 Using figure 8.6, and a post-developed curve number of 78, Vs/Vr 0.23 Using a total storm runoff volume of 427,155 cubic feet (9.8 acre-feet), the required storage (Vs) is:Vs Qpv 0.23(427,155)/43,560 2.26 acre-feetWhile the TR-55 short-cut method reports to incorporate multiple stage structures, experience has shownthat an additional 10-15% storage is required when multiple levels of extended detention are providedinclusive with the 10-year storm. So, for preliminary sizing purposes add 15% to the required volume forthe 10-year storm. Qp-10 2.23 1.15 2.59 ac-ft.While the TR-55 short-cut method reports to incorporate multiple stage structures, experience has shownthat an additional 10-15% storage is required when multiple levels of extended detention are providedinclusive with the 10-year storm. So, for preliminary sizing purposes, add 15% to the required volume forthe 10-year storm. Qp-10 2.23 1.15 2.59 ac-ft.8-9
New York State Stormwater Management Design ManualChapter 8Figure 8.6 Approximate Detention Basin Routing for Rainfall Types I, IA, II, and IIISource: TR-55, 1986Compute Extreme Flood Protection Volume, (Qf)Extreme flood protection is calculated using the same methodology as overbank protection. For a Qin of, and an allowable Qout of, and a runoff volume of the Vs necessary for 100-year control is,under a developed CN of 78. Note that 5.5 inches of rain fall during this event, with approximately 3.1inches of runoff. While the TR-55 short-cut method reports to incorporate multiple stage structures, experience hasshown that an additional 10-15% storage is required when multiple levels of extended detention areprovided inclusive with the 100-year storm. So, for preliminary sizing purposes add 15% to therequired volume for the 100-year storm. Qf-100 3.53 1.15 4.06 ac-ft.Analyze Safe Passage of 100-Year Design Storm (Qf)If peak discharge control of the 100-year storm is not required, it is still necessary to provide safe passagefor the 100-year event under ultimate buildout conditions (Qult 227 cfs). See table 4-1 appendix A forlow and moderate hazard dam design storm.8-10
New York State Stormwater Management Design ManualChapter 8Section 8.2 Pond Design ExampleFollowing is a step-by-step design example for an extended detention pond (P-3) applied to Stone HillEstates, which is described in detail in Section 8.1 along with design treatment volumes. This examplecontinues with the design to develop actual design parameters for the constructed facility.Step 1. Compute preliminary runoff control volumes.The volume requirements were determined in Section 8.1. Table 8.1 provides a summary of the storagerequirements.Table 8.1. Summary of General Storage Requirements for Stone Hill EstatesVolume RequiredSymbolCategoryNotes(ac- ft)WQvWater Quality Volume1.07CpvStream Protection2.4QpQfPeak ControlFlood Control2.64.1Average ED release rate is 1.2 cfs over 24hours10-year, in this caseStep 2. Determine if the development site and conditions are appropriate for the use of a stormwater pond.The drainage area to the pond is 65.1 acres. Existing ground at the proposed pond outlet is 619 MSL. Soilboring observations reveal that the seasonally high water table is at elevation 618. The underlying soils areSC (sandy clay) and are suitable for earthen embankments and to support a wet pond without a liner. Thestream invert at the adjacent stream is at elevation 616.Step 2A. Determine Hazardous Class of Dam.The height of the dam, its maximum impoundment capacity, the physical characteristics of the dam site andthe effect that a failure of the dam would have upon human life, residences, buildings, roads, highways,utilities and other facilities should be assessed to determine whether a low (A), moderate (B) or high (C)hazard classification is appropriate for designing the dam. Refer to Section 3.0 of the "Guidelines for the8-11
New York State Stormwater Management Design ManualChapter 8Design of Dams" for additional information regarding hazard class and Table 1 of those guidelines for theappropriate hydrologic design criteria for new dams based on the assigned hazard class and size.Step 3. Confirm local design criteria and applicability.There are no additional requirements for this site.Step 4. Determine pretreatment volume.Size wet forebay to treat 10% of the WQv. (10%)(1.07 ac-ft) 0.1 ac-ft(forebay volume is included in WQv as part of permanent pool volume)Step 5. Determine permanent pool volume and ED volume.Size permanent pool volume to contain 50% of WQv:0.5 (1.07 ac-ft) 0.54 ac-ft. (includes 0.1 ac-ft of forebay volume)Size ED volume to contain 50% of WQv: 0.5 (1.07 ac-ft) 0.54 ac-ftNOTE:THIS DESIGN APPROACH ASSUMES THAT ALL OF THE ED VOLUME WILL BE IN THE PONDAT ONCE. WHILE THIS WILL NOT BE THE CASE, SINCE THERE IS A DISCHARGE DURINGTHE EARLY STAGES OF STORMS, THIS CONSERVATIVE APPROACH ALLOWS FOR EDCONTROL OVER A WIDER RANGE OF STORMS, NOT JUST THE TARGET RAINFALL.Step 6. Determine pond location and preliminary geometry. Conduct pond grading and determine storageavailable for WQv permanent pool and WQv-ED if applicable.This step involves initially grading the pond (establishing contours) and determining the elevation-storagerelationship for the pond. Storage must be provided for the permanent pool (including sediment forebay),extended detention (WQv-ED), Cpv-ED, 10-year storm, 100-year storm, plus sufficient additional storageto pass the ultimate condition 100-year storm with required freeboard. An elevation-storage table and curve8-12
New York State Stormwater Management Design ManualChapter 8is prepared using the average area method for computing volumes. See Figure 8.7 for pond location onsite, Figure 8.8 for grading and Figure 8.9 for Elevation-Storage Data.Figure 8.7 Pond Location on Site8-13
New York State Stormwater Management Design ManualChapter 8Figure 8.8 Plan View of Pond Grading (Not to Scale)8-14
New York State Stormwater Management Design ManualChapter 8Figure 8.9 Storage-Elevation Table/CurveElevation AreaMSLft 832510400138502185026350304755768560125Average Area Depth Volumeft 2ftft meft 3700261860320765Volume AbovePermanent 2.073.385.406.75Elevation [MSL-ft]Storage Above Permanent 27.0626.0625.00.01.02.03.04.05.06.07.0Storage [Ac-ft]Set basic elevations for pond structures The pond bottom is set at elevation 621.0 Provide gravity flow to allow for pond drain, set riser invert at 620.5 Set barrel outlet elevation at 620.08-15
New York State Stormwater Management Design ManualChapter 8Set water surface and other elevations Required permanent pool volume 50% of WQv 0.54 ac-ft. From the elevation-storage table, readelevation 625.0 (0.61 ac-ft 0.54 ac-ft) site can accommodate it and it allows a small safety factor forfine sediment accumulation – OKSet permanent pool wsel 625.0 Forebay volume provided in single pool with volume 0.1 ac-ft - OK Required extended detention volume (WQv-ED) 0.54 ac-ft. From the elevation-storage table (volumeabove permanent pool), read elevation 627.0 (0.56 ac-ft 0.54 ac-ft) OK. Set ED wsel 627.0Note:Total storage at elevation 627.0 1.17 ac-ft (greater than required WQv of 1.07 ac-ft)Compute the required WQv-ED orifice diameter to release 0.54 ac-ft over 24 hours Avg. ED release rate (0.54 ac-ft)(43,560 ft2/ac)/(24 hr)(3600 sec/hr) 0.27 cfs Invert of orifice set at wsel 625.0 Average head (627.0 - 625.0)/ 2 1.0' Use orifice equation to compute cross-sectional area and diameterQ CA(2gh)0.5, for Q 0.27 cfs h 1.0 ft; C 0.6 discharge coefficient. Solve for AA 0.27 cfs / [(0.6)((2)32.2 ft/s2)(1.0 ft))0.5] A 0.057 ft2, A πd2 / 4;dia. 0.26 ft 3.2", say 3.0 inchesUse 4" pipe with 4" gate valve to achieve equivalent diameterCompute the stage-discharge equation for the 3.0” dia. WQv orifice QWQv-ED CA(2gh)0.5 (0.6) (0.052 ft2) [((2)(32.2 ft/s2))0.5] (h0.5), QWQv-ED (0.25) h0.5, where: h wsel - 625.125Note:Account for one half of orifice diameter when calculating head)8-16
New York State Stormwater Management Design ManualChapter 8Step 7. Compute ED orifice size, and compute release rate for Cpv-ED control and establish Cpv elevation.Set the Cpv pool elevation Required Cpv storage 2.4 ac-ft (see Table 1). From the elevation-storage table, read elevation 630.6 (this includes the WQv). Set Cpv wsel 630.6Size Cpv orifice Size to release average of 1.2 cfs. Set invert of orifice at wsel 627.0 Average WQv-ED orifice release rate is 0.41 cfs, based on average head of 2.74’ ((630.6 – 625.125)/2) Cpv-ED orifice release 1.2 -0.41 0.79 cfs Head (630.6 - 627.0)/2 1.8'Use orifice equation to compute cross-sectional area and diameter Q CA(2gh)0.5, for h 1.8' A 0.79 cfs / [(0.6)((2)(32.2'/s2)(1.8'))0.5] A 0.12 ft2, A πd2 / 4; dia. 0.39 ft 4.7" Use 6" pipe with 6" gate valve to achieve equivalent diameterCompute the stage-discharge equation for the 4.7” dia. Cpv orifice QCpv-ED CA(2gh)0.5 (0.6) (0.12 ft2) [((2) (32.2'/s2))0.5] (h0.5), QCpv-ED (0.58) (h0.5), where: h wsel – 627.2NOTE:ACCOUNT FOR ONE HALF OF ORIFICE DIAMETER WHEN CALCULATING HEAD8-17
New York State Stormwater Management Design ManualChapter 8Step 8. Calculate Qp10 (10 year storm) release rate and water surface elevation.In order to calculate the 10 year release rate and water surface elevation, the designer must set up a stagestorage-discharge relationship for the control structure for each of the low flow release pipes (WQv-ED andCpv-ED) plus the 10 year storm.Develop basic data and information The 10 year pre-developed peak discharge 72 cfs, The post developed inflow 112 cfs, from Table 1, From previous estimate Qp-10 2.26 ac-ft. Adding 15% to account for ED storage yields a preliminaryvolume of 2.56 ac-ft. From elevation-storage table (Figure 8.9), read elevation 631.0. Size 10 year slot to release 72 cfs at elevation 631.0.@ wsel 631.0: WQv-ED orifice releases 0.61 cfs, Cpv-ED orifice releases 1.13 cfs, therefore; Allowable Qp-10 72 cfs - (.61 1.13) 70.26 cfs, say 70.3 cfs. Set weir crest elevation at wsel 630.6 Max head (631.0 – 630.6) 0.4’Use weir equation to compute slot length Q CLh3/2 L 70.3 cfs / (3.1) (0.43/2) 89.6 ft This weir length is impractical, so adjust max head (and therefore slot height) to 1.5’ and recalculateweir length. L 70.3 cfs / (3.1) (1.53/2) 12.3 ft8-18
New York State Stormwater Management Design Manual Chapter 8Use three 5ft x 1.5 ft slots for 10-year release (opening should be slightly larger than needed so as tohave the barrel control before slot goes from weir flow to orifice flow). Maximum Q (3.1)(15)(1.5)3/2 85.4 cfsCheck orifice equation using cross-sectional area of opening Q CA(2gh)0.5, for h 0.75’ (For orifice equation, h is from midpoint of slot) A 3 (5.0’) (1.5’) 22.5ft2 Q 0.6 (22.5ft2) [(64.4)(0.75)]0.5 93.8 cfs 85.4 cfs, so use weir equationQ10 (3.1) (15') h3/2 , Q10 (46.5) h3/2, where h wsel – 630.6 Size barrel to release approximately 70.3 cfs at elevation 632.1 (630.6 1.5) Check inlet condition: (use FHWA culvert charts)Hw 632.1-620.5 11.6 ft Try 27" diameter RCP, Using FHWA Chart (“Headwater Depth for Concrete Pipe Culverts with InletControl”) with entrance condition 1 Hw / D 11.6/2.25 5.15, Discharge 69 cfs Check outlet condition (use NRCS pipe flow equation from NEH Section 5 ES-42): Q a [(2gh)/(1 km kpL)]0.5where: Q discharge in cfsa pipe cross sectional area in ft2g acceleration of gravity in ft/sec2h head differential (wsel - downstream centerline of pipe or tailwater elev.)km coefficient of minor losses (use 1.0)kp pipe friction loss coef. ( 5087n2/d4/3, d in inches, n is Manning’s n)L pipe length in ft8-19
New York State Stormwater Management Design ManualChapter 8h 632.1 - (620.0 1.125) 10.98'for 27" RCP, approximately 70 feet long:Q 4.0 [(64.4) (10.98) / (1 1 (0.0106) (70))]0.5 64.2 cfs64.2 cfs 69 cfs, so barrel is outlet controlled and use outlet equationQ 19.4 (h)0.5, where h wsel – 621.125NOTE:PIPE WILL CONTROL FLOW BEFORE HIGH STAGE INLET REACHES MAX HEAD.Complete stage-storage-discharge summary (Figure 8.10) up to preliminary 10-year wsel (632.1) and route10 year post-developed condition inflow using computer software (e.g., TR-20). Pond routing computes10-year wsel at 632.5 with discharge 65.4 cfs 72 cfs, OK (see Figure 8.10).NOTE:ADEQUATE OUTFALL PROTECTION MUST BE PROVIDED IN THE FORM OF A RIPRAPCHANNEL, PLUNGE POOL, OR COMBINATION TO ENSURE NON-EROSIVE VELOCITIES.Figure 8.10 Stage-Storage-Discharge SummaryElevationMSLStorageac-ftLow FlowWQv-ED3.0" eq .550.580.610.660.680.69-Cpv-ED4.7" eq. 320.520.780.880.971.071.131.281.341.36-RiserHigh Stage 0.41.5-27" 14.5EmergencySpillway26' earthen 6.093.6164.6323.28-20
New York State Stormwater Management Design ManualChapter 8Step 9. Calculate spillway design flood release rate and water surface elevation (wsel), size emergencyspillway, calculate spillway design flood wsel.For a Hazard Class “A” dam, in order to calculate the 100-year release rate and water surface elevation, thedesigner must continue with the stage-storage-discharge relationship (Figure 8.10) for the control riser andemergency spillway.Develop basic data and information The 100 year pre-developed peak discharge 141 cfs, The post developed inflow 202 cfs, from Table 1, From previous estimate Qp-100 3.53 ac-ft. Adding 15% to account for ED storage yields a preliminaryvolume of 4.06 ac-ft. From elevation-storage table (Figure 8.10), read elevation 632.8, say 633.0.The 10-year wsel is at 632.5. Set the emergency spillway at elevation at 632.7 (this allows for someadditional storage above the 10-yr wsel) and use design information and criteria for Earth Spillways (notincluded in this manual). Size 100 year spillway to release 141 cfs at elevation 633.0. @ wsel 633.0: Outflow from riser structure is controlled by barrel (under outlet control), from Figure 8.10, read Q 67.6 cfs at wsel 633.3. Assume Q 67 cfs at wsel 633.0. Set spillway invert at wsel 632.7 Try 26' wide vegetated emergency spillway with 3:1 side slopes. Finalize stage-storage-discharge relationships and perform pond routingPond routing (TR-20) computes 100-year wsel at 633.76 with discharge 140.95 cfs 141 cfs, OK (seeFigure 8.11).8-21
New York State Stormwater Management Design ManualChapter 8NOTE:THIS PROCESS OF SIZING THE EMERGENCY SPILLWAY AND STORAGE VOLUMEDETERMINATION IS USUALLY ITERATIVE.THIS EXAMPLE REFLECTS PREVIOUSITERATIONS AT ARRIVING AT AN ACCEPTABLE DESIGN SOLUTION.Step 10. Check for safe passage of Qp100 under current build-out conditions and set top of embankmentelevation.The safety design of the pond embankment requires that the 100-year discharge, based on ultimate buildoutconditions be able to pass safely through the emergency spillway with sufficient freeboard (one foot). Thiscriteria does not mean that the ultimate buildout peak discharge be attenuated to pre-development rates.From previous hydrologic modeling we know that: The 100 year ultimate buildout peak discharge 227 cfs, The ultimate buildout composite curve number is 82.Using TR-20 or equivalent routing model, determine peak wsel. Pond routing computes 100-year wsel at634.0 with discharge 192 cfs (Figure 8.12).Therefore, with one foot of freeboard, the minimum embankment elevation is 635.0. Table 8.2 provides asummary of the storage, stage, and discharge relationships determined for this design example. See Figure8.13 for a schematic of the riser.8-22
Table 8.2 Summary of Controls ProvidedType/Size ofStorageControl ElementControlProvidedUnitsAcre-feetPermanent aysubmerged berm0.1625.00ExtendedDetention(WQv-ED)4" pipe, sized to3.0" pv-ED)6" pipe sized to4.7" -10)Extreme Storm(Qf-100)ExtremeStorm UltimateBuildoutThree 5’ x 1.5’slots on a 6’ x 6’riser, 27"barrel.26' wide earthspillway2.5632.565.4part of WQvincluded in permanentpool vol.part of WQV., vol.above perm. pool,discharge is averagerelease rate over 24hoursvolume above perm.pool, discharge isaverage release rateover 24 hoursvolume above perm.pool4.0633.8140.9volume above perm.poolNA634192.0Set minimumembankment height at635.026' wide earthspillway8-23
New York State Stormwater Management Design ManualChapter 8Figure 8.11 TR-20 Model Input and Output******************80-80 LIST OF INPUT DATA FOR TR-20 HYDROLOGY******************JOB TR-20FULLPRINTNOPLOTSTITLE New York Manual Wet ED Example 1/01EWBTITLE Post Developed Conditions Routing for 1, 10, and 1003 4.108633.393.604.708634.0165.05.408635.0352306.759 ENDTBL6 RUNOFF 1 1 2 0.10278.00.3511 0016 RESVOR 2 1 2 3 625.0111ENDATA7 INCREM 60.17 COMPUT 7 1 1 0.02.31.02 2 1 01ENDCMP 17 COMPUT 7 1 1 0.03.91.02 2 1 10ENDCMP 17 COMPUT 7 1 1 0.05.51.02 2 1 99ENDCMP 1ENDJOB 2*******************************END OF 80-80 LIST********************************8-24
New York State Stormwater Management Design ManualTR20 XEQ 1/22/**REV 09/01/83Chapter 8New York Manual Wet ED Example 1/01EWBPost Developed Conditions Routing for 1, 10, and 100JOB1SUMMARYPAGE8SUMMARY TABLE 1 - SELECTED RESULTS OF STANDARD AND EXECUTIVE CONTROL INSTRUCTIONS IN THE ORDER PERFORMED(A STAR(*) AFTER THE PEAK DISCHARGE TIME AND RATE (CFS) VALUES INDICATES A FLAT TOP HYDROGRAPHA QUESTION MARK(?) INDICATES A HYDROGRAPH WITH PEAK AS LAST DRAINAGEAREA(SQ MI)RAINTABLE#ANTEC MAINMOIST TIMECOND INCREM(HR)PRECIPITATION------------------------ BEGINAMOUNT DURATION(HR)(IN)(HR)RUNOFFAMOUNT(IN)PEAK DISCHARGE------------------------------------- ORM1STRUCTURE 1 RUNOFF.10STRUCTURE 1 RESVOR.102222.10.10.0.02.302.3024.0024.00.66.40-- 630.3112.1318.00?ALTERNATE1STORM10STRUCTURE 1 RUNOFF.10STRUCTURE 1 - M99STRUCTURE 1 RUNOFF.10STRUCTURE 1 - 8.215.68-25
New York State Stormwater Management Design ManualChapter 8Figure 8.12 TR-20 Model Input and Output for Ultimate Buildout ConditionsTR20 XEQ 1/22/**REV 09/01/83New York Manual Wet ED Example 1/01Ultimate Buildout Conditions for 100-yrEWBJOB1SUMMARYPAGE4SUMMARY TABLE 1 - SELECTED RESULTS OF STANDARD AND EXECUTIVE CONTROL INSTRUCTIONS IN THE ORDER PERFORMED(A STAR(*) AFTER THE PEAK DISCHARGE TIME AND RATE (CFS) VALUES INDICATES A FLAT TOP HYDROGRAPHA QUESTION MARK(?) INDICATES A HYDROGRAPH WITH PEAK AS LAST DRAINAGEAREA(SQ MI)ALTERNATE1STORM99STRUCTURE 1 RUNOFF.10STRUCTURE 1 RESVOR.10RAINTABLE#22ANTEC MAINMOIST TIMECOND ----- BEGINAMOUNT OUNT(IN)3.533.19PEAK DISCHARGE------------------------------------- ELEVATIONTIMERATERATE(FT)(HR)(CFS)(CSM)-- 634.0012.1012.22230.71191.832261.91880.78-26
Figure 8.13 Profile of Principle Spillway8-27
New York State Stormwater Management Design ManualChapter 8Section 8.3 Sand Filter Design ExampleThis design example focuses on the design of a sand filter for a 4.5-acre catchment of Lake Center, ahypothetical commercial site located in Albany, NY. A five-story office building and associated parkingare proposed within the catchment. The layout is shown in Figure 8.14. The catchment has 3.05 acres ofimpervious cover, resulting in 68% impervious cover. The pre-developed site is a mixture of forest andmeadow. On-site soils are predominantly HSG “B” soils.Figure 8.14 Lake Center Site Plan8-28
New York State Stormwater Management Design ManualChapter 8Hydrologic DataPrePostCNtc(hr)580.44830.10Base DataLocation: Albany, NYSite Area Total Drainage Area (A) 4.50 acImpervious Area 3.05 ac; or I 3.05/4.50 68%Soils Type “B”This step-by-step example will focus on meeting the water quality requirements. Channel protectioncontrol, overbank flood control, and extreme flood control are not addressed in this example. Therefore, adetailed hydrologic analysis is not presented. For an example of detailed sizing calculations, consult section8.1. In general, the primary function of sand filters is to provide water quality treatment and not large stormattenuation. As such, flows in excess of the water quality volume are typically routed to bypass the facility.For this example, the post-development 10-yr peak discharge is provided to appropriately size the necessaryby-pass flow splitter. Where quantity control is required, bypassed flows can be routed to conventionaldetention basins (or some other facility such as underground storage vaults).Step 1. Compute design volumes using the Unified Stormwater Sizing Criteria.Water Quality Volume, WQvSelect the Design StormConsulting Figure 4.1 of this document, use 1.0” as the 90% rainfall event for Albany.Compute Runoff Coefficient, RvRv 0.05 (68) (0.009) 0.66Compute WQvWQv (1.0”) (Rv) (A) / 12(1.0”) (0.66) (4.5 ac) (43,560ft2/ac) (1ft/12in)10,781 ft3 0.25 ac-ft8-29
New York State Stormwater Management Design ManualChapter 8Develop Site Hydrologic Input Parameters and Perform Preliminary Hydrologic Calculations (seeTable 8.3)NOTE:FOR THIS DESIGN EXAMPLE, THE 10-YEAR PEAK DISCHARGE IS GIVEN ANDWILL BE USED TO SIZE THE BYPASS FLOW SPLITTER.ANY HYDROLOGICMODELS USING SCS PROCEDURES, SUCH AS TR-20, HEC-HMS, OR HEC-1, CAN BEUSED TO PERFORM PRELIMINARY HYDROLOGIC CALCULATIONS.Table 8.3ConditionSite 7Q2cfs0.410Q10Q100cfscfs319936Step 2. Determine if the development site and conditions are appropriate for the use of a surface sand filter.Site Specific Data:Existing ground elevation at practice location is 222.0 feet, mean sea level. Soil boring observations revealthat the seasonally high water table is at 211.0 feet. Adjacent drainage channel invert is at 213.0 feet.Step 3. Compute available head, & peak discharge (Qwq). Determine available head (See Figure 8.15)The low point at the parking lot is 223.5. Subtract 2' to pass the Q10 discharge (221.5) and a half foot forthe inflow channel to the facility (221.0). The low point at the channel invert is 213.0. Set the outfallunderdrain pipe 1.0’ above the drainage channel invert and add 0.5’ to this value for the drain slope (214.5).Add to this value 8" for the gravel blanket over the underdrains, and 18" for the sand bed (216.67). Thetotal available head is 221.0 - 216.67 or 4.33 feet. Therefore, the available average depth (hf) 4.33' / 2 2.17'.8-30
New York State Stormwater Management Design ManualChapter 8Figure 8.15 Available Head Diagram Compute Peak Water Quality Discharge:The peak rate of discharge for the water quality design storm is needed for the sizing of off-line diversionstructures, such as sand filters and grass channels. The Small Storm Hydrology Method presented inAppendix B was followed to calculate a modified curve number and subsequent peak discharge associatedwith the 1.0-inch rainfall. Calculation steps are provided below.Compute modified CN for 1.0" rainfallP 1.0"Qa WQv area (10,781 ft3 4.5 ac 43,560 ft2/ac 12 in/ft) 0.66"CN 1000/[10 5P 10Qa-10(
stormwater management design. Section 8.1 provides an example of detailed hydrology calculations at the residential site. Section 8.2 presents a pond design example based on the hydrology calculated in Section 8.1. This design example demonstrates the hydrologi