Transcription
Using a RandomForest model topredict enrollmentWard HeadstromInstitutional ResearchHumboldt State UniversityCAIR 20131
OverviewForecasting enrollment to assist University planningThe R languageThe Random Forest modelBinary Logistic Regression modelCautions and Conclusions The example I am going to use is projecting New enrollment.These techniques can easily be applied to predicting Retention Graduation Other future events2
Simple enrollment projections1) how many student enrolled last year?2) enhance by breaking it down into subgroups3) possibly use linear regressions (trends)34) enhance further by looking at to-date information
42014 projection 2013 “to-date” yield * 2014 apps 1,369/3,692*4,361 1,617
5
But what about Why applicant yield might not be the best predictor: Admits more likely to enrollConfirms more likely to enrollDenied or withdrawn will not enrollHousing deposits may be good indicator of intentLocal applicants more likely than distant applicantsCertain majors or ethnicities may be more likely to enrollDo this year’s applicants look like last year’s? Ideally, we would like to use all the data we have aboutapplicants to predict how likely they are to enroll. Variables: demographics, academics, actions to-date Model 1: Random Forest Model 2: Binary logistic regression6
The language RCAIR comment: an emphasis on R would be “limiting toinstitutions that used other software”. The first (only?) implementation of Random Forest models R is open source – free to use http://cran.us.r-project.org/ http://www.rstudio.com/ide/download/desktop Many online tutorials: uts en.pdf /using-r-aguide-for-complete-beginners/ https://www.coursera.org/course/compdata www.researchgate.net/post/Which is better R or SPSS7
R and RStudio overview Function-based: function(data,options)Case-specific language4 panes – help, history, import dataset, packagesObject types: data.frame, vector, scalars, factor, modelsUseful commands: command line console can be used as calculatorassignment - or functions: na.omit(), summary(), table(), tolower()subsets: dataframe[row select, column select]graphics: hist(), plot()library() , especially library(randomForest)8
RStudio9
Data files All the data fields you think might help predict yields Major disciplineRegion of originSexEthnicityAcademic preparation Actions “to-date” Accepted SUG Confirmed intent to enroll Paid housing deposit Institutional actions Admit Deny/cancel10
Import data into R11
Decision Trees12
Random Forest Model Developed by Leo Brieman and Adele Cutler Plan: grow a random forest of 500 decision trees randomForest(cenreg variable1 variable2 ,data train) Randomly picks fields for each tree Randomly selects rows to exclude from each tree Measure of variable importance Out Of Box estimate of error rate and Confusion matrix Run new data through all 500 trees and let them vote13
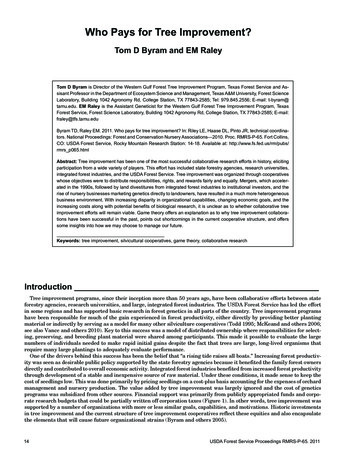
Random Forest model of applicant yield14
varImpPlot(rf)15
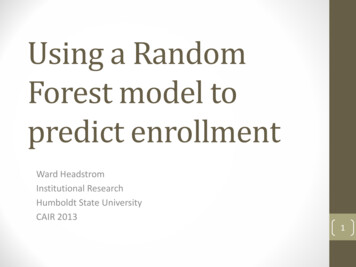
1st tree in Random ForestFor categorical predictors, the splitting point is represented by an integer, whosebinary expansion gives the identities of the categories that goes to left or right. Forexample, if a predictor has four categories, and the split point is 13. The binaryexpansion of 13 is (1, 0, 1, 1) (because 13 1*2 0 0*2 1 1*2 2 1*2 3), socases with categories 1, 3, or 4 in this predictor get sent to the left, and the rest tothe right.16
Testing and making a ProjectionfRandom Forest projects that 42% ofcurrent Spring apps will enroll, comparedto 45% of last year’s apps to-date and34% of training years’.17
Binary Logistic Regression p(x) is the probability that x will occur, where x is a binaryobject (Y/N, 1/0, true/false) log𝑝(𝑥)1 𝑝(𝑥) 𝐵0 𝐵1 𝑋1 𝐵2 𝑋2 𝐵3 𝑋3 𝐵𝑛 represents calculated coefficients𝑋𝑛 represents the value of dependent variablesBreak up factor variables into many terms where 𝑋𝑛 is 1 or 0Can manipulate the result to return the probability (between 0and 1) that x will occur, given the state of a particular set ofdependent variables. Difficult to predict outcome of a single individual Can sum probabilities to estimate total 18
Binary logistic regression model of applicant yield19
20
21
BLR model – testing and projectingBinary Logistic Regression predicted 324 of currentSpring applicants will enroll, compared to 340projected by Random Forest model.22
Cautions and Conclusions Null or new values in variables will cause problems Beware of to-date variables (e.g. intent td). Make surethat procedures have not changed in a way that willaffect behavior. R is a very powerful tool which can be very useful if youare willing to invest some time learning it. Multivariate models may improve the accuracy of yourpredictions. Corroborate with simple models andconsultation with involved staff.23
Questions? Comments?This mlMy email:Ward.Headstrom@humboldt.edu24
binary expansion gives the identities of the categories that goes to left or right. For example, if a predictor has four categories, and the split point is 13. The binary expansion of 13 is (1, 0, 1, 1) (because 13 1*2 0 0*2 1 1*2 2 1*2 3), so cases with categories 1, 3, or 4 in thi