Transcription
MathCAD TutorialBy Colorado State University Student:Minh Anh NguyenPower Electronic III1
The first time I heard about the MathCAD software is in my analog circuit design class.Dr. Gary Robison suggested that I should apply a new tool such as MathCAD or MatLab to solvethe design problem faster and cleaner. I decided to take his advice by trying to learn a new toolthat may help me to solve any design and homework problem faster. But the semester was overbefore I have a chance to learn and understand the MathCAD software. This semester I have achance to learn, understand and apply the MathCAD Tool to solve homework problem. Irealized that the MathCAD tool does help me to solve the homework faster and cleaner.Therefore, in this paper, I will try my very best to explain to you the concept of the MathCADtool. Here is the outline of the MathCAD tool that I will cover in this paper.1.What is the MathCAD tool/program?2.How to getting started Math cad3.What version of MathCAD should you use?4.How to open MathCAD file?a. How to set the equal sign or numeric operators- Perform summations, products, derivatives, integrals and Boolean operationsb. Write a equationc. Plot the graph, name and find point on the graphd. Variables and units- Handle real, imaginary, and complex numbers with or without associated units.e. Set the matrices and vectors- Manipulate arrays and perform various linear algebra operations, such as findingeigenvalues and eigenvectors, and looking up values in arrays.f. Do the differential equation solvers- Support ordinary differential equations; systems of differential equations, andboundary value problems both at the command line and in solve blocks that usenatural notation to specify the DiffEQs and constraints.g. Do Statistics and data analysis- Generate random numbers or histograms, fit data to built-in and generalfunctions, interpolate data, and build probability distribution models.5.Uses some home works solution to show how to used MathCAD.6.Compare the MathCAD result to Pspice and MatLab results.2
7.What Arithmetic toolbar?8.How to find Arithmetic toolbar?9.What is containing in Arithmetic tool bar?10.What is calculus toolbar?11.How to find calculus toolbar?12.What is containing in the calculus tool bar?13.What is automatic calculation?14.How to solving equation15.To evaluate power multiplication16.Substitution17.What is matrix toolbar?18.How to find the matrix toolbar?19.What the matrix toolbar contain?20.Simple keyboard practice21.Entering simple equation onto MathCAD page22.Range variablea. The rangeb. The array23.Graphics24.Multiple line graph25.How to evaluating mathematical expressions26.How to do integrals27.How to an equation with 2 variables28.Explain some preliminary remarks on matrices29.How to inserting images30.Operating key31.What is meaning of various equation32.Define a math region33.Define a text region34.Order of calculation35.Common problem encountered in MathCAD3
a. Multiplying a value of fractionb. Writing equation that are not to be solve (Boolean sign for equation that aren‟t tobe solve)c. Unwanted word wraps after web-page conversiond. Broken hyperlinks in web page.36.Intermediate MathCAD techniquesa. Subscriptsb. Aligning regionc. Push regions down as you typed. Hyperlink with in a MathCAD documents37.Creating vector using ranges variables.38.Creating 2-D array using range variable39.Generalizing to nonlinear relationship40.Generalizing end points of evenly spaced vector41.How to create/defining function42.How to defining variables43.How to defining an array of number (range variable/step variable)44.Symbolic manipulation45.Differential and partial differentiation46.What else can MathCAD do?47.Why use MathCAD tool?48.Conclusion49.ReferenceLearning to use MathCAD is much like learning a foreign language. As such, you willbecome a master by using the software on a regular basis and little will be gained by simplereading the MathCAD user manual. When I was first introduced to MathCAD, I was told, “that afew moments with an experienced user are more beneficial than the several pages of explanationfound in a tutorial.” In hindsight, I totally agree with this statement.MathCAD is a computer software program that allows you to enter and manipulatemathematical equations, perform calculations, analyze data, and plot data. This combination4
makes MathCAD an invaluable tool to physical chemists, engineer and who combine physicalscience with mathematics to describe chemical phenomena. MathCAD can present bothequation and numerical values in easy to read fashion. Math CAD uses a unique method tomanipulate formulas, numbers, test and graph. MathCAD is a unique powerful way to work withequations, number, text and graph.The version of MathCAD you use is depends on the type of computer you have and whatyou have available. However, Higher version may have some differences in how higherpowered features are performed. Check your manual for individual version different. AtColorado State University is provided a MathCAD 2001i professional version to all Engineeringstudents. This version is install in the ENS server. Therefore, on this paper I only focus on theMathCAD 2001i professional version.Here are two simple and easy ways to start MathCAD program:1. Load the MathCAD softwarea.s:\Application\MathCAD2001i\program files\MathSoft\\MathCAD2001iProfessional.b.Double click on mathcad.exec.Copy the MathCAD file by using a right mouse button drag and drop theMathCAD file and drop it into you u drive2. Start the MathCAD software by clicking on the engineering application group in windowand clicking on the MathCAD 2001i professional icon. After a few moments a blankworksheet should appear. The figure below is a blank worksheet.On your blank MathCAD worksheet, you will see a MathCAD toolbars or Math Palette.This Math palette contains all the subs toolbars or Math palette such as calculator or arithmetic,5
Graph, Vector and matrix, Calculus, Evaluation palette, Boolean Palette, Programming PaletteGreek Symbol Palette and Symbolic Keyword Palette. These toolbars are very helpful in theMathCAD calculation. If you don‟t see these toolbars on your bank worksheet, then on yourmenu select view and then select toolbar. Figure below is shown all the toolbars on theMathCAD blank worksheet.The MathCAD workspace is considerably different from most “spreadsheet style” dataanalysis program (like excel). Equations, data tables, graphs and descriptive text can all becombined in one MathCAD document, making this software particularly handy for application6
development. The MathCAD software will help you analyze the results of experiments, workhomework problem.When you want to set the variable range or do some simply calculation of yourhomework or design, click on the calculator or arithmeticbutton or from the menu selectview then toolbar and then calculator, this window will appear.You want to plot a graph, click on graphbutton or select view then select toolbarand then select graph from the menu. A graph window will open.If you click on Matrixbutton or select view then toolbar and then matrix from the menu,this window will open.When you click on calculusbutton or select view then toolbar and then calculus from themenu, this window will open.7
When you click on the Evaluation palettebutton or select view then toolbar and thenevaluation from the menu, this window will open.When you click on the Boolean Palettebutton or select view then toolbar and thenBoolean from the menu, this window will open.When you click on programming palettebutton or select view then toolbar and thenprogramming from the menu, this window will open.When you click on the Greek Symbol Palettebutton or select view then toolbar and thenGreek from the menu, this window will open.8
When you click on the Symbolic Keyword Palettebutton or select view then toolbar andthen symbolic from the menu, this window will open.If you don‟t like to use the mouse to click every button on the MathCAD worksheet.Here are some useful commands that you can apply:From your key board and toolbar:Definition: shift semi colon, : n Factorial: n shift 1,n!Mixed number: Ctrl shift ,Pi: ctrl shift pInline divided: ctrl /Raise power: shift 6Absolute value: shift \Square root: \9
Nth root: ctrl \Derivative: shift /Nth derivative: ctrl shift /Infinity: ctrl shift zDefinite integral: shift 7Summation: ctrl shift 4Iterated product: ctrl shift 3Indefinite integral: ctrl IRange variable summation: shift 4Range variable iterated product: shift 3Two-side limit: ctrl LLimit from above: ctrl shift ALimit from below: ctrl shift BX-Y plot: shift 2Polar plot: ctrl 7Surface plot: ctrl 2Contour plot, 3 D bar plot, 3D scatter: ctrl 5Equal to: ctrl Less than or equal to: ctrl 9Greater than or equal to: ctrl 0Not equal to: ctrl 3Not: ctrl shift 1And: ctrl shift 7Or: ctrl shift 6Exclusive or (XOR): ctrl shift 5A MathCAD worksheet can rapidly run into a confusing jumble of mathematicalgibberish, especially after several sequential expressions have been entered. For this reason, it iswise to annotate your worksheet with descriptive text. Entering text in a document is easy.Simply click on a blank region of the worksheet and start typing a sentence. For example, clickand type “ this is buck converter” As soon as you push the space bar after the word “this”,MathCAD shift into text mode. If you wish to edit text that has already been entered, simply10
click and highlight the text, go to the appropriate pull-down menu along the top of the MathCADwindow and you can adjust the front type, size, color and so on. The figure below is example ofentering text document into MathCAD.Text may be moved around in a worksheet in the following way. Move the mouse cursornear where you typed your sentences. Click and hold the left mouse and drag the mouse cursortowards your sentences; a dotted box will surround the text. Release the left mouse button. Movethe mouse cursor along the right edge of the dotted box, the cursor turns into a small hand. Whenthe cursor appears as a hand, click the left mouse button, hold it down, and drag the text block toits new location. From the menu, you can position the mouse cursor over the text and right clickthe mouse to activate the cut, copy and pate, ect. You can superscript/subscript text in this way.Variables are easily defined in MathCAD. If you want to set x equal to 10, then type “x:10”.When you type the colon symbol “:”, you will actually see “: ” on the screen. Or uses : buttonon the calculator. MathCAD interprets this symbol as “ set the variable to the left equal to thequantity on the right.” Here is the example of x 10.x10Now type “y:x 2#-7” (remember that the # symbol actually means to push the spacebar).This expression defines another variable (y) in terms of our original variable (x). Then type “y ”to see the numerical value of y (when x 10).11
Click on the previously type expressions “x:10” and edit it so that x equal to 20. Afterpressing enter, you should observe that MathCAD automatically re-evaluates the value of y.MathCAD evaluates expressions from top to bottom and from left to right on the automaticallyre-evaluate the rest of the worksheet. This is an extraordinarily powerful ability of MathCADthat you will soon appreciate.A range is special type of assignment equation. Instead of assigning a single value to x, weare assigning a whole set f values.Keyboard: typing a semicolon “;”x0 .5 2Create these tables: just type x , f (x) x00 .511 .52To evaluate a numerical answer for a definite integral, open the calculus toolbar and clickon the definite integral symbol. Clicking this produces an integral sign with placeholders for theupper and lower limits, the function, and the integration variable. Fill in these placeholders sothat you evaluate the following integral:2ex2d x 0.8820To defining an array of numbers (range variables), assign a range of values to a variable isstraightforward in MathCAD. For example, to create a variable x that runs from 0 to 512
1.Click to position the red crosshair in some free space2.Type x: 0; 53.After clicking away, you will seex0 5When you type the semicolon character „;‟ it display on the screen as 2 dots (.) followedby a placeholder. This is MathCAD‟s range variable operator.Another way to put the range variable operator in your worksheet is with the Rangevariable button.1.Matrix palette2.Click onUse a range variable as you would any other variable. Create a output table, by type x x012345Suppose you wanted to calculate the value of the function y 2x at several different valueof x. enter the following expression into your worksheet:Step 1:type “i:0; 9”produces:Step 2:type “x [i#: 2*i”Produces:Step 3:type “y [i#: 2*x [i# 2”Produces:i: 0.9x : 2*iyi: 2*(xi) 2Here are the steps how to set range variable in MathCAD13
Step 1: sets i equal to a range of integers (from 0 to 9). Notice how giving the originalnumber, pressing the semicolon and then giving the final number define the range. If you insteadwanted a range such as 0, 2,4 6,8,10, you would Type “i:0, 2; 10” where the 2 tells MathCAD tochange the value of i by steps of 2. The expression typed in step 1 de3fines what is sometimescalled a Range Variable of Step Variable. Step variable are often defined to contain a sequenceof integers so that it can be used to index the elements of other arrays, like the one defined instep 2.Step 2: define an array of numbers equal to times the index number (i.e. xo 0, x1 2,x3 4, ). Notice how the left bracket „[„ allow you to generate subscripts and pushing thespacebar returns you to a regular script.Step 3: works similar to step2 and defines a range of y values in terms of the range of xvalues. To see the range variables i, x, and y in their entirely, simply type “i ” an „y ‟,respectively.A matrix is a collection of mathematical elements, arranged in rows in columns. Theelements of a matrix can be simple numbers, or mathematical expressions. If you have evertaken linear algebra, then you know that matrices are powerful tools. The elements of matrix canbe simple numbers or mathematical expressions.Here are three examples of matrices:1.1A3.78.2B1 00 111.4cos ( x)C0101sin ( x) 110The first matrix, A, is a 4 1 matrix (contains 4 rows and 1 column of elements).Matrices B and C have dimensions of 2 2 and 3 3, respectively. Matrices that only contain onecolumn (like A) are often called vectors (or you may call them arrays).Here are the steps how to enter the matrixClick on 3 by 3 matrix icon in the vector and matrix paletteMenu: insert/matrix14
Keyboard: CTRL MChoose the number of rows and columnsFill in the placeholdersTo find the determinant:Keyboard: shift vertical bar “ ” orUse the button on the vector and matrix palette.To access a particular element of a vector:Use the subscript operator, typing a left square bracket “[“i0x1iixi01We will often use vectors and matrices to hold and manipulate experimental data.Suppose you perform an experiment, measuring the pressure of one mole of nitrogen gas at fourtemperatures, obtaining 1.2, 2.5, 3.6, and 4.7 atm at 50, 100, 150, and 200 Kelvin, respectively.Enter these data in a fresh MathCAD worksheet as follows; the Vector and Matrix Toolbar willassist you.15
1.2502.5pressuretemperature3.64.7Ni100150200rows ( pressure )0 N13.4211 0.0821 he first two expressions define vectors containing the pressure and temperature data.The next statement uses the MathCAD function rows () in order to determine the number of rowsin vector pressure, which is set equal to N. The value of N-1 defines the upper limit of a rangevariable i, which is used to index the elements of the pressure and temperature vectors in the laststatement. The last statement calculates the volume (in liters) according to the ideal gas law(V nRT/P), where n 1 mol and R 0.0821 atm L mol-1 K-1. This example from reference [2].Occasions will arise when an x-y data set will already exist, stored as a text document onthe hard-drive of your computer. How does one import this data into MathCAD for analysis?For example, the last CY351 experiment scheduled for this fall involves using a computerapparatus to measure the conductivity of a solution as a function of time. The raw data is storedas a file on the computer (the file consists of two columns of numbers; column one contains thetime data and column two the conductivity data). Let us suppose that the filename is calledsampledata.txt. The following MathCAD expressions allow you to import this data file, and thendefine vectors containing the x and y data:DATAREADPRN ( "sampledata.txt" )xDATA0yDATA1Imports the file "sampledata.txt" and setsit equal to the two column matrix DATA.The first column of the matrix DATA (containingthe x values) is set equal to an array x. Similarly,an array containing the y values is defined fromthe second column of matrix DATA.16
Data can also be exported from MathCAD by using the WRITEPRN (“filename”)command. This feature can be useful for exporting numerical data to other data analysisprograms like Excel. This example is from reference [3].Equations can be typed into document, just as they would appear in your textbook. Theseequations can be manipulated (rearranged, differentiated, integrated) with the click of the mouseand ultimately solved to yield a numerical answer. If you desire, you can plot the equation as afunction of one or more independent variables.Suppose you want to write an equation of current of a circuit on your blank worksheet.Click any where on blank worksheet and typing I:V/R, you will see on the MathCAD worksheetIVRMathCAD is capable of generating several different types of plots (x-y plots, bar graphs, 3Dplots, surface plots, .). We will concentrate here on simple x-y line plots.How do you do the plot y vs. x?Click on a blank place in the worksheet (below the expressions for x and y), then clickon the Graph Toolbar icon and select XY Plot or form the menu select insert and select X-Yplot. Figure below is shown how to plot a graph in MathCAD software.17
A blank graph should appear in the worksheet.Small black boxes should be located near the center of the left vertical axis and the lowerhorizontal axis. Click on the vertical axis box and type “y”. Click on the horizontal axis boxand type “x”. After pushing enters, a plot of y vs. x should appear. Plots are easily edited byclicking on the appropriate part of the graph. For example, clicking on the axis, clicking onthe upper limit value, and changing it can alter the upper limit on the vertical axis. Doubleclicking on the center of the plot brings up a window that allows you to adjust numerousparameters.Suppose you have a RLC circuit as shown below, you want to calculate and plotthe transfer function of this circuit by suing MathCAD software. First, you must set allvariable given values such as Vg, L, C, and R. Second, you must given the transfer functionof RLC circuit to the MathCAD software. Unlike Pspice program, MathCAD can‟tsimulation your circuit and give you a plot of the transfer function of your RLC circuit.Because MathCAD only a tool that help you to calculate and plot transfer function which youprovided the values and equation of your circuit to the program.18
To Plots the transfer function of this circuit in MathCAD software, here is how you do it19
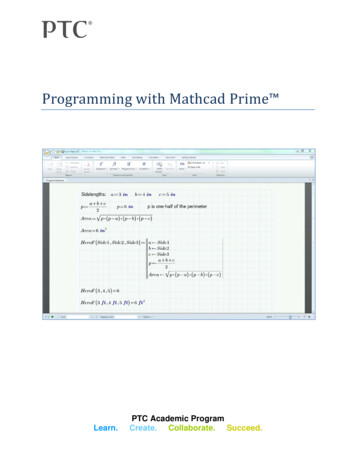
Set all variable that given in the circuit:Type Vg:5*V, on your mathcad worksheet you will seeVg5 VType fs:100*kHz, on your MathCAD worksheet you will seefs100 kHzType C:0.16* then click on th unit icon, then select the 'Capacitance' Then select microfarad. On yourworksheet you will see.C0.16L16FHRnominalZR1010j81Rnominal2Calculate the radian frequency of the RLC circuitTo get the omega symbol, click on the greek icon and click on omega symboltype 0 : 1 / \ and then L*C0106.255 -110 sL CCalculate the ouput resistor of the RLC circuit.Type Ro : \ and then L/CRoLCSet the range of the omega that where it start, next and end value, click on the greek icon and click onomega symboltype :100, 1000 ; 10*10 7, on your mathcad worksheet you will see7100 1000 10 10Type the equation of your transfer function, this function will give you a plot which depend on omega, soyou must put the omega sa a function of the transfer functionRHRj1LjC20
Below your transfer function, click on the graph icon and select X-Y plot. At the placeholderon x-axis type omega and y-axis type the transfer function of your circuit. Because thetransfer function has imaginary value, so you must take the absolute value of the functionotherwise you don‟t see any graph on your plot. Here is the graph of your transfer function.magnitude1transfer function for series resonant1H( )0.51.297 1040345678100 1 10 1 10 1 10 1 10 1 10 1 1081001 10Radian frequencyTo checks or compare your calculation/estimate solution of RLC series resonant invertercircuit. You can use the Pspice software tool to run simulation of your circuit. This can doneby simply design a RLC series resonant inverter circuit on the Pspice schematic, save and runsimulation of the circuit. The Pspice will give you a graph of the transfer function of yourcircuit. Figure below is the Pspice result of RLC series resonant inverter circuit.21
To plot the data point, on the horizontal axis must be an index variable into variablefunction or another vector with the same number of element. For Example:2368money spend1112.5i140 717money spend2i2068111 2.51417money spend3money spendi 1000510iiMathCAD can also be used to prepare multiple lines graph. Type the expression youwant to plot in the middle placeholders on the x and y-axis. Type expressions on the y-axis onlyand MathCAD will choose a default range for you automatically on x-axis. Enter severalexpression separated by a comma (,) in theses axes placeholders to see multiple tracesThe Placeholders is a small black box in a math region is a 'placeholder.' The placeholderindicates that the mathematical expression or plot is incomplete. To complete it, you need to putsomething appropriate in the placeholder. To fill the placeholder, click on it and begin typing.22
To Label and trace the graph. Double click on plot box, a window with several tabs will appearSelect TRACES. You will see a list of several tracesClick on the trace 1 which will be the first function of your plotClick on the arrow beside the colors on the bottom of the window and select one. Nowclick OKSelect label, you will see the window with title and Axis Labels.To see the title of your plot,on the title window, type the title of your plot and select show title. On your X-Axis typing thevariable of the function of your graph and y-axis labels the function of your graph.23
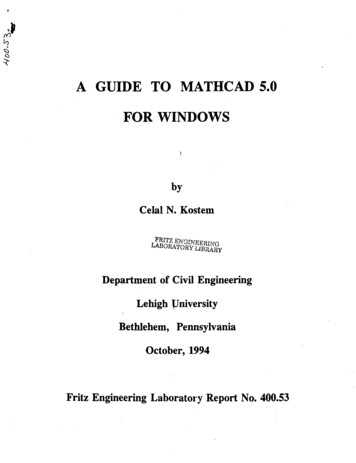
To find the point on your graph, on your plot box select show markers. Once you selectshow markers on either x or axis then your graph will appear 2 placeholders. Now click on theplaceholder and type the point you wish to find on the graph.Suppose you want to plot impedance output of the LLC inverter circuit as show below.Again define all given variable values of the LLC inverter circuit. Also define the range of thevariable of your function that you want to plot your graph. The most important is type theimpedance output equation of LLC circuit. The Steps below are shown how to plot the LLCinverter circuit and also shown how the multiple lines graph.3fs100 10C0.4 10Ls2.5 10Lp15 10nVg36662412
41 104.271 102 101ZizerojjLsC1Ziinfitejj( LsLp)Catan ( Zi0)9025.323idegatan ( Ziinf )908.222idegbode diagram10020 log Zizero( )o5020 log Ziinfite( )05041 1051 1061 101 10781 10radian frequency2phasemagnitude(dB)infarg( Zizero( ) )arg( Ziinfite( ) )0241 1051 1061 101 1071 108radian frequency25
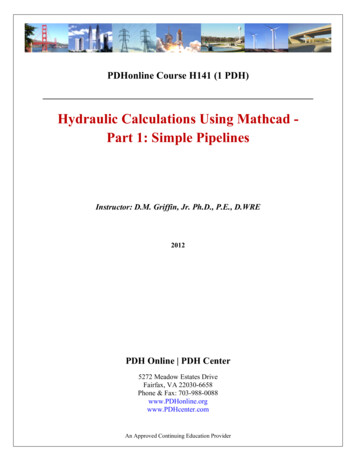
There is small problem with MathCAD software, which it might not able to plot thegraph in the degree. MathCAD can give calculation answer in degree but it only can plot fromPi to –Pi or radian value. This is one of the disadvantages of the MathCAD software over theMATLAB program. MATLAB can plot graph in the degree value. Figure below is result of theMATLAB plot. As you can see the curve and results of both MathCAD and MATLAB solutionare the same, however, the MATLAB show that the graph can go from –90 degree to 90 degreeand MathCAD show the graph in the radian values.MathCAD recognizes most of the common scientific units (i.e. units for energy, time,distance, volume, so forth.). While we can sometimes carry out MathCAD calculations withoutincluding the units, it will often be necessary (and useful) to include the units in yourcalculations. To accomplish this, you must be careful how you define the units when typing anexpression in a worksheet (MathCAD will only recognize the unit if you spell it correctly, or usethe appropriate abbreviation). To see the correct spelling and abbreviation of the unit names,you can go to the pull-down Insert menu and select Unit or from your toolbar clickicon.26
This opens a window in which the current system of units is identified and you can scrollthrough a menu to find the proper spelling/abbreviation.Before you begin, you must select a unit system (i.e. SI, mks, cgs, .). The default unitsystem is the SI system (this can be changed by going to the Math/Options menu). Recall thatthe SI system (and the mks system) utilizes the fundamental units meter (m), kilogram (kg),second (s), Kelvin (K), mole (mole), and so forth. All other units are defined in terms of thesefundamental units. For example, volume is defined in cubic meters (m3), energy (joule) isdefined in terms of kilograms, meters, and seconds, and pressure (Pa) is also related to somecombination of kilograms, meters, and seconds.To use the mks system, go to the Math/Options menu and change the unit system to mks.As a result, MathCAD will perform calculations and report answers in the following unitsFundamental Quantitymks unit (proper syntax to use in MathCAD)timeseconds (sec)masskilogram (kg)lengthmeter (m)temperatureKelvin (K)molemole (mole)chargecoulomb (coul)27
Derived Quantitymks unit (proper syntax to use in MathCAD)energyJoule (joule)volumecubic meter (m3)pressurePascal (Pa)After selecting the mks unit system, MathCAD will also recognize a number of othercommon chemical and physic units. However, MathCAD will not report answers in these unitsunless you ask.Additional unitsmks unit (proper syntax to use in MathCAD)pressureatmosphere (atm)Torr (torr)volumeLiter (liter)milliliters (mL)energyErgs (erg)International Calorie (cal)Kilocalorie (kcal)Suppose you want to area of the circle with the radius of 10000 meter. Then type radiusequal to 10 *km and type the equation to calculate the area of the circle. MathCAD calculatedthe area of the circuit and give the answer with the unit in meter squares as show below.r10 kmA ( r)A ( r)2r8 23.142 10 m28
If you want to calculate a circuit with carry out the electrical unit, then type a definevariable as normal but at the end of the value type multiply the unit of that suitable to the givenvariable in the circuit. For example: current has unit of ampere (A). Here is an example of howto include units when calculating the circuit. Enter the following expressions in a freshMathCAD worksheet; only define quantities in terms of fundamental SI units:I1AR10V( R )I RV( R )10 VNotice how the units are attached to the numerical value of each variable by using themultiplication symbol (*). The resultant voltage shown above is reported in units of VoltsOne of MathCAD‟s best features is the easy way in which it handles Symboliccalculation. MathCAD can add two functions and display the results. Symbolic equation cansolve equation one variable in MathCAD program. MathCAD that you want to perform asymbolic calculation, use the "live symbolic" operator -- which you can think of as the "symbolicequals" sign. Use the arrow on the Symbolic tool bar or hold down the control key and pressthe period key.To do the symbolic equation, following these steps–Ctrl , see a bold equal sign–Menu: Symbolic/Variable/Solve–Menu: symbolic/simplify/ expand or factors29
–Example:2f ( x)3x5x2g ( x)x12 x–––Type f (x) g (x) ctrl ., you will seef ( x)g( x)24 x3 x1If you want to do factors and displays the answer. You must use the symbolic key wordfactor along with the symbolic equals sign.2x9Example:2x9Typectrl . FactorYou will see22x9x9(x3) ( x3)30
The syntax used to define a function in MathCAD is the same way as you see intextbooks.–Type f (x) Shift ‟:‟x 2 see on screenf ( x)2x–Can include any of MathCAD's built in function Menu: insert/function Keyboard: Ctrl E Toolbar:Example:z2acos ( z)1.317iPrograms make it easy to do tasks that may be impossible or very inconvenient to do inany other way. This is because a program has many attributes associated with programminglanguages including conditional branching, looping constructs, local scoping of variables, error31
handling, and the ability to call itself recursively. A program is simply an expression made up ofmore than one statement (available in Mathad Professional only). If you click on the examplesbelow, you'll see how they look when written as a program rather than as a single expression.f ( x w)logxwDespite the equivalence between programs and simple expressions, programs offer two distinctadvantages:1. When you use control structures like loops and conditional branches, a program canbecome far more flexible than a simple expression could ever be.2. A program made of several simple steps is often much easier to create than an equivalent,but far more complicated expression draped with parentheses.Defining a program (MathCAD Professional only)To following steps illustrate how to define a the program1. Type the left side of a function definition followed by the assignment operator ":".2. Click on the Math toolbar to ope
MathCAD evaluates expressions from top to bottom and from left to right on the automatically re-evaluate the rest of the worksheet. This is an extraordinarily powerful ability of MathCAD that you will soon appreciate. A range is special type of assignment equation. Instead of assigning a