Transcription
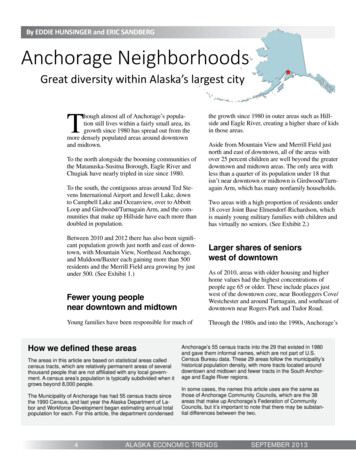
By EDDIE HUNSINGER and ERIC SANDBERGAnchorage NeighborhoodsGreat diversity within Alaska’s largest cityTthe growth since 1980 in outer areas such as Hillside and Eagle River, creating a higher share of kidsin those areas.To the north alongside the booming communities ofthe Matanuska-Susitna Borough, Eagle River andChugiak have nearly tripled in size since 1980.Aside from Mountain View and Merrill Field justnorth and east of downtown, all of the areas withover 25 percent children are well beyond the greaterdowntown and midtown areas. The only area withless than a quarter of its population under 18 thatisn’t near downtown or midtown is Girdwood/Turnagain Arm, which has many nonfamily households.hough almost all of Anchorage’s population still lives within a fairly small area, itsgrowth since 1980 has spread out from themore densely populated areas around downtownand midtown.To the south, the contiguous areas around Ted Stevens International Airport and Jewell Lake, downto Campbell Lake and Oceanview, over to AbbottLoop and Girdwood/Turnagain Arm, and the communities that make up Hillside have each more thandoubled in population.Between 2010 and 2012 there has also been significant population growth just north and east of downtown, with Mountain View, Northeast Anchorage,and Muldoon/Baxter each gaining more than 500residents and the Merrill Field area growing by justunder 500. (See Exhibit 1.)Two areas with a high proportion of residents under18 cover Joint Base Elmendorf-Richardson, whichis mainly young military families with children andhas virtually no seniors. (See Exhibit 2.)Larger shares of seniorswest of downtownFewer young peoplenear downtown and midtownAs of 2010, areas with older housing and higherhome values had the highest concentrations ofpeople age 65 or older. These include places justwest of the downtown core, near Bootleggers Cove/Westchester and around Turnagain, and southeast ofdowntown near Rogers Park and Tudor Road.Young families have been responsible for much ofThrough the 1980s and into the 1990s, Anchorage’sHow we defined these areasThe areas in this article are based on statistical areas calledcensus tracts, which are relatively permanent areas of severalthousand people that are not affiliated with any local government. A census area’s population is typically subdivided when itgrows beyond 8,000 people.The Municipality of Anchorage has had 55 census tracts sincethe 1990 Census, and last year the Alaska Department of Labor and Workforce Development began estimating annual totalpopulation for each. For this article, the department condensed4Anchorage’s 55 census tracts into the 29 that existed in 1980and gave them informal names, which are not part of U.S.Census Bureau data. These 29 areas follow the municipality’shistorical population density, with more tracts located arounddowntown and midtown and fewer tracts in the South Anchorage and Eagle River regions.In some cases, the names this article uses are the same asthose of Anchorage Community Councils, which are the 38areas that make up Anchorage’s Federation of CommunityCouncils, but it’s important to note that there may be substantial differences between the two.ALASKA ECONOMIC TRENDSSEPTEMBER 2013
ElmendorfFort RichardsonMerrill Field VicinityRogersPark/Tudor AreaArctic BlvdF i sh Cr ekUniversity/Airport Heightsrt Rational AirpoInterndMuldoon/BaxterTudor RdMidtownNorthwoodDeBarr RdRussianJackBoniface PkwyFireweedNorthern Lights BlvdLake Otis PkwyC Stster C r e e kCheEastSpenardTurnagain/ d AveBragaw StCordova StL StDowntownAnchorageCore9th AveWestBootleggers Cove/ FairviewWestchesterTurnagainGlenn HwyMountain ViewGovernment HillCampbell Park AreaDresotaMinnDowling RdArcticAbbott LoopAreaAirport/Jewel LakeAbbott RdDimond BlvdCampbell rGirdwood/Turnagain ArmNotes: These areas are based on census tracts and groups of census tracts that make up the Municipality of Anchorage. The names are not official, and are notpart of U.S. Census Bureau data.The areas should not be confused with Anchorage Community Councils.Source: Alaska Department of Labor and Workforce Development, Research and Analysis SectionSEPTEMBER 2013ALASKA ECONOMIC TRENDS5
1Populations of Anchorage Areas1980 to 2012CensusApril 6CensusApril ,360CensusApril 822,091CensusApril 3452,570EstimateJuly 7442,657EstimateJuly 36732,298AreaChugiakEagle RiverFort RichardsonElmendorf AFBGovernment HillMountain ViewNortheast AnchorageRussian JackMerrill Field VicinityWest FairviewDowntown Anchorage CoreBootleggers Cove/WestchesterTurnagainFireweedRogers Park/Tudor AreaUniversity/Airport HeightsMuldoon/BaxterCampbell Park AreaMidtownSpenardWoodland Park/SpenardEast Turnagain/Fish CreekAirport/Jewell LakeNorthwoodArcticAbbott Loop AreaCampbell Lake/OceanviewHillsideGirdwood/Turnagain ArmNotes: These areas are based on census tracts and groups of census tracts that make up the Municipality of Anchorage. The names arenot official, and are not part of U.S. Census Bureau data. The areas should not be confused with Anchorage Community Councils.Sources: U.S. Census Bureau; and Alaska Department of Labor and Workforce Development, Research and Analysis Sectionsenior population was clearly centered in the downtown core, and people aged 65-plus made up a tinypart of the population far beyond it.Anchorage’s senior population is spreading out,though, as residents beyond downtown age. Although the areas with the largest shares of seniorsare still near downtown, senior populations are increasing in South Anchorage areas in particular.percent. (See Exhibit 2.)Though the white population is the largest singlerace group in each of the areas, five of the areas areless than 50 percent white: Mountain View, MerrillField Vicinity, Russian Jack, Midtown, and Spenard. The Mountain View area in particular standsout — a University of Alaska professor recentlynoted it was the most racially diverse census tract inthe entire United States, based on a technical diversity index.Increasing racial diversityAnchorage has become more racially diverseover the past few decades. In 1980, just 15 percent of the municipality’s population was nonwhite, but as of 2010 that number was up to 346Asians and Pacific Islanders especially have gainedpopulation in Anchorage in recent years. They werejust 2 percent of the city in 1980, and by 2010 theyhad grown to over 10 percent. The two largest singleAsian ancestries in Anchorage are Filipino and Ko-ALASKA ECONOMIC TRENDSSEPTEMBER 2013
2Demographic Characteristics of Anchorage Areas2010 CensusAgeRace18 to 64Under18WhiteAlaska Native/Amer. Indian65 ChugiakEagle RiverFort RichardsonElmendorf AFBGovernment HillMountain ViewNortheast AnchorageRussian JackMerrill Field VicinityWest FairviewDowntown Anchorage CoreBootleggers Cove/WestchesterTurnagainFireweedRogers Park/Tudor AreaUniversity/Airport HeightsMuldoon/BaxterCampbell Park AreaMidtownSpenardWoodland Park/SpenardEast Turnagain/Fish CreekAirport/Jewell LakeNorthwoodArcticAbbott Loop AreaCampbell Lake/OceanviewHillsideGirdwood/Turnagain 66%26%8%EthnicityAsianHawaiian/Pac. IslanderOther2 RacesBlackHispanic(any ces: U.S. Census Bureau, 2010 Census; and Alaska Department of Labor and Workforce Development, Research and Analysis Sectionrean. People of Samoan descent make up well overhalf of Anchorage’s Pacific Islander population.Alaska Natives are also a growing share of Anchorage, and in 2010 about 8 percent of Anchorageresidents were Alaska Native alone. Adding thosewho reported they were Alaska Native in combination with another race puts the 2010 share at over12 percent. In 1980, Alaska Natives were less than5 percent of the municipality.As the state’s major population center, Anchoragehas significant populations of all the major Alaska Native groups — Athabascan, Aleut, Inupiat,Tlingit, Haida, Tsimshian, and Yupik — and it ishome to more Alaska Natives than any other cityin the nation.SEPTEMBER 2013Incomes lower in younger areasAs with any large city, Anchorage neighborhoodsshow significant differences in income. The city’soverall median household income was approximately 75,000 at the release of the 2007-2011American Community Survey, meaning half ofhouseholds’ incomes were above 75,000 and halfwere below.Looking at median household incomes by thehouseholder’s age reveals pronounced variation.For householders under age 25, median income wasaround 45,000. Between ages 25 and 44 it wasaround 75,000, and it was approximately 90,000for those between 45 and 64. For residents 65 andolder, median income was roughly 50,000.ALASKA ECONOMIC TRENDS7
3Income and Poverty Levels by Anchorage Area2007 to 2011ChugiakEagle RiverFort RichardsonElmendorf AFBGovernment HillMountain ViewNortheast AnchorageRussian JackMerrill Field VicinityWest FairviewDowntown Anchorage CoreBootleggers Cove/WestchesterTurnagainFireweedRogers Park/Tudor AreaUniversity/Airport HeightsMuldoon/BaxterCampbell Park AreaMidtownSpenardWoodland Park/SpenardEast Turnagain/Fish CreekAirport/Jewell LakeNorthwoodArcticAbbott Loop AreaCampbell Lake/OceanviewHillsideGirdwood/Turnagain ArmHouseholds with Income Households with Income Households with IncomeAbove 50,000Above 75,000Above 100,00077% ( /-10)60% ( /-8)45% ( /-7)82% ( /-6)68% ( /-6)49% ( /-5)57% ( /-11)24% ( /-7)11% ( /-5)58% ( /-14)28% ( /-10)15% ( /-8)39% ( /-16)13% ( /-13)10% ( /-13)31% ( /-9)11% ( /-7)3% ( /-5)58% ( /-7)40% ( /-6)20% ( /-4)49% ( /-7)29% ( /-5)16% ( /-4)44% ( /-8)25% ( /-7)12% ( /-6)40% ( /-11)21% ( /-8)10% ( /-5)55% ( /-22)25% ( /-14)20% ( /-13)74% ( /-13)62% ( /-12)43% ( /-9)83% ( /-15)66% ( /-13)53% ( /-12)40% ( /-10)25% ( /-8)14% ( /-5)75% ( /-13)59% ( /-11)41% ( /-9)76% ( /-10)49% ( /-8)28% ( /-6)73% ( /-6)53% ( /-5)36% ( /-4)63% ( /-8)43% ( /-6)25% ( /-5)42% ( /-10)21% ( /-8)12% ( /-5)45% ( /-13)23% ( /-10)10% ( /-7)53% ( /-11)26% ( /-7)12% ( /-5)72% ( /-9)48% ( /-7)33% ( /-6)69% ( /-7)53% ( /-6)39% ( /-5)75% ( /-14)52% ( /-12)31% ( /-9)77% ( /-9)56% ( /-8)39% ( /-7)81% ( /-7)61% ( /-6)40% ( /-5)78% ( /-7)59% ( /-6)41% ( /-5)84% ( /-5)75% ( /-5)61% ( /-4)63% ( /-18)44% ( /-15)29% ( /-12)Population BelowPoverty Level2% ( /-1)3% ( /-2)5% ( /-3)7% ( /-4)8% ( /-5)26% ( /-8)14% ( /-4)20% ( /-5)18% ( /-5)20% ( /-9)20% ( /-18)2% ( /-1)5% ( /-3)11% ( /-6)8% ( /-8)7% ( /-3)9% ( /-2)8% ( /-3)21% ( /-7)12% ( /-6)12% ( /-6)5% ( /-2)7% ( /-3)9% ( /-4)7% ( /-3)4% ( /-2)4% ( /-1)3% ( /-1)8% ( /-5)Anchorage69% ( /-2)50% ( /-1)34% ( /-1)8% ( /-1)Alaska65% ( /-1)46% ( /-1)31% ( /-1)10% ( /-0)Notes: Incomes are in 2011 inflation-adjusted dollars.Poverty thresholds are set by the U.S. Census Bureau and vary by family size and composition.Margins of error are given in parentheses.Sources: U.S. Census Bureau, 2007-2011 American Community Survey; and Alaska Department of Labor and Workforce Development, Researchand Analysis SectionIn eight of the 29 areas, more than half of households brought in less than 50,000 per year. Mostof these areas are north and east of the downtowncore, and just south in areas including Midtown andSpenard. (See Exhibit 3.)More than one in five people in the areas coveringMountain View, Russian Jack, Downtown and WestFairview, and Midtown were living below the poverty level. Factors linked to lower incomes and evenhigher poverty in certain areas include the relativeaffordability of housing, educational attainment,and age distribution.8High income in Hillside, TurnagainTwo far-apart areas with distinct histories standout for high incomes, with more than half ofhouseholds bringing in 100,000 or more per year.These two areas are Turnagain, the older neighborhood west of downtown, and Hillside, the largeSouth Anchorage area that covers many smallercommunities.Commutes are fairly shortThe average commute to work for Anchorage resi-ALASKA ECONOMIC TRENDSSEPTEMBER 2013
45Housing and OccupancyAnchorage areas, 2007 to 2011TotalHousing Units3,961 ( /-150)8,576 ( /-167)1,919 ( /-117)1,475 ( /-106)1,019 ( /-62)2,464 ( /-146)6,384 ( /-186)4,582 ( /-151)3,288 ( /-111)2,248 ( /-86)494 ( /-17)2,116 ( /-99)1,331 ( /-36)2,629 ( /-121)2,162 ( /-51)3,066 ( /-92)9,197 ( /-194)4,394 ( /-118)1,710 ( /-108)1,592 ( /-71)1,960 ( /-58)3,470 ( /-80)7,663 ( /-155)1,333 ( /-37)4,430 ( /-130)5,830 ( /-112)9,684 ( /-143)12,252 ( /-123)1,575 ( /-79)OccupiedHousing Units91% ( /-3)97% ( /-2)94% ( /-2)91% ( /-5)98% ( /-4)90% ( /-5)92% ( /-3)92% ( /-3)94% ( /-3)85% ( /-7)81% ( /-13)88% ( /-6)97% ( /-3)89% ( /-3)96% ( /-5)93% ( /-3)96% ( /-2)95% ( /-2)93% ( /-4)89% ( /-6)86% ( /-7)93% ( /-3)96% ( /-2)85% ( /-7)95% ( /-2)97% ( /-2)94% ( /-2)94% ( /-2)62% ( /-8)Anchorage112,804 ( /-338)92% ( /-1)Alaska304,373 ( /-160)83% ( /-0)ChugiakEagle RiverFort RichardsonElmendorf AFBGovernment HillMountain ViewNortheast AnchorageRussian JackMerrill Field VicinityWest FairviewDowntown Anchorage CoreBootleggers Cove/WestchesterTurnagainFireweedRogers Park/Tudor AreaUniversity/Airport HeightsMuldoon/BaxterCampbell Park AreaMidtownSpenardWoodland Park/SpenardEast Turnagain/Fish CreekAirport/Jewell LakeNorthwoodArcticAbbott Loop AreaCampbell Lake/OceanviewHillsideGirdwood/Turnagain ArmNote: Margins of error are given in parentheses.Sources: U.S. Census Bureau, 2007-2011 American Community Survey; and Alaska Department of Labor and Workforce Development,Research and Analysis Sectiondents is fairly brief, at around 18 minutes accordingto 2007-2011 American Community Survey data.The Fairbanks North Star Borough and the state asa whole both have average commutes of around 18minutes as well. For comparison, Seattle commutetimes average 25 minutes, and Los Angeles averages 29 minutes.Across the tracts that make up Anchorage, average commute times don’t differ much, with a rangeof roughly 10 to 20 minutes. The exception is thenorthern part of the municipality covering EagleRiver and Chugiak, where the average drive time —often to work in the Anchorage bowl — is around30 minutes, comparable to the Matanuska-SusitnaSEPTEMBER 2013Owner Occupancy by AreaAnchorage, 20077 to 2011TurnagainHillsideEagle RiverCampbell Lake/OceanviewAbboƩ Loop AreaChugiakMuldoon/BaxterRogers Park/TudorNorthwoodUniversity/Airport HeightsAirport/Jewell LakeGirdwood/Turnagain ArmAlaska ƌĐƟĐAnchorageEast Turnagain/Fish CreekBootleggers Cove/WestchesterNortheast AnchorageRussian JackCampbell ParkWoodland Park/SpenardMerrill FieldSpenardDowntown Anchorage CoreMidtownFireweedWest FairviewGovernment HillMountain View20% 40% 60% 80% 100%Note: Joint Base Elmendorf-Richardson has no privately owned land, soits owner occupancy is fixed at zero.Sources: U.S. Census Bureau, American Community Survey 20072011; and Alaska Department of Labor and Workforce Development,Research and Analysis SectionBorough’s average. The longer commute is reflected in the time people leave for work, which is by7:30 a.m. for most Eagle River and Chugiak workers and by 8:00 a.m. for the majority of Anchorageas a whole.Mostly high occupancy ratesHousing occupancy is generally high across Anchorage, with only the Girdwood/Turnagain Armarea having a low occupancy rate by Census Bureau definitions. It’s important to note that Girdwood/Turnagain Arm includes many seasonal andvacation homes, which the Census Bureau countsas vacant.ALASKA ECONOMIC TRENDS9
6Also, though the downtown core stands out as having relatively low occupancy, the uncertainty forthat estimate is very large, as shown by its marginof error. (See Exhibit 4.)Median Monthly Housing CostsBy Anchorage area, 2007 to 2011HillsideEagle RiverCampbell Lk/OceanviewTurnagain ďďŽƩ ŽŽƉ ƌĞĂChugiakAirport/Jewell Lake ƌĐƟĐMuldoon/BaxterBootleggers CoveUniversity/Apt HeightsAnchorageNorthwoodEast Turnagain/Fish CrkRogers Park/Tudor AreaNortheast AnchorageAlaskaCampbell Park AreaRussian JackGirdwood/Turnagain ArmWoodland Park/SpenardMidtownWest FairviewFireweedMerrill Field VicinityDowntown CoreMountain ViewSpenardGovernment HillOwner occupancy varies greatly across Anchorage, from more 80 percent in Turnagain, Hillside, and Eagle River to less than 20 percent inMountain View and Government Hill, where mosthomes are rented. (See Exhibit 5.) Land coveredby Joint Base Elmendorf-Richardson has no privately owned residences, so its owner occupancyis fixed at zero.Housing costs highestin Hillside and Eagle River 0 500 1,000 1,500 2,000Note: This analysis excludes areas covering Joint Base Elmendorf-Richardson.Sources: U.S. Census Bureau, 2007-2011 American Community Survey; and AlaskaDepartment of Labor and Workforce Development, Research and Analysis Section7The median monthly cost of housing varies byabout 1,000 across all Anchorage areas, with thehighest costs in Hillside and Eagle River at morethan 1,900 per month and the lowest in Spenardand Government Hill at 800 to 900.Decades Homes Were BuiltBy Anchorage areaChugiakEagle RiverFort RichardsonElmendorf AFBGovernment HillMountain ViewNortheast AnchorageRussian JackMerrill Field VicinityWest FairviewDowntown Anchorage CoreBootleggers Cove/WestchesterTurnagainFireweedRogers Park/Tudor AreaUniversity/Airport HeightsMuldoon/BaxterCampbell Park AreaMidtownSpenardWoodland Park/SpenardEast Turnagain/Fish CreekAirport/Jewell LakeNorthwoodArcticAbbott Loop AreaCampbell Lake/OceanviewHillsideGirdwood/Turnagain ArmAnchorage0%1949 or earlier1950 to 19591960 to 19691970 to 19791980 to 19891990 to 19992000 or later10%20%30%40%50%60%70%80%90%100%Sources: U.S. Census Bureau, 2007-2011 American Community Survey; and Alaska Department of Labor and Workforce Development,Research and Analysis Section10ALASKA ECONOMIC TRENDSSEPTEMBER 2013
Though Hillside already tops the list, within thatarea are smaller tracts with median monthly housing costs as high as 2,500. (See Exhibit 6.)Age of homes reflects historyLooking at the years homes were built reflects thehistory of the Anchorage bowl’s development. Almost all of the existing housing built before 1950 isaround downtown, particularly in Government Hill,Bootleggers Cove/Westchester, and the downtowncore. The areas covering Spenard, Woodland Park,and Turnagain each grew the most in the 1950s and1960s. (See Exhibit 7.)In the 1970s, building peaked in East Anchorage,including Mountain View and the Merrill Field vicinity, and picked up in places farther out includingHillside and Eagle River. Eagle River/Chugiak andHillside construction finally hit their zenith in the1980s.The neighboring Mat-Su Borough has seen ahousing boom since 1990, but there have been nosweeping changes in Anchorage housing since then,aside from construction on the base. There’s nodoubt that Anchorage’s population and socioeconomic conditions will continue to change, and thatthose changes will be reflected in the makeup of thecity’s neighborhoods.SEPTEMBER 2013ALASKA ECONOMIC TRENDS11
6 ALASKA ECONOMIC TRENDS SEPTEMBER 2013 Populations of Anchorage Areas 1 1980 to 2012 Area Census April 1980 Census April 1990 Census April 2000 Census