Transcription
Los Angeles CountyCommunity Health Profile ProjectUCLA Clinical Translational Science Institute (CTSI)Data Sub-Committee One-Year ReportVersion: June 27, 2013David Zingmond, MD, PhDAssociate Professor of Medicine in Residence, Division of General Internal Medicine and HealthServices Research, UCLA Department of MedicineAmi M. Shah, MPHHealth Policy Research Associate, UCLA Center for Health Policy ResearchE. Richard Brown, PhD (deceased)Professor, Department of Health Policy and Management, UCLA Fielding School of Public HealthGerald Kominski, PhDProfessor, Department of Health Policy and Management, UCLA Fielding School of Public HealthDirector, UCLA Center for Health Policy Research
EXECUTIVE SUMMARYLocal health data have the potential to inspire communities and inform investigators, whichcollectively can drive change toward improved health in Los Angeles County (LAC). This reportdetails results of initial efforts by the UCLA CTSI Community Engagement Research Program(CERP)’s Health Services Data Subcommittee to engage with communities and identify and quantifydisease prevalence and health care utilization, along with associated social determinants of health.Using data from the UCLA-based California Health Interview Survey (CHIS) and state collectedhospital discharge and emergency department encounter data from the Office of State HealthPlanning and Development (OSHPD), investigators of the data subcommittee crafted geographicdescriptions of health outcomes at the county health district level (Figure 1, page 2) and sharedthese outcomes with various community collaborators in the first year of the project. An initial setof indicators served as a starting point for dialogue with the communities about a proposed analysisplan.Overall, there were four main categories of community collaborators with whom we engaged.These were health clinics and systems, community-based organizations, academic-communitypartnerships, and the health department. Eleven presentations were made to these groups duringyear one of this project.Community involvement followed a process of recruitment and engagement. Areas within thehealth districts were first identified based on knowledge of and relationships with specificneighborhoods and ethnic enclaves. Community collaborators were approached based on currentresearch relationships with UCLA investigators (e.g., the 70 Block Project, Magnolia PlaceCommunity Initiative) and other groups associated with the CTSI UCLA CERP. Communitystakeholders and leaders from these areas were invited to participate via phone, email and inperson to provide feedback on presentation materials and proposed analysis plans. We alsoreached out to colleagues at the LAC Department of Public Health (DPH) Division of Chronic Diseaseand Injury Prevention and the LAC DPH Office of Assessment and those involved in preparingcommunity health needs assessments (CHNAS) because of their need for local health data.More specifically, community feedback included the need for more granular data estimates thatrepresent unique neighborhoods in which these groups are working, along with newly proposedmeasures of health (e.g., fast food environment and cardiovascular disease risk). Additional datasources on the food environment and park space availability were also examined in response tocommunity needs.Results of about 6 months of back and forth community engagement efforts helped to reshape andrefine the data analyses plans. A final list of indicators along with a new set of geographic areas andneighborhoods were developed for future analysis, along with newly developed relationships tocontinue the translation of health data. The net impact of engaging with communities is thei
inclusion of a community perspective on health needs when shaping the analysis plan, newcommunity collaborations, guidance to CTSI researchers and partners, and re-evaluation andfollow-up over the course of the CTSI engagement.The analytic portions of this work resulted in the creation of profiles of health and health careoutcomes covering the six core areas, plus related risk behaviors of the UCLA CTSI consortiummapped to the 26 health districts (HDs), which comprise of the 8 Service Planning Areas (SPAs) inLos Angeles County (Figure 1, page 2).For the overall hospital-centered care outcomes based on discharge data, the highest rates ofpreventable hospitalizations are clustered in the central and southern portions of the county (SPAs4 and 6), plus a separate region, the Antelope Valley (SPA1); while the lowest rates cluster in thecoastal health districts and the most eastern inland valley communities of the county.Self-reported health behaviors and disease prevalence derived from the CHIS sometimes differ fromthe hospital-centered care measures. Some areas of high hospital-centered care also reported highprevalence of disease in CHIS. However, in other areas, high hospital-centered care was observedwith low prevalence of disease in CHIS. Disease prevalence measures have far less variation thanthat seen in the hospital care measures and do not follow the same consistent patterns.Examining the hospital-centered care outcomes in relation to population level disease prevalenceand risk factors provide important context to the descriptive health status of each LAC district. It ispossible that individuals living in certain health districts may have better access to health care andchronic disease management, reflected by average or relatively high overall disease prevalence,coupled with lower hospital utilization. For example, Glendale has the third highest asthmaprevalence (17%) but is ranked as having an average overall preventable asthma hospitalization rate(195 per 100,000). Other districts have disproportionately greater disease severity (based on highrates of hospital-utilization for a given condition) and comparably high disease prevalence in thepopulation. For example, the Southwest district has one of the top five diabetes prevalence andpreventable hospitalization rates in LAC. Finally, there are some districts where disease prevalenceis reported as very low, while hospital-centered care measures are high. The data in this case couldreflect a lack of awareness of the underlying illness among individuals living in these areas andpresents a noteworthy opportunity to examine whether improved access to quality ambulatorycare would improve health.Taken together, results of the community engagement and analytic portions create a roadmap formoving forward. Plans include:ii
Further focus estimates for community partners to more granular regions (e. g. , cities,neighborhoods) defined by zip code or census tracts as the most granular level of dataavailable (see Appendix C for map of proposed neighborhoods) Use results to engage community partners in areas where awareness of a health conditionappears to be low, but hospital-centered care is high Implications of health care reform and expanded coverage of insurance on possible increasein diagnosis of health conditions and/or changes in rates of preventable hospitalizations Explore dynamic (interactive) mapping of estimates that could be linked to local resourceavailability Supplement area use estimates with mortality estimates from the state death master file Supplement area use estimates with cancer incidence rates from the state cancer registry Report back to community collaborators to share, interpret, and translate findings intomeaningful solutions to address health concernsAs part of these early stages of the UCLA CTSI, this LAC Community Health Profile project reportresponds to the critically important need to assess and identify the communities that could mostbenefit from UCLA’s innovation and research, and where key synergies could be formed with theCTSI. The results of this community collaborative process will ensure that the information aboutinequities in health, along with possible roadmap of solutions on how to improve matters, will reachthose communities that are most affected and are the very people who can drive dramatic andsustainable change.iii
TABLE OF CONTENTSINTRODUCTION . pages 1-2DATA FINDINGS . pages 3-12DISCUSSION . pages 13-14POLICY IMPLICATIONS, RECOMMENDATIONS, AND FUTURE DIRECTIONS . page 15APPENDICES .pages 16-43ACKNOWLEDGEMENTSThe UCLA Clinical Translational Science Institute’s Health Services Research Data Subcommittee ofthe Community Engagement Research Program (CERP) acknowledges this project as the brainchildof Dr. Rick Brown, a passionate advocate for evidence-based policies and programs. He envisionedthe synthesis of various data sources at the local level as an opportunity to inform the UCLA CTSIand drive real sustainable change for those communities in Los Angeles County that need it most.We also acknowledge Sitaram Vangala, M.S., Senior Statistician, Department of Medicine StatisticsCore, David Geffen School of Medicine at UCLA who analyzed the hospital discharge data andcalculated the Agency for Healthcare Research and Quality (AHRQ) Prevention Quality Indicators,Inpatient Quality Indicators and additional quality measures under the direction and leadership ofDr. David Zingmond. Hongjian Yu, Ph.D., Director of Statistical Support at the UCLA Center forHealth Policy Research, and his colleagues Yueyan Wang, Ph.D., Statistician, and Melanie Levy, M.S.,Assistant Statistician, produced the small area estimates from the California Health InterviewSurvey (CHIS) for the 26 Los Angeles County health districts. In addition, we recognize the time andeffort put forth by Héctor Alcalá, Ph.D. candidate, and Diane Tan, Ph.D. candidate and UCLA CTSIfellow, who helped prepare data tables and maps for this report. None of this work would havebeen possible without support from the UCLA CTSI.SUGGESTED CITATIOND Zingmond, AM Shah, ER Brown, GM Kominski. Los Angeles County Community Health Profile Project(Data Sub-Committee One-Year Report). Los Angeles, CA: UCLA Center for Health Policy Research,Department of Medicine and Clinical Translational Sciences Institute, April 2013.
INTRODUCTIONThe UCLA Clinical Translational Science Institute (CTSI) Health Services Research DataSubcommittee, as part of the Community Engagement Research Program (CERP), engaged withcommunity collaborators to assemble local data for the purpose of improving health in Los AngelesCounty (LAC).We engaged with communities to analyze and examine health survey and hospital discharge dataand identified variations in health and hospital-centered care outcomes for LAC health districts. TheData Subcommittee consulted with various community stakeholders including representatives fromhealth clinics and systems, community-based organizations, academic-community partnerships andthe health department to identify measures of health that would serve as valuable evidence toshape community plans, health initiatives, local health policies and the evaluation of programs.Feedback received from this collaborative process informed the final list and definition ofindicators and refined the data analyses designed to quantify the health status of and illustrategeographic variation among LAC health districts. The syntheses of these data, as summarized inthis Los Angeles County Community Health Profile, illustrate the burden of disease andpreventable hospitalizations for six clinical domains of the CTSI (diabetes/obesity, cardiovascularand cerebrovascular disease, cancer, addiction, mental health, and HIV). Results of this initialexploratory phase of the project (supported by one-year of CTSI funding) address the followingproposed project aims:1. Engage with community stakeholders in an iterative process to inform and refine data analysisplans to produce health data that are relevant and meaningful to community-basedimprovement efforts2. Develop an analysis plan based on community engagement efforts outlined in Aim 1 toexamine population health and healthcare3. Develop an analysis plan based on community engagement efforts outlined in Aim 1 to examinedisease-specific preventable hospitalizations and emergency department (ED) encounters4. Produce a report that incorporates the profile of LAC communities, with focused analyses ofkey geographic areas engaged in per Aim 1The evidence outlined in this Los Angeles County Community Health Profile may serve as anempirical guide for investigators, community providers, policy makers and other stakeholders to:(1) identify culturally tailored and community driven solutions for the specific population healthand healthcare needs identified; (2) recommend evidence-based solutions on how to meet theseneeds; and (3) direct greater resources to those communities most in need.Preliminary findings have already begun to inform the work of CTSI investigators and communitycollaborators while enabling the Data Subcommittee to build relationships with additionalcommunity partners. This level of engagement has enhanced our analyses and we anticipate will1
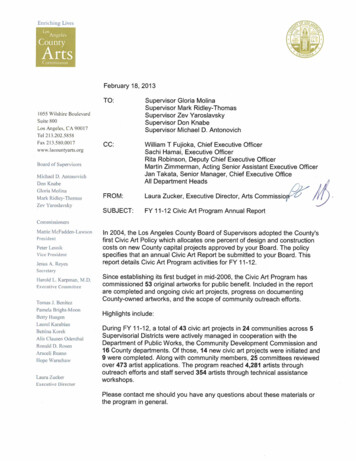
mobilize community stakeholders in all of the health districts, with support from the UCLA CTSI,to begin discussions on how to address high rates of preventable hospitalizations and poorpopulation health, while shaping CTSI’s strategies on how to move toward improved health andhealth care in LAC.Figure 1. Map of Los Angeles County Service Planning Areas and Health Districts2
DATA FINDINGSThis section provides a brief description of the data tables and maps produced for this report. First,we summarize the general demographic and socioeconomic characteristics of the 26 healthdistricts, and then we describe hospital-utilization rates and disease prevalence estimates profilingthe districts based on the CTSI core measures, when available.Measures of disease prevalence and hospital utilization (based on definitions of preventablehospitalizations) are included for the following conditions: diabetes; hypertension; coronary heartfailure and related heart attacks and chest pain; heart disease and cardiovascular disease risk;procedures to treat ischemic heart disease; pulmonary diseases – including asthma and COPD(chronic obstructive pulmonary disease); acute mental illness and serious psychological distress;and a summary measure ranking all chronic disease related hospitalizations. In addition, measuresof cancer screening and mortality and obesity and sedentary behavior along with structuralmeasures of the built environment are included. Definitions of all measures and the methodsemployed to produce these final outcomes are detailed in Appendix B, page 25-42.Tables and maps are also presented within this section to highlight selected findings and illustratethose districts with the greatest hospital-case for ambulatory care sensitive conditions (ACSCs) anddisease prevalence. Data are presented in relative terms to show differences across health districtsand ranked for certain outcomes. It is our intention that these data help inform CTSI investigatorsand community collaborators and to encourage further exploration of where, why and how theremay be opportunities to intervene, and ultimately improve patient outcomes and community health.DATA SOURCES AND METHODSDisease prevalence estimates are modeled based on the 2009 California Health Interview Survey(CHIS), which is a state-wide random digit-dial telephone survey. Most measures come from askingwhether a respondent reported ever having been diagnosed with a particular condition (e.g., “Haveyou ever been told by a doctor that you have diabetes?”). For a list of all the CHIS constructs anddetails small area estimation procedures employed see Appendix B.Hospital utilization is defined by the Agency for Healthcare Research and Quality (AHRQ)’sprevention quality indicators (PQIs) and inpatient quality indicators (IQIs). PQIs are a set ofmeasures that identify conditions for which good outpatient care or early intervention can preventcomplications or more severe disease and potential hospitalizations. IQIs are a set of measures thatreflect the quality of care inside hospitals and utilization of procedures that may be associated withlower mortality. Counts of hospital admissions and ER encounters were produced and PQIs and IQIswere calculated as rates per 100,000 based on data from Office of Statewide Health Planning andDevelopment (OSHPD) for the 26 LAC health districts. For more details on the measures producedand methods employed, see Appendix B.3
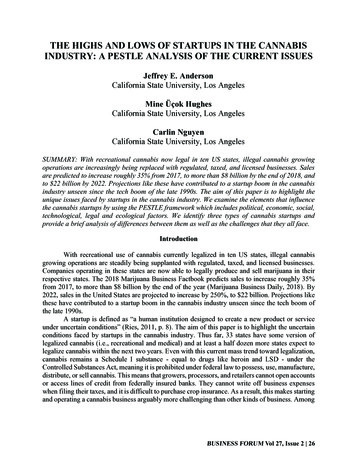
General characteristicsTables B2a and B2b (in Appendix B) present some general characteristics of Los Angeles County(page 30-31). More than 15% of adults in 12 out of 26 of the health districts (HDs) are age 65 andover. Alhambra and Harbor have the highest proportion of older adults and Southeast and Comptonhave the lowest. The proportion of low-income adults (under 100% FPL) ranges from 7% in Torranceto 39% in Southeast. In 9 of the 26 HDs, less than ¾ of adults (age 25 and over) have a high schooleducation. The lowest estimated percentage of adults with a high school education is 37%(Southeast) and 48% (South). HDs with the highest proportion of adults with limited Englishproficiency (LEP) are Southeast (48%), Central (44%), San Antonio (43%), and East LA (42%),followed by Northeast, El Monte, and Alhambra (38%).LAC is a diverse region with a majority-minority demographic breakdown. Non-Hispanic Whitesform the majority of residents (West and Glendale) in only two health districts (HDs) and constituteless than 10% of residents in seven HDs (Table B2). In five of these HDs, Compton, East LA, South,Southeast, and Southwest, less than 5% of the residents are non-Hispanic Whites. In 16 of the 26HDs, Hispanic individuals are at least 40% of the population in the respective districts. In five HDs,Hispanic individuals are at least 70% of the population in the HDs. The lowest estimated percentageof Hispanic individuals is 14% (West) and the highest is 89% (East LA).Uninsured estimates were defined by adults age 18-64 that were uninsured at any point in the pastyear. The uninsured estimates ranged from 16% (West) to 64% (Southeast), with a median of 29%uninsured. Five HDs have rates greater than 40% (San Antonio, East LA, Central, South, andSoutheast) and another five HDs have rates lower than 20% (West, Torrance, Harbor, San Fernando,and Foothill). Despite the wide range, there is a high overall rate of uninsurance, where one in everythree people is uninsured in LAC (Appendix Table B2b, page 31).Diabetes related preventable hospitalizations and prevalenceWe examined the four AHRQ-defined diabetes measures – short-term complications, long-termcomplications, uncontrolled diabetes, and diabetic lower extremity amputation. Overall, the healthdistricts with the highest total rates for these measures geographically cluster together in SPA 6 –South, Compton, Southwest, Southeast, and part of SPA 8 - Inglewood (Figure 2, page 5). Total ratestrack each of the four individual diabetes measures. The West health district has rates 1/5 of thosein South (88 v. 432 per 100,000), which is the district with the highest rates of preventable inpatienthospitalizations due to diabetes and related conditions (Appendix Table B3, page 32). These werecompared to CHIS estimates of diabetes prevalence by health district (Appendix Table B3). Thehighest reported prevalence was estimated in the South HD (33%) versus the lowest in the GlendaleHD (3%).4
Health districts with the highest rates of hospitalizations for diabetes for the most part also haverelatively high diabetes prevalence and those with low rates of hospitalizations have relatively lowdisease prevalence. For instance, South and Southwest HDs also have some of the highest diseaseprevalence estimates (33% and 15%, respectively). However, for Southeast, where we see one ofthe highest rates of hospitalizations (358 per 100,000), there is relatively low-to-moderate diseaseprevalence (7%) – see Appendix Table B3, page 32.Figure 2. Inpatient Hospitalizations Due To Uncontrolled, Short and Long-Term DiabetesComplications And Lower Extremity Amputations In Los Angeles County Health DistrictsInpatient hospitalizations(rate per 100,000)5
Hypertension – prevalence and related hospitalizationsHypertension-derived hospital encounters were broken out between ED encounters not leading tohospitalization, admissions, and total encounters (ED encounters plus admissions). Admissionsreflect hypertensive-related complications (hypertension, hypertensive emergency, hypertensionplus heart failure, hypertension plus renal failure), while ED encounters are qualitatively different(AHRQ PQI#7). By far the highest rates of admissions and overall encounters are clustered indistricts that are located primarily in SPA 6, South LA (Southwest, South, Compton, Inglewood, andSoutheast), occurring roughly four times more often than the lowest overall encounters in West,Hollywood and the eastern region of the county (SPA 3), see Appendix Table B4 (page 33). Thispattern of hospital-utilization is similar to that of the preventable hospitalizations due to diabetesdescribed earlier.In contrast, prevalence rates vary from a reported low of 14% in Southeast to 52% in South(Appendix B, Table B4). Because of the high reported rate of hypertension prevalence, South HDactually appears closer to the median in terms of the proportion of hospitalizations relative todisease prevalence when compared to the districts with high overall rates of hypertension-relatedhospital care (e. g., Southeast district). Interestingly, Glendale, which has low disease prevalence,has a high burden of hospitalizations (3rd most, see Appendix Table B4, page 33). Table 1 belowsummarizes these findings.Table 1. Los Angeles County Health Districts with the best and worst hypertension relatedhospital outcomes and their corresponding hypertension disease prevalenceHEALTH thillHollywood-WilshireAlhambraEl MonteWestHOSPITAL ADMISSIONS AND ERENCOUNTERSTop 5 districts (rates/100,000)418411363340311Bottom 5 districts E%3452312814%3627283025Source: OSHPD 2007-2009 average rates, see appendix table B4 for data on additional districts and CaliforniaHealth Interview Survey 2009 small area estimates6
Cardiac Disease – estimated prevalence, occurrence and treatment of ischemic heart disease, andheart failure related hospitalizationsOccurrence of ischemic heart disease hospitalizations contrasts between rates of acute illness(acute myocardial infarction (AMI) and angina (chest pain)) and procedures to treat ischemic heartdisease (bypass surgery and coronary angioplasty). On the one hand, rates of hospitalization per100,000 population for acute heart attacks are highest in Whittier, Antelope Valley, and Glendaleand lowest in Southeast and West, see Appendix table B5 (page 34) for details.Common surgical procedures to treat ischemic heart disease include CABG (coronary artery bypassgraft) and PCI (percutaneous coronary intervention). Rates of these cardiac procedures tend tooccur in areas where acute rates of ischemic heart disease are highest. Table 2 below presents thetop five health districts with the highest rates of AMI and cardiac procedures, compared to theaverage for LAC. Areas with highest procedure rates also include areas with the highest rates ofAMI, e. g., Whittier, Antelope Valley, and Glendale. However, there are some areas where acuterates of ischemic heart disease do not have the highest rates of cardiac procedures. For example,the Southwest district has the lowest receipt of cardiac procedures, but is actually fourth in terms ofrate of AMI. See Appendix Table B6 (page 35) for details.Table 2. Top five Los Angeles County Health Districts with the highest rates of acute myocardialinfarction (AMI) and associated rates of cardiac procedures, including CABG (coronary arterybypass graft) and PCI (percutaneous coronary intervention)Los Angeles CountyWhittierAntelope ValleyGlendaleSouthwestEast LAAMI (heart attack)Rates per 100,000155235228198168165Cardiac procedureRates per 100,000466565626735349458Source: OSHPD 2007-2009 average rates, see Appendix Table B6 (page 35) or data on additional districts.Heart-related disease prevalence and hospitalizations cannot be directly combined due to theinexact definition of heart disease in the CHIS, but are most closely tracked by answering questionsregarding “ever had heart disease” (not otherwise defined) or via a composite measure of two ormore ischemic heart disease risk factors (hypertension, diabetes, smoking, obesity or low physicalactivity). The highest rates of heart disease reported by CHIS occur in Whittier, Long Beach, andHarbor HDs while the lowest rates occur in the East LA, South, and Inglewood HDs. This is to becontrasted with the composite risk factor measure, which is highest in the South HD (50%) andlowest in Pasadena (14%) and Glendale (11%) HD (Appendix Table B7, page 36).7
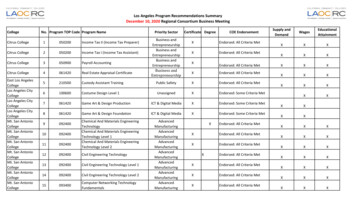
Cardiac heart failure is qualitatively different than these other heart disease related measures. Thehighest rates of hospitalizations for heart failure are clustered in the southern HDs of the county,comprised of SPAs 6 and 8 (Southwest, South, Compton, Inglewood, Bellflower, Southeast, LongBeach, and Harbor), while the West and Hollywood HDs have the lowest (Appendix Table B5).Pulmonary disease –asthma and COPD- related preventable hospitalizations and prevalenceAsthma occurrence differs compared to other health measures since air quality may differthroughout the county. The highest rates of asthma-related hospital encounters (admissions plusED visits) occur in the South HD (578 per 100,000) and in the Antelope Valley HD (557 per 100,000),while the lowest occurs in the West (135 per 100,000) (Appendix Table B8, page 37).Figure 3. Current asthma prevalence in Los Angeles County Health Districtsamong young adults age 18-448
Current asthma prevalence is defined as individuals who report that they were ever diagnosed withasthma and has asthma now; OR ever diagnosed with asthma and had an asthma attack/episode inthe last year. Interestingly, per CHIS estimates, rates of current asthma prevalence are highest inthe South HD (41%) and lowest in the Southeast HD (1%), which are in the area, SPA6 (Figure 3,page 8). Other high rates of asthma prevalence were observed in Antelope Valley (19%) andGlendale (17%) (Appendix Table B8, page 37).When one considers the proportion of asthma visits divided by asthma prevalence, the number ofhospital visits (inpatient and ED encounters) for asthma is not disproportionately greater in theSouth and Antelope HDs. However, the Southeast, Southwest, and East LA districts, which have thelowest asthma prevalence rates ( 2%), have the highest burden of preventable hospital-care forasthma. Hospital encounters for COPD in older adult populations (45 years old) are roughly evenlydivided between ED visits and actual hospital admissions. Of note, the southern cluster of HDs(mostly in SPA 6), with the exception of Antelope Valley, accounts for most of the areas with thegreatest rates of preventable hospital visits, which consistently demonstrates high rates of disease(Appendix Table B9, page 38).Acute mental health- related hospitalizations and severe psychological distress prevalenceAdmissions with a primary psychiatric diagnosis generally follow a pattern consistent with that formedical diagnoses. Mental health admissions (inpatient and ED encounters) ranged from 460 per100,000 in West HD to 1,388 in the South HD. Of note, three out of the five health districts with thehighest admission rates are in county health districts South, Southeast, and Southwest (which are inSPA 6) and the two other districts, Central and Pasadena, which are in SPA 4 and 6, respectively(Appendix Table B10, page 39). HDs with the lowest admission rates are either on the coast(Torrance and West) or clustered in the eastern half of Los Angeles County (East LA, Alhambra, ElMonte, San Antonio, Whittier, and Pomona).A review of the actual admissions reveals that most hospitalizations occur with a type of carereported as “medical” rather than psychiatric, suggesting that the county’s general acute carefacilities are used as staging areas to evaluate and stabilize patients medically before placement indedicated psychiatric inpatient wards or free-standing facilities.Serious Psychological Distress (SPD) is often used as a proxy measure for severe mental illness in apopulation. Adult respondents were asked six questions, known as the “Kessler 6”, to assesssymptoms of distress during a 30‐day period in the last year. Findings from CHIS regarding SPD areonly moderately concordant with the findings from actual hospitalizations for acute psychiatricconditions. Southeast (27%) and Central (14%) have the highest rates of SPD and West (3%) has thelowest, which are similar to their rank in relation to mental health hospital-care (Appendix TableB10). However, in some districts, we do not see the same pattern of use. For instance, the South HDhas low SPD (4%) but the highest rates of hospital-care and the San Antonio HD (in SPA7) has highSPD (10%) and the sixth lowest rate of hospital-care (595 per 100,000).9
Summary ranking of major chronic diseasesTable 3. Average Ranked Health Districts for8 Preventable Hospitalizations (1)To synthesize the many tables of data we haveproduced, we calculated the average rank oftotal preventable hospitalizations for eightmajor conditions: diabetes, hypertension, heartfailure, heart attack, CP, asthma, COPD and amental illness (Table 3).Health DistrictWestAlhambraTorranceHollywood-WilshireSan FernandoPomonaHarborWest ValleyEl MonteEast ValleyGlendalePasadenaFoothillSan AntonioWhittierLong Be
Ami M. Shah, MPH Health Policy Research Associate, UCLA Center for Health Policy Research E. Richard Brown, PhD (deceased) Professor, Department of Health Policy and Management, UCLA Fielding School of Public Health . EXECUTIVE SUMMARY i Local health data have the potenti