Transcription
Los Angeles Transportationby the NumbersMEETING THE REGION’S NEED FORSAFE, SMOOTH AND EFFICIENT MOBILITYAUGUST 2018TRIPNET.ORGFounded in 1971, TRIP of Washington, DC, is a nonprofit organization that researches, evaluates anddistributes economic and technical data on surface transportation issues. TRIP is sponsored by insurancecompanies, equipment manufacturers, distributors and suppliers; businesses involved in highway andtransit engineering and construction; labor unions; and organizations concerned with efficient and safesurface transportation.
LOS ANGELES AREA KEY TRANSPORTATION FACTSTHE HIDDEN COSTS OF DEFICIENT ROADSDriving on Los Angeles area roads that are deteriorated, congested and that lack somedesirable safety features costs the average driver 2,995 annually in the form of additional vehicleoperating costs (VOC) as a result of driving on rough roads, the cost of lost time and wasted fuel due tocongestion, and the financial cost of traffic crashes. California drivers lose a total of 61 billion eachyear as a result of driving on deficient roads.LOS ANGELES AREA ROADS PROVIDE A ROUGH RIDEDue to inadequate state and local funding, 79 percent of all major roads and highways in theLos Angeles area are in poor or mediocre condition. Fifty-seven percent of the area’s major urbanroads are in poor condition and 22 percent are in mediocre condition. Eleven percent of Los Angelesarea roads are in fair condition and ten percent are in good condition. Driving on rough roads costs theaverage driver in the Los Angeles area 921 annually in extra vehicle operating costs, includingaccelerated vehicle depreciation, additional vehicle repair costs, increased fuel consumption andincreased tire wear. Throughout the state driving on deteriorated roads costs California drivers a totalof 14 bilion each year.LOS ANGELES BRIDGES ARE SHOWING THEIR AGEMore than half – 56 percent – of California’s bridges are at least 50 years old – the eighthhighest rate in the nation. In the Los Angeles urban area, 176 of 4,703 bridges (20 feet or longer) arestructurally deficient, meaning there is significant deterioration of the bridge deck, supports or othermajor components.1
LOS ANGELES DRIVERS WASTE TIME AND FUEL ON CONGESTED ROADSTraffic congestion costs the average Los Angeles driver 1,774 each year in the form of lost timeand wasted fuel. The average Los Angeles area driver loses 82 hours each year – approximately twoworking weeks stuck in congestion. Congested roads choke commuting and commerce and costCalifornia drivers a total of 29.1 billion each year in the form of lost time and wasted fuel.LOS ANGELES TRAFFIC SAFETY AND FATALITIESFrom 2014 to 2016, an average of 876 people were killed annually in traffic crashes in the LosAngeles area. Each Los Angeles driver loses an average of 299 annually in the financial cost of trafficcrashes, including work and household productivity losses, property damage, medical costs,rehabilitation costs, legal and court costs, congestion costs, and emergency services in crashes in whichroadway features were likely a contributing factor. Throughout the state, traffic crashes in whichroadway features were likely a contributing factor imposed 9.8 billion in economic costs in 2016.CALIFORNIA’S ECONOMY IS RIDING ON ITS TRANSPORTATION SYSTEMEach year, 2.8 trillion in goods are shipped to and from sites in California, mostly by truck.Increases in passenger and freight movement will place further burdens on the state’s alreadydeteriorated and congested network of roads and bridges.The design, construction and maintenance of transportation infrastructure in California supports419,790 full-time jobs across all sectors of the state economy. These workers earn 17.8 billionannually. Approximately 7.1 million full-time jobs in California in key industries like tourism, retail sales,agriculture and manufacturing are completely dependent on the state’s transportation network.SB 1 INCREASES CALIFORNIA TRANSPORTATION INVESTMENTIn April 2017, the California legislature enacted SB 1 -- the Road Repair and Accountability Act.SB 1 increased state revenues for transportation by increasing the state’s gasoline and diesel taxes,implementing a transportation investment fee on vehicles and initiating an annual fee on zeroemission vehicles. It is estimated that SB 1 will increase state revenues for California’s transportationsystem by an average of 5.2 billion annually over the next decade. On November 6, 2018, Californianswill vote on Proposition 6, which, if approved, would repeal SB 1. The elimination of SB 1 revenueswould reduce funds available in California for transportation projects to improve road, highway andbridge conditions, improve traffic safety, enhance pedestrian and bicycle facilities, improve publictransit and relieve traffic congestion.2
INTRODUCTIONThe Los Angeles area’s roads, highways and bridges form vital transportation links for residents,visitors and businesses, providing daily access to homes, jobs, shopping, natural resources andrecreation. Modernizing and improving the transportation system is critical to quality of life andeconomic competitiveness in the Los Angeles area and in California as a whole. Inadequatetransportation investment, which will result in deteriorated transportation facilities and diminishedaccess, will negatively affect economic competitiveness and quality of life both locally and throughoutthe state.To accommodate population and economic growth, maintain its level of economiccompetitiveness and achieve further economic growth, California will need to maintain and modernizeits roads, highways and bridges by improving the physical condition of its transportation network andenhancing the system’s ability to provide efficient, reliable and safe mobility for residents, visitors andbusinesses. Making needed improvements to California’s roads, highways, bridges and transit systemscould also provide a significant boost to the state’s economy by creating jobs in the short term andstimulating long-term economic growth as a result of enhanced mobility and access.This report examines the condition, use and safety of the Los Angeles area’s roads, highwaysand bridges, and the area’s future mobility needs. Sources of information for this report include theFederal Highway Administration (FHWA), the American Association of State Highway andTransportation Officials (AASHTO), the Bureau of Transportation Statistics (BTS), the U.S. CensusBureau, the Texas Transportation Institute (TTI), the American Road & Transportation BuildersAssociation (ARTBA) and the National Highway Traffic Safety Administration (NHTSA).Corresponding reports for the state of California, and the following urban areas can be accessedby clicking on these links: Bakersfield, Central Valley, Chico-Redding, Concord, Fresno-Madera-VisaliaHanford, Los Angeles, Riverside-San Bernardino, Sacramento, San Diego, San Francisco-Oakland, SanJose and Santa Barbara-Santa Maria- San Louis Obispo.An urban area is defined as a region’s municipalities and surrounding suburbs for pavementcondition and congestion data; bridge and traffic fatality data include a region’s major counties.13
POPULATION, TRAVEL AND ECONOMIC TRENDS IN CALIFORNIALos Angeles motorists and businesses require a high level of personal and commercial mobility.To foster quality of life and spur continued economic growth, it is critical that the state provide a safeand modern transportation system that can accommodate future growth in population, tourism,business, recreation and vehicle travel.California’s population grew to approximately 39.5 million residents in 2017, a 17 percentincrease since 2000.2 California had approximately 26.2 million licensed drivers in 2016.3 From 2000to 2016, California’s gross domestic product (GDP), a measure of the state’s economic output,increased by 42 percent, when adjusted for inflation.4 U.S. GDP increased 30 percent during the sameperiod.5From 2000 to 2016, annual vehicle miles of travel (VMT) in the state increased by 11 percent,from 307 billion miles traveled annually to 340 billion miles traveled annually.6 Vehicle travel inCalifornia increased three percent from 2013 to 2016.7CONDITION OF LOS ANGELES AREA ROADSThe life cycle of a roadway system is greatly affected by the state and local governments’ abilityto perform timely maintenance and upgrades to ensure that road and highway surfaces last as long aspossible.The pavement data in this report, which is for all arterial and collector roads and highways, isprovided by the Federal Highway Administration (FHWA), based on data submitted annually byCaltrans on the condition of major state and locally maintained roads and highways. Pavement data forInterstate highways and other principal arterials is collected for all system mileage, whereas pavementdata for minor arterial and all collector roads and highways is based on sampling portions of roadwaysas prescribed by FHWA to insure the data collected is adequate to provide an accurate assessment ofpavement conditions on these roads and highways.In the Los Angeles urban area, 79 percent of major roads are in poor or mediocre condition.Fifty-seven percent of the Los Angeles urban area’s major locally and state-maintained roads are inpoor condition and 22 percent are in mediocre condition.8 Eleven percent are in fair condition and theremaining ten percent are in good condition.9Pavement failure is caused by a combination of traffic, moisture and climate. Moisture oftenworks its way into road surfaces and the materials that form the road’s foundation. Road surfaces at4
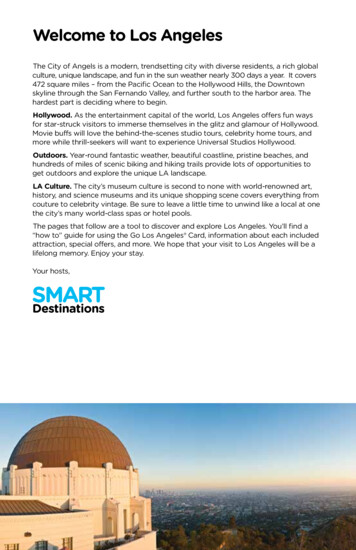
intersections are more prone to deterioration because the slow-moving or standing loads occurring atthese sites subject the pavement to higher levels of stress. It is critical that roads are fixed before theyrequire major repairs because reconstructing roads costs approximately four times more thanresurfacing them.10 As roads and highways continue to age, they will reach a point of deteriorationwhere routine paving and maintenance will not be adequate to keep pavement surfaces in goodcondition and costly reconstruction of the roadway and its underlying surfaces will become necessary.Chart 1. Pavement Condition Cycle Time with Treatment and CostSource: North Carolina Department of Transportation (2016). 2016 Maintenance Operations andPerformance Analysis ReportLong-term repair costs increase significantly whenroad and bridge maintenance is deferred, as road andbridge deterioration accelerates later in the service life of atransportation facility and requires more costly repairs. Areport on maintaining pavements found that every 1 ofdeferred maintenance on roads and bridges costs anadditional 4 to 5 in needed future repairs.115
THE COST TO LOS ANGELES AREA MOTORISTS OF ROADS IN INADEQUATE CONDITIONTRIP has calculated the additional cost to motorists of driving on roads in poor, mediocre or faircondition. When roads are in poor, mediocre or fair condition – which may include potholes, rutting orrough surfaces – the cost to operate and maintain a vehicle increases. These additional vehicleoperating costs (VOC) include accelerated vehicle depreciation, additional vehicle repair costs,increased fuel consumption and increased tire wear. TRIP estimates that additional VOC borne by theaverage driver in the Los Angeles area as a result of deteriorated road conditions is 921 annually – atotal of 22.1 billion statewide.12Additional vehicle operating costs have been calculated in the Highway Development andManagement Model (HDM), which is recognized by the U.S. Department of Transportation and morethan 100 other countries as the definitive analysis of the impact of road conditions on vehicleoperating costs. The HDM report is based on numerous studies that have measured the impact ofvarious factors, including road conditions, on vehicle operating costs.13 The HDM study found that roaddeterioration increases ownership, repair, fuel and tire costs. The report found that deteriorated roadsaccelerate the pace of depreciation of vehicles and the need for repairs because the stress on thevehicle increases in proportion to the level of roughness of the pavement surface. Similarly, tire wearand fuel consumption increase as roads deteriorate since there is less efficient transfer of power to thedrive train and additional friction between the road and the tires.TRIP’s additional VOC estimate is based on taking the average number of miles driven annuallyby a motorist, calculating current VOC based on AAA’s 2017 VOC and then using the HDM model toestimate the additional VOC paid by drivers as a result of substandard roads.14 Additional research onthe impact of road conditions on fuel consumption by the Texas Transportation Institute (TTI) is alsofactored in to TRIP’s vehicle operating cost methodology.LOS ANGELES BRIDGE CONDITIONSThe Los Angeles area’s bridges form key links in the area’s highway system, providingcommunities and individuals access to employment, schools, shopping and medical facilities, andfacilitating commerce and access for emergency vehicles.6
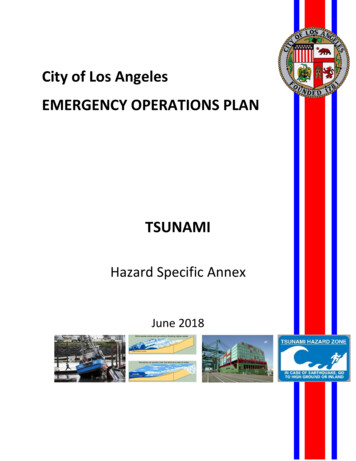
California’s bridges are showing their age.A significant number of California’s bridges havesurpassed or are approaching 50 years old, whichis typically the intended design life for bridges ofthat age. Fifty-six percent of the state’s bridgesare 50 years or older, the eighth highest share inthe nation.15 The cost of repairing and preservingbridges increases as they age and as they reachthe end of their intended design life.In the Los Angeles urban area, 176 of4,703 bridges (20 feet or longer) are structurallydeficient, meaning there is significantdeterioration to the major components of thebridge. Statewide, 1,603 of 25,657 of California’slocally and state-maintained bridges () are rated as structurally deficient.16 This includes all bridgesthat are 20 feet or more in length.A bridge is structurally deficient if there is significant deterioration of the bridge deck, supportsor other major components. Bridges that are structurally deficient may be posted for lower weightlimits or closed if their condition warrants such action. Deteriorated bridges can have a significantimpact on daily life. Restrictions on vehicle weight may cause many vehicles – especially emergencyvehicles, commercial trucks, school buses and farm equipment – to use alternate routes to avoidposted bridges. Redirected trips also lengthen travel time, waste fuel and reduce the efficiency of thelocal economy.The service life of bridges can be extended by performing routine maintenance such asresurfacing decks, painting surfaces, insuring that a facility has good drainage and replacingdeteriorating components. But, most bridges will eventually require more costly reconstruction ormajor rehabilitation to remain operable.TRAFFIC SAFETY IN THE LOS ANGELES AREAFrom 2014-2016, an average of 876 people were killed in traffic crashes each year in the LosAngeles urban area.17 Three major factors are associated with fatal vehicle crashes: driver behavior,7
vehicle characteristics and roadway features. It is estimated that roadway features are likely acontributing factor in approximately one-third of fatal traffic crashes. Roadway features that impactsafety include the number of lanes, lane widths, lighting, lane markings, rumble strips, shoulders, guardrails, other shielding devices, median barriers and intersection design.California’s overall traffic fatality rate of 1.07 fatalities per 100 million vehicle miles of travel in2016 is lower than the national average of 1.18.18The average driver in the Los Angeles area loses 299 each year in the financial cost of trafficcrashes in which roadway features were lkely a contributing factor.19 According to a 2015 NationalHighway Traffic Safety Administration (NHTSA) report, the economic costs of traffic crashes includeswork and household productivity losses, property damage, medical costs, rehabilitation costs, legal andcourt costs, congestion costs and emergency services.20Traffic crashes in California imposed a total of 29.4 billion in economic costs in 2016.21 TRIPestimates roadway features were likely a contributing factor in approximately one-third of all fataltraffic crashes, resulting in 9.8 billion in economic costs in California in 2016.22Improving roadway safety can be achieved through further improvements in vehicle safety;improvements in driver, pedestrian, and bicyclist behavior; and, a variety of improvements in roadwaysafety features.The severity of serious traffic crashes could be reduced through roadway improvements, whereappropriate, such as adding turn lanes, removing or shielding obstacles, adding or improving medians,widening lanes, widening and paving shoulders, improving intersection layout, and providing betterroad markings and upgrading or installing traffic signals. Roads with poor geometry, with insufficientclear distances, without turn lanes, having inadequate shoulders for the posted speed limits, or poorlylaid out intersections or interchanges, pose greater risks to motorists, pedestrians and bicyclists.Investments in rural traffic safety have been found to result in significant reductions in serioustraffic crashes. A 2012 report by TTI found that improvements completed recently by TxDOT thatwidened lanes, improved shoulders and made other safety improvements on 1,159 miles of rural stateroadways resulted in 133 fewer fatalities on these roads in the first three years after the improvementswere completed (as compared to the three years prior).23 TTI estimates that the improvements onthese roads are likely to save 880 lives over 20 years.248
TRAFFIC CONGESTION IN THE LOS ANGELES AREAIncreasing levels of traffic congestion causesignificant delays throughout California, particularly in itslarger urban areas, choking commuting and commerce. Inthe Los Angeles urban area, the average driver loses 1,774each year in the form of lost time and wasted fuel as a resultof traffic congestion. 25 The average Los Angeles driver loses82 hours each year stuck in traffic congestion.26Traffic congestion robs commuters of time andmoney and imposes increased costs on businesses, shippersand manufacturers, which are often passed along to theconsumer. Increased levels of congestion can also reducethe attractiveness of a location to a company whenconsidering expansion or where to locate a new facility.Eighty-five percent of California’s urban Interstatesare congested.27 Based on TTI methodology, TRIP estimatesthe value of lost time and wasted fuel in California isapproximately 29.1 billion per year.28TRANSPORTATION AND ECONOMIC GROWTHToday’s culture of business demands that an area have well-maintained and efficient roads,highways and bridges if it is to remain economically competitive. Global communications and theimpact of free trade in North America and elsewhere have resulted in a significant increase in freightmovement, making the quality of a region’s transportation system a key component in a business’ability to compete locally, nationally and internationally.Businesses have responded to improved communications and the need to cut costs with avariety of innovations including just-in-time delivery, increased small package delivery, demand-sideinventory management and e-commerce. The result of these changes has been a significantimprovement in logistics efficiency as firms move from a push-style distribution system, which relies onlarge-scale warehousing of materials, to a pull-style distribution system, which relies on smaller, more9
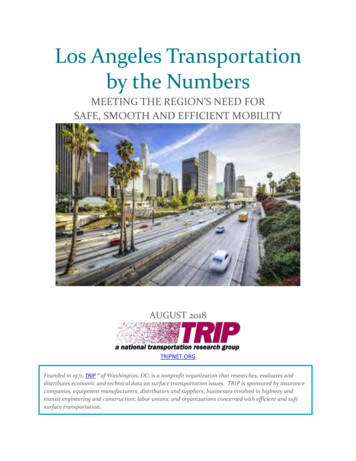
strategic movement of goods. These improvements have made mobile inventories the norm, resultingin the nation’s trucks literally becoming rolling warehouses.Highways are vitally important to continued economic development in California. As theeconomy expands, creating more jobs and increasing consumer confidence, the demand for consumerand business products grows. In turn, manufacturers ship greater quantities of goods to market tomeet this demand, a process that adds to truck traffic on the state’s highways and major arterial roads.Every year, 2.8 trillion in goods areshipped to and from sites in California, mostlyby trucks.29 Sixty-eight percent of the goodsshipped annually to and from sites in Californiaare carried by trucks and another 19 percent arecarried by courier services or multiple-modedeliveries, which include trucking.30The design, construction andmaintenance of transportation infrastructure inCalifornia play a critical role in the state’seconomy, supporting the equivalent of 419,790full-time jobs across all sectors of the stateeconomy, earning these workers approximately 17.8 billion annually.31 These jobs include209,126 full-time jobs directly involved in transportation infrastructure construction and relatedactivities as well as 210,665 full-time jobs as a result of spending by employees and companies in thetransportation design and construction industry.32Transportation construction in California annually contributes an estimated 3.2 million in stateand local income, corporate and unemployment insurance taxes and the federal payroll tax.33Nearly 7.1 million full-time jobs in California in key industries like tourism, retail sales,agriculture and manufacturing are dependent on the quality, safety and reliability of the state’stransportation infrastructure network. These workers earn 319 billion in wages and contribute anestimated 58.2 billion in state and local income, corporate and unemployment insurance taxes andthe federal payroll tax.3410
Local, regional and state economic performance is improved when a region’s surfacetransportation system is expanded or repaired. This improvement comes as a result of the initial jobcreation and increased employment created over the long-term because of improved access, reducedtransport costs and improved safety.Increasingly, companies are looking at the quality of a region’s transportation system whendeciding where to re-locate or expand. Regions with congested or poorly maintained roads may seebusinesses relocate to areas with a smoother, more efficient and more modern transportation system.Highway accessibility was ranked the number one site selection factor in a 2017 survey of corporateexecutives by Area Development Magazine. Labor costs and the availability of skilled labor, which areboth impacted by a site's level of accessibility, were rated second and third, respectively.35TRANSPORTATION FUNDINGInvestment in California’s roads, highways and bridges is funded by local, state and federalgovernments. A lack of sufficient funding at all levels will make it difficult to adequately maintain andimprove the state’s existing transportation system.In April 2017, the California legislature enacted SB 1 -- the Road Repair and Accountability Act.SB 1 increased state revenues for transportation by increasing the state’s gasoline and diesel taxes,implementing a transportation investment fee on vehicles and initiating an annual fee on zeroemission vehicles.36 It is estimated that SB 1 will increase state revenues for California’s transportationsystem by an average of 5.2 billion annually over the next decade.37 Each year, the SB 1 fundingpackage is expected to provide an additional: 1.8 billion for the maintenance and rehabilitation ofstate-maintained highways; 1.7 billion for the maintenance and rehabilitation of locally maintainedroads and streets; 750 million for improvements to public transit; 380 million for traffic congestionrelief including roadway capacity expansion; 310 million for improvements to freight corridors; 100million for improved pedestrian and bicycling facilities; and, 25 million for freeway service patrols.38On November 6, 2018, Californians will vote on Proposition 6, which, if approved, would repeal SB 1.The elimination of SB 1 revenues would reduce funds available in California for transportation projectsto improve road, highway and bridge conditions, improve traffic safety, enhance pedestrian and bicyclefacilities, improve public transit and relieve traffic congestion.11
CONCLUSIONAs California works to build and enhance a thriving, growing and dynamic state, it will be criticalthat it is able to address the state’s most significant transportation issues by providing a 21st centurynetwork of roads, highways, bridges and transit that can accommodate the mobility demands of amodern society.California will need to modernize its surface transportation system by improving the physicalcondition of its transportation network and enhancing the system’s ability to provide efficient, safe andreliable mobility for residents, visitors and businesses. Making needed improvements to the state’sroads, highways, bridges and transit systems would provide a significant boost to the economy bycreating jobs in the short term and stimulating long-term economic growth as a result of enhancedmobility and access.The approval of SB 1 in 2017 has allowed California to increase its annual investment in roads,bridges, highways, transit systems, bike paths and pedestrian facilities by 5.2 billion annually.Maintaining this higher level of transportation funding will be critical in allowing the state to improveroad and bridge conditions, relieve traffic congestion and improve traffic safety. If California is unableto maintain its current level of transportation investment, the cost to the public of deficient roads,traffic congestion, and a lack of adequate roadway safety will increase and economic developmentopportunities and quality of life in the Golden State will be diminished.###12
ENDNOTES1Bridge condition data and safety data for each urban area includes the counties noted: Bakersfield: BakersfieldCounty; Central Valley: Merced, San Joaquin and Stanislaus Counties; Chico-Redding: Butte, Shasta and TehamaCounties; Concord: Contra Costa County; Fresno-Madera-Visalia: Fresno, Kings, Madera and Tulare Counties; LosAngeles: Los Angeles and Orange Counties; Riverside-San Bernardino: Riverside and San Bernardino Counties;Sacramento: El Dorado, Placer, Sacramento and Yolo Counties; San Diego: San Diego County; San FranciscoOakland: Alameda, Marin, San Francisco and San Mateo Counties; San Jose: San Benito and Santa ClaraCounties; Santa Barbara-Santa Maria-San Luis Obispo: Santa Barbara and San Luis Obispo Counties.2U.S. Census Bureau (2017).3Highway Statistics (2016). Federal Highway Administration. DL-1C.4TRIP analysis of Bureau of Economic Analysis data.5Ibid.6U.S. Department of Transportation - Federal Highway Administration: Highway Statistics 2000 and 2016 andanalysis of Federal Highway Administration Traffic Volume Trends ravel monitoring/tvt.cfm7U.S. Department of Transportation - Federal Highway Administration: HighwayStatistics 2013 and analysis of Federal Highway Administration Traffic Volume Trends ravel monitoring/tvt.cfm8Federal Highway Administration (2017). Pavement condition data is for 2016.Ibid.10Selecting a Preventative Maintenance Treatment for Flexible Pavements. R. Hicks, J. Moulthrop.Transportation Research Board. 1999. Figure 1.11Pavement Maintenance, by David P. Orr, PE Senior Engineer, Cornell Local Roads Program, March 2006.12TRIP calculation.13Highway Development and Management: Volume Seven. Modeling Road User and Environmental Effects inHDM-4. Bennett, C. and Greenwood, I. 2000.14Your Driving Costs. American Automobile Association. 2017.15Ibid.16Federal Highway Administration National Bridge Inventory. 2017.17Federal Highway Administration National Highway Traffic Safety Administration, 2014-2016.18TRIP analysis of National Highway Traffic Safety Administration and Federal Highway Administration data(2017). Data is for 2016.19TRIP estimate based on NHTSA report “The Economic and Societal Impact of Motor Vehicle Crashes, 2010(Revised), 2016. P. 146.20The Economic and Societal Impact of Motor Vehicle Crashes, 2010 (Revised) (2015). National Highway TrafficSafety Administration. P. 1. blication/81201321TRIP estimate based on NHTSA report “The Economic and Societal Impact of Motor Vehicle Crashes, 2010(Revised), 2016. P. 146.22Ibid.23Adding Highway Shoulders, Width, Reduce Crash Numbers and Save Lives (August 9, 2012). TexasTransportation Institute. -roadway-improvements/24Ibid.25TRIP estimates based on Texas Transportation Institute Urban Mobility Report.26Ibid27Federal Highway Administration Highway Statistics 2016.28Ibid29TRIP analysis of Bureau of Transportation Statistics, U.S. Department of Transportation. 2012 CommodityFlow Survey, State Summaries.30Ibid.913
31American Road & Transportation Builders Association (2015). The 2015 U.S. Transportation ConstructionIndustry Profile. omic Profile.pdf32Ibid.33Ibid34Ibid.35Area Development Magazine (2018). 32nd Annual Survey of Corporate Executives: Availability of Skilled LaborNew Top Priority. tive Analyst’s Office (2018). Overview of the 2017 Transportation Funding 3738Ibid.Ibid.14
LOS ANGELES TRAFFIC SAFETY AND FATALITIES . From 2014 to 2016, an average of 876 people were killed annually in traffic crashes in the Los Angeles area. Each Los Angeles driver loses an average of 299 annually in the financial cost of traffic crashes, including work and house