Transcription
CROWD VIEWSEDITION 3Small Business
Small Business Edition 3Table of ContentsExecutive SummarySection One34Introduction4What’s in the Report for Me?6For the Small-Business Owner/Manager: Growth Strategy6For the Small-Business Owner/Manager: Maintenance Strategy6For IT Suppliers6The SurveyDemographics77Business Strategy and Outlook11Operations16Information Technology23Section Two - Solutions27Introduction27Key Focus Areas28Collaboration and Work Execution Systems28Help Desk29File Sync and Business Content Management30Project Management, Task Management, and Coordination31Team Collaboration32Web Conferencing33Change Management 10134Some Closing Thoughts36MethodologyFinal Thoughts37382
Small Business Edition 3Welcome to the 3rd Editionof Crowd Views.Executive SummaryFor this study, small business will be classified as businesses with 250 or fewer employees. Overall, theoutlook of businesses in this study, based on a survey of 301 small business owners and managers,was positive. 59% of the respondents believed that the economy would get stronger in 2017, showinga relatively optimistic outlook for the year ahead, and with only 12% reporting that they believed theeconomy would get weaker. They came off of a strong 2016 as well, with 70% more successful in2016 than 2015. 63% also indicated that they had invested in their business in 2016, and 77% plannedinvestment in growth plans for 2017. When asked to characterize their business plans for 2017-2018,they were split: about 37% aggressive, 35% conservative, and 28% moderate.When asked in the survey if the businesses invested in growth in 2016, 63% answered yes, and ofthose that invested, nearly 18% indicated that those investments were in software, cloud software,and other IT systems. This was tied for 1st along with marketing/advertising and new equipment, withadding new sales headcount in fourth at 17%. Consuming software and infrastructure as a service isattractive to business owners as it moves the costs into the operating model, and cuts back on capitalinvestments outside of the business core. The cloud frees up more resources to invest in the growthof the business. Outsourcing processes, or what some call business process as a service (BPaaS), isenabled by cloud computing resources and is more cost-effective than before. Moving complete, butnon-core business processes outside the business helps concentrate more focus and investment inactivities that add to growth and competitive advantage. Approximately 51% of the survey respondentsindicated that outsourcing is an important part of their business plan. The most often-outsourcedprocesses were legal at 36%, payroll at 36%, and bookkeeping at 31%.When building the survey, the assumption was made that the businesses would fit into three majorcategories when it came to business plans, growth businesses versus maintenance / status quo, andthose that had the desire to sell the business this year. Throughout the survey data that segmentation,particularly between growth and maintenance, provided the best insight to business strategies andoperational plans.3
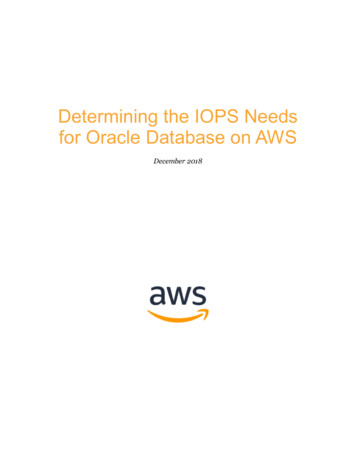
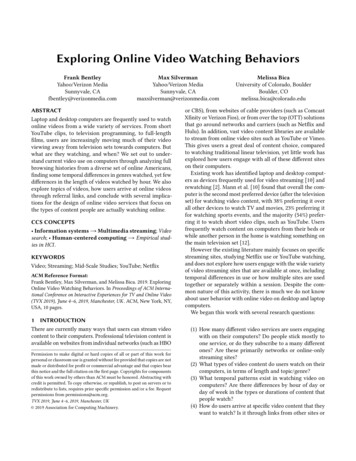
Small Business Edition 3Section OneIn this Edition of Crowd ViewsIntroductionSmall businesses are the core of the US and global economy. According to the US Small Business Administration (whichclassifies businesses into small 500 employees; large 500 employees), in 2013 there were 28.8 million small businesses,versus 18,600 large enterprises in the United States. The role of the small business in the US economy is substantial, as youcan see in Figure 1.FIGURE 1 Small business role in the US economy99.9%99.7%97.7%of all firmsof firms with paid employeesof exporting firms(297,000 small exporters)33.6%48.0%41.2%of known export value( 471 billion out of 930 billion)of private sector employees(57 million out of118 million employees)of private-sector payrollSource: SUSB, NES, ITA (2013)4
Small Business Edition 3Although this business segment accounts for a massive portion of our economy, small businesses have long been grouped inwith their larger mid-market and enterprise-level businesses, which often have sizable workforces and budgets and revenueto fuel their businesses. It is only recently that the unique needs and business problems that impact small businesses havebeen recognized and have begun to be addressed by the solution providers that can help fuel day-to-day company operations.While small businesses do face many of the same challenges as their mid-market and enterprise counterparts, they do sowith much more limited resources. Operating with fewer resources, whether those are financial or employees, is challenging,particularly in an economic environment that often pits small businesses against larger competitors. Technology, whenapplied correctly, can serve to varying degrees as an equalizer for small businesses.The internet has enabled small, growth-oriented businesses to innovate and compete effectively at a global scale and withglobal reach. Competing in a global marketplace offers unique opportunities for growth but comes with many new anddifficult challenges. For small businesses that continue to focus on local markets, the internet is disrupting supply chainsand business models.The internet also forms the base platform for many new, innovative technologies that can be used to build a more agile andinnovative business platform. Cloud computing, both as a distribution method and a more cost-friendly economic model,opens up access to many systems and technologies that would not be affordable or even available for most small businessesin the legacy model.Cloud computing is also tied to the growing use of artificial intelligence (AI), allowing companies to automate simple tasksand free up resources to concentrate on more useful activities. AI can also help employees make better, data-driven decisionsby reducing “big data” to actionable insights.The other growing technology that is at the heart of many innovations is the internet of things (IoT). IoT—coupled with edgecomputing (to oversimplify: moving the computing resources nearer to the IoT sensors) provides much-needed, valuablebusiness data to feed AI models—changes the way remote equipment can be operated, and provides fuel for innovativebusiness ideas and models. These are only two of several emerging new technologies that will open up other businessopportunities. Other technologies include conversational systems, virtual reality (VR), and augmented reality (AR).In Section One of this report, we’ll review survey responses from over 300 small-business owners and managers about thestate of the economy for small businesses, the owners’ outlook for 2017, the problems they face, and the initiatives andtechnology solutions they’re implementing to address those problems. In Section Two, we’ll dig into more of the solutionsthat can most effectively help small businesses continue to grow in both size and efficiency.5
Small Business Edition 3What’s in This Report for Me?For the small-business owner/manager, growth strategy:Survey results that will serve as benchmarks for your own business operationsand strategyIdeas for competing more effectively by using technologyA view into what other business owners are doing with outsourcing, marketing,and ITA look at relevant technology solutions based on G2 Crowd reviews from othersmall-business usersFor the small-business owner/manager, maintenance strategy:Survey results that will serve as benchmarks for your own business operationsand strategyIdeas for using technology in a conservative business plan environmentA view into what other conservative business owners are doing withoutsourcing, marketing, and ITA look at relevant technology solutions based on G2 Crowd reviews fromother small-business usersFor IT suppliers:A view of both growth and maintain business strategies and operationsData showing the current use of outsourcing for growth and maintainbusinessesPlans for investments in 2017-2018Marketing channel use and effectivenessIT investment plans6
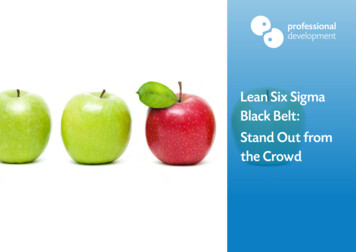
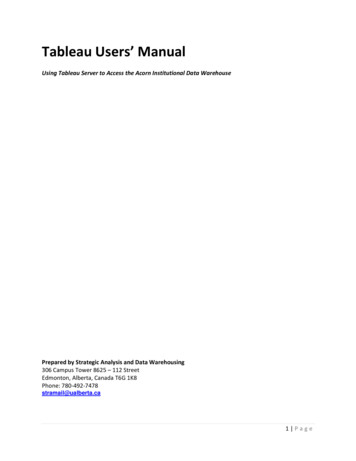
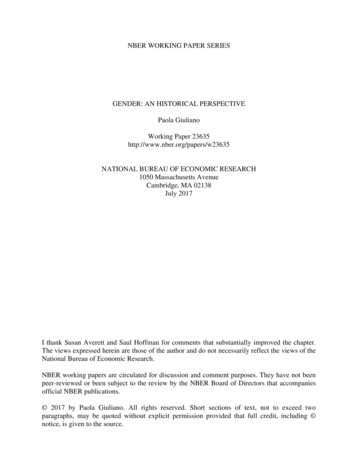
Small Business Edition 3The SurveyFor this study, small businesses are classified as businesses with 250 or fewer employees. The survey, conducted in March2017, was focused on small-business owners and managers and received a total of 301 complete responses.When building the survey, the assumption was made that the businesses would fit into three major categories when it cameto business plans:Growth businessesMaintain/status quo businessesBusinesses with the desire to sell this yearThroughout the survey data, that segmentation—particularly between growth and maintenance—provided the best insightinto business strategies and operational plans.The following charts break down the demographics out in greater detail:DemographicsFIGURE 2 Respondents by primary work responsibilityPercent of respondentsSenior Management20%IT15%Engineering / Science / R&D12%Customer Service / Support8%HR15% of respondents3%Facilities2%Purchasing / Procurement2%Otherhave customer-facing roles7%Accounting / Finance23% of respondents27% of respondents8%Marketinghave executive roleshave technology roles8%Sales20% of respondentshave administrative roles15%7
Small Business Edition 3FIGURE 3 Respondents by company size66%of respondents12%10%9%3%1-2526-5051-99100-250 250Company size (employees)FIGURE 4 Respondents by company size and business objectiveCompany size(employees)MaintainGrowSell / transferDon't cent of respondents8
Small Business Edition 3FIGURE 5 Respondents by total company revenue69% 100K- 999K 1M- 4.9M 5M- 9M17% 10M- 24M8%6%Percentage is based off only the results up to 24M.FIGURE 6 Respondents by total company revenue and business objectiveCompany revenueGrowMaintainSell / transfer 100K- 999K 1M- 4.9M 5M- 9M 10M- 24M0102030405060708090100Percent of respondents9
Small Business Edition 3FIGURE 7Respondents by industry and business objectiveGrowBusiness / Professional Services53Wholesale / Retail1531Other722High Tech29Architectural / Engineering / Construction1912%3Financial Services / 5.1%314.2%13.7%15Energy / UtilitiesPublic Sector / Nonprofit12.8%10%5Hospitality / Food / Beverage223.8%616Healthcare3% of total6Media / EntertainmentIndustrial / erospace / Defense41.2%Transportation / Logistics / Warehousing31.2%Pharma / Biotech / Life Sciences21%Number of respondents10
Small Business Edition 3Business Strategy and OutlookSmall businesses, in general, have a positive outlook for 2017. Nearly 75% of respondents indicated that their main businessobjective for 2017 is growth. When asked about the economic outlook for 2017, 59% indicated that they believed the USeconomy would get stronger. Looking at the data by company size, the 100-250 employees and the 51-99 employeessegments were the most optimistic about the economy at 73% and 69%, respectively. Figure 8 breaks the question out bygrowth and maintain segments.FIGURE 8 For 2017, do you believe the economy will:Percent of respondents61%GrowGet stronger50%MaintainTotal59%59% indicated that theybelieved that the economywould get stronger in 201722%Stay the same38%25%12%Get weaker8%12%5%Don't know3%5%11
Small Business Edition 3This optimism is a carryover from 2016, in which 59% of the respondents reported as more successful than 2015. You willalso note that only 17% reported that 2016 was less successful than 2015. Figure 9 shows the responses from the questionsegmented into grow, maintain, and sell/transfer.FIGURE 9In 2016 versus 2015, were your net profit margins:Percent of respondentsGrowHigher65%Maintain41%Total58%58% reportedmore success in 201616%Lower17%16% reported16%less success in 201620%Stayed the same42%25%The respondents also indicated that 2016 was a good year for profits, with 58% of respondents reporting that their marginswere higher over 2015, while 25% reported staying the same, and only 16% reported lower margins over 2015. Again, the100-250 employee and 51-99 employee segments reported the highest response with 72% and 71% higher margins in 2016over 2015.With higher profits, you would also expect investments back into the business in 2016—or more likely 2017. The survey datasupports this, with 63% reporting that they invested in growth in 2016 and 77% planning investments in 2017.12
Small Business Edition 3Let’s take a look at the use of the investments in 2016. In aggregate, software, cloud software, and other IT systems were tiedfor first along with marketing/advertising and new equipment (at 18%), with adding new sales headcount in fourth at 17%.Looking at the data segmented by growth and maintain, however, you can see in Figure 10 that software, cloud software, andother IT systems had a slight edge among the growth businesses.FIGURE 10What was the primary use of the investment?Software, Cloud Softwareand Other IT Systems17%18%New Equipment18%25%16%Additional Sales Headcount17%Additional Non-Sales Headcount4%Acquisition (M&A)of Another Business1%2%3%8%13%9%3%4%4%in aggregate, software,cloud software, andother IT systems weretied for first atalong withmarketing/advertisingand new equipment18%10%21%8%Additional Inventory18%8%19%New Facility / LocationsOther18%8%20%Marketing / AdvertisingR&DTotalMaintainGrow2%software, cloud software,and other IT systems hada slight edge atamong the growthbusinesses20%3%3%Percent of respondents13
Small Business Edition 3When looking at the data by company size, respondents in the smallest segment (1-25 employees) were the highest torespond that they are investing in software, cloud software, and other IT systems at 22%, four percentage points above theaverage. This is well above the rest of the size segments:FIGURE 11 Percent of companies investing in software,cloud software, and IT systems% of companiesinvesting25%1-25 employee segment at1-2520%21.8% is 4 percentagepoints above the averageAverage 17.6%15%51-9926-5010%5%100-2500%-12-8-40 4% variation from averageThese responses seem to support the concept that smaller businesses are using new technologies to offset some of theirresource constraints and are leveraging IT for growth. Also, note that marketing/advertising was the number-one answer forthe 1-25 employee segment at 26%.As already noted, investment plans for 2017 are even more aggressive than reported in 2016, and those plans are relativelyconsistent across all size segments. Alternatively, the investment plans for 2017 look quite a bit different from what wasreported for 2016.14
Small Business Edition 3FIGURE 12Primary use of investment in 2017by grow and maintain business objectivesSoftware, Cloud Softwareand Other IT Systems11%26%New Equipment10%Additional Sales HeadcountAdditional Non-Sales HeadcountAcquisition (M&A)of Another BusinessR&DOther24%17%10%21%New Facility / Locations11%13%Marketing / AdvertisingAdditional 15%8%13%3%7%3%growth businessesare prioritizingmarketing/advertisingand sales headcountinvestments insoftware, cloud software,and other IT systemsdrop off to 11%7%2%2%3%Percent of respondentsAs you can see in Figure 12, the growth businesses are prioritizing marketing/advertising and sales headcount for 2017.Investments in software, cloud software, and other IT systems, on the other hand, drop off quite a bit to 11% from 20% in2016. In the size segmentation, the smallest businesses (1-25 employees) are planning on investing heavily in marketing/advertising at 33%, but drop off the average quite a bit for sales headcount at 15%. The largest segment, 100-250 employees,is heavily skewed in the opposite direction, with sales headcount as their highest response at 29%, and marketing/advertisingat only 5%.15
Small Business Edition 3FIGURE 13 Primary use of investment in 2017 by company sizeCompany size (employees)Software, Cloud Softwareand Other IT 4%New Facility / Locations5%19%11%10%33%8%15%Marketing / Advertising4%Additional Inventory8%14%5%5%24%8%15%6%22%22%New EquipmentAdditional onal SalesHeadcountAcquisition (M&A)of Another Business29%18%14%2%OperationsThe operational data collected in the survey relates to a few areas: outsourcing, marketing channels, and sales channels.Outsourcing, or business process as a service (BPaaS), can be an important tool for small businesses to help remedyresource constraints while keeping the business focused on what drives revenue and profit.The respondent businesses were evenly split onwhether outsourcing was an important part of theirbusiness strategy, with 51% reporting yes and 49%reporting no. The size segments were not so evenlysplit, though; all but the smallest segment were wellabove the average in saying they outsource somebusiness processes.all but the smallest segment (1-25) werewell above the average in saying theyoutsource some business processes:1-2526-5051-99100-25042% 74% 62% 80%16
Small Business Edition 3In the growth versus maintain segmentation, 56% of the growth businesses indicated that outsourcing was an important partof their business plan versus only 33% of the maintain group. What processes they currently outsource varies quite a bit bycompany size, as you can see in Figure 14.FIGURE 14Business processes currently outsourced to a third-party providerby company sizeCompany size erage16%7%7%Shipping50%35%36%16%41%10%20%Legal kkeeping ign / Build5%40%13%17%Public Relations12%42%35%28%11%18%5%47%IT t33%19%23%20%CustomerService / Support7%3%10%19%8%14%9%47%of businesseswith 26-50 employeesrely on outsourcing ITmanagement, (categoryaverage of 26%)58%of business with100-250 employees relyon outsourcing ITmanagement (categoryaverage of 26%)27%Marketing14%15%16%Other2%8%7%17
Small Business Edition 3The 100-250 employee segment seems to rely on outsourcing the most, with IT management standing out as the mostoutsourced business process at 58% against a category average of only 26%. The 26-50 employee segment is also higherthan the average in IT management outsourcing at 47%. Looking at the question segmented by growth versus maintain, it’sclear that the growth businesses, which outsource more business processes in general, focused much of that outsourcingon essential processes that are not a core part of the business strategy such as payroll, legal services, website design, andIT management. Figure 15 shows the complete breakout of the two segments:FIGURE 15Business processes currently outsourced to a third-party providerby grow and maintain business objectivesPayroll38%Legal Services17%39%Bookkeeping / Accounting31%IT ng34%22%25%Website Management34%15%32%Website Design / 15%12%Sales10%Public Relations10%3%10%8%3%7%7%7%HRCustomer Service / SupportOther6%5%8%10%12%7%Percent of respondentsBased on the investment plans for 2017, marketing/advertising is an area that will see quite a bit of growth for many ofthe respondents. Looking at the marketing channels currently in use, Facebook is by far the most prevalent among therespondents at 80%. The next closest channel was Twitter at 51%. Figure 16 shows the question broken out by size segments:18
Small Business Edition 3FIGURE 16Marketing channels used regularly (at least once a month)for marketing/advertising by company sizeCompany size 3%Twitter51-99100-250OtherBanner le DynamicSearch ncy11%16%Newspaper33%32%17%31%24%10%16%Pinterestof respondentsuse Twitter7%29%32%Google Adwords51%11%19%48%42%20%19%19%12%19%of respondentsuse Facebook regularlyfor %7%19
Small Business Edition 3Of the channels used, Facebook was named both the most successful at 38% of respondents and the least successfulat 29%. Since it was, by far, the most used channel, that isn’t really surprising. Figures 17 and 18 show the most and leastsuccessful channels.FIGURE 17 Most successful marketing channels in 201638%38%atofrespondents, Facebookwas named the aperBanner AdsGoogle DynamicSsearch rFacebook12%Instagram17%FIGURE 18 Least successful marketing channels in 201629%29%2%2%2%2%Billboards4%TV3%5%Google DynamicSsearch %Radio9%GoogleAdwords10%Banner Ads12%Newspaper13%ofatrespondents, Facebookwas named the leastsuccessful20
Small Business Edition 3Sales channels for small businesses are quite diverse and include online/e-commerce, direct and indirect sales, andcatalogs. Among growth businesses, online/e-commerce was the most common channel, with direct sales a close second.Figures 19 shows all of the sales channels used regularly by growth and maintain respondents.FIGURE 19Sales channels regularly usedby grow and maintain business objectivesMaintainGrowOnline / E-Commerce57%Direct Sales52%Inside Sales25%Affiliates21%Marketplaces (eBay, Amazon, nel Partners / Value-Added ResellersCatalog43%5%6%20%7%among growthbusinesses,online/e-commerce at57% was the mostcommon channel, withdirect sales a closesecond at 52%7%18%12%5%5%3%Percent of respondents21
Small Business Edition 3The primary sales channel for growth is direct, which also comes in at a close second behind online/e-commerce for themaintain businesses. Figure 20 shows the primary sales channels for growth and maintain.FIGURE 20Primary sales channel for generating revenueby grow and maintain business objectivesDirect SalesInside Sales9%Channel Partners /Value-Added rced1%Catalog1%29%29%31%7%33%28%33%Online / E-CommerceMarketplaces(eBay, Amazon, %atdirect saleswas the primary saleschannel for growth28%atdirect salescomes in second behindonline/ecommerce at29% for maintain1%2%1%Percent of respondentsConsidering outsourcing of business processes is relatively prominent among small businesses, the next question evaluatedhow this impacts hiring and headcount at these companies. Some data on headcount plans was collected in the survey, butmost of it is unremarkable. The good news from this part of the survey relates to plans for permanent headcount reductionin 2017, which had a very small “yes” response of 13%. This ties closely to the overall optimism of the respondent businessesfor 2017.The other data point is from the question on the causes of the reductions. Outsourcing business functions came in thehighest at 33%, which is not surprising based on the other outsourcing questions. Automation replacing employees, whichhas gotten much attention and speculation as a potential cause for job losses recently, came in quite low at 13%. Of note isthe fact that the answer is a small percentage of a small sample, with only 13% of the total 20 respondents being offered thequestion. As such, this should only be used as a basic indication of direction.22
Small Business Edition 3Information TechnologyThe use of IT is high for the small businesses in this survey, and managing it can be a resource drain. There are severalapproaches that could be taken, including managing it in-house, outsourcing, and a blended model. When asked how theymanaged IT assets, only 15% reported having no dedicated IT resources or services. All those respondents who didn’t havededicated IT resources or services were in the 1-25 employees segment.Growth businesses used all three approaches, although the largest percentage of them (54%) used dedicated internal ITresources. Figure 21 shows both segments across all three methods.FIGURE 21Managing IT Assets by grow and maintain business objectivesInternal resourcesOutsource all IT managementI do not have any dedicatedIT resources or services51%50%54%16%23%12%A mix of internal and outsourced15%TotalMaintainGrow10%20%18%54%atmore than halfof grow businesses useddedicated internal ITresources15%17%14%of thewhoreported having nodedicated IT resourcesor services, all werefrom the 1-25 employeesegmentPercent of respondentsWith the optimism for growth in 2017, it’s not surprising that 40% of respondents are planning on increasing IT spending in2017 over 2016. Among the growth segment, IT investment plans are somewhat higher at 47%. Figure 22 shows investmentplans by growth and maintain:FIGURE 22IT investments planned for 2017 versus 2016by grow and maintain business objectivesIncrease spendingDecrease spending47%Remain the sameDon't know40%17%73%41%4%Percent of respondents5%of respondentsare planning onincreasing IT spendingin 2017 over 20169%5%8%40%TotalMaintainGrow46%5%47%at, IT investmentplans are somewhathigher among the growthsegment23
Small Business Edition 3Looking at investment plans by company size, the larger segments, 51-99 and 100-250 employees, have higher than averageresponses with plans to invest in IT. Figure 23 shows the complete breakout of investment plans by company size:FIGURE 23 IT Investments planned for 2017 versus 2016 by company sizeCompany size 3.3%Increase spending40%59.5%58.3%Remain the same26.2%37.5%40.2%45.6%8%13.3%11.9%Decrease spendingDon't know4.2%8.8%7%3.3%2.4%5.4%The final two questions in the survey relate to what IT systems are in place, and which systems respondents plan to deployor replace in the next 12-18 months. Core IT systems like accounting, payroll, marketing, and CRM are already in use in alarge number of the respondents (see Figure 24). Systems related to collaboration and work execution, which include teamcollaboration, project management, and file sync and share/BCM, are being deployed and replaced at a much higher rate(see Figure 25).FIGURE 24Collaboration IT Systems in place, deploying, or being replacedby grow and maintain business objectivesGrowMaintainHaveFile Sync and Share* / BusinessContent Management* like Box, Dropbox, Sharepoint, etc.31%DeployReplace23%19%25%18%Percent of respondents20%18%28%DeployReplace12%26%HaveTeam Collaboration and/or Messaging23%27%DeployReplace12%17%HaveProject Management17%15%20%20%2425
Small Business Edition 3FIGURE 25Core IT Systems in place, deploying, or being replacedby grow and maintain business eting Automation25%21%HaveReplace18%27%DeployReplaceHR, Recruiting and Talent Management23%13%HaveEmail Marketing15%27%DeployReplaceCustomer Service / Support37%18%HaveCRM42%18%33%22%Percent of respondentsIt’s likely that these collaboration and work execution systems are either currently underperforming in many of the businessesthat had already deployed them, or the business had not deployed this type of system before, but is seeing challenges relatedto coordinating and executing work.25
Small Business Edition 3The respondents were currently deploying several key systems at a high rate. The top eight IT systems that are being deployed,which are mostly core IT systems, are shown in Figure 26.FIGURE 26 Top 8 IT systems being deployed in the next 12-18 monthsAccountingMarketing AutomationPayrollCustomer Services / SupportHR, Recruiting, and Talent ManagementSales Contact ManagementSocial Media ManagementBusiness Intelligence / AnalyticsThe list of the top eight systems that are being replaced was quite different from the deploy list. As you can see in Figure 27, thesystems in this list are generally tools that are used extensively in support of the business, like email marketing and social mediamanagement, or directly related to managing and coordinating work.FIGURE 27 Top 8 IT systems being replaced in the next 12-18 monthsEmail MarketingSocial Media ManagementCRMeSignature / Digital SignaturePayrollFile Sync and Share / Business Content Management (like Box, Dropbox, Sharepoint, etc.)Project ManagementTeam Collaboration and/or MessagingNow that we’ve outlined the outlook, problems, and practices of small businesses, it’s important to consider the technology andsolutions that can best help small-business owners run their companies.26
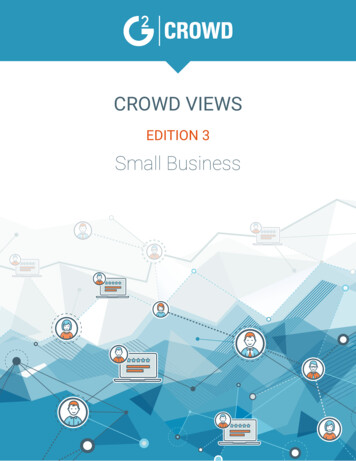
Small Business Edition 3Section Two:SolutionsIntroductionAll businesses—whether they are large or small, growing or maintaining—face challenges.Small growth businesses face the same types and scale of challenges as many enterprise businesses. The difference: Thingssimply happen faster in a small growth business. The results of decisions, each and every decision, impact the businessevery day, and there are often just not enough hours in the day to consider the significance of each decision.The approach we are taking within this section of the report is to isolate the specific categories of technology that will havethe biggest impact on your business. Additionally, we are highlighting products that business users rate high for G2 CrowdUsability score. In other words, it is critical that whatever technology is chosen is liked and used by your team. Basing apurchase decision using this approach is leveraging the wisdom of the crowd in addition to your own business requirements,therefore giving the proper consideration to each purchase.FIGURE 28Focusing on Compa
Customer Service Suort Mareting 20% of resondents have eeuie roles 27% of resondents have usmeain roles 7% 15% 8% 12% Senior Management IT Engineering / Science / RD 8% 15% Other Accounting / Finance HR Facilities Purchasing / Procurement 8% 20% 3% 2% 2% 15 of respondents have administrative