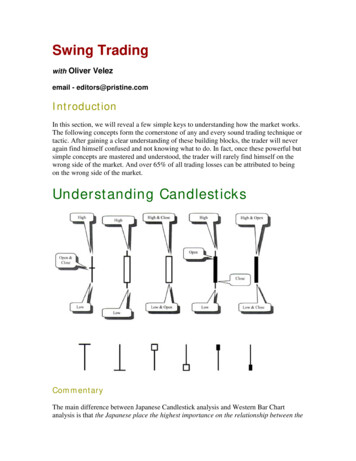
Transcription
Beginners Guide to Swing TradingWelcome to my first document I have created on how I swing trade. This guide is not for the peoplewho have no idea about Forex or the basics. If you are new, I would recommend you to go sign up with TheForex Family, pick up a book or go on www.babypips.com. Prior to reading this guide you need to know thebasics of Forex trading, e.g. How to plot Support & Resistance (Supply & Demand Zones), Draw Trendlines,Understandings How the News Affects the Markets, and most importantly understanding Price Action(Candlestick Patterns).What I will be covering in this guide: Simplifying ChartsMarket StructurePsychological LevelsMy Favourite Set UpsEntries Take Profit Stop LossesRisk ManagementTips on What to Do When You Feel LostSimplifying ChartsThere are traders out there using indicators, algorithms, or signals. Obviously, some work for sometraders and institutions, but if you are a retail trader, which I am sure most of you are, then get rid ofeverything. Start from scratch, simplify, it will make your life easier. All you will need is to know how toidentify market structure (HH, HL, LH, LL), draw your zones and price action. Trendlines work sometimes,but don’t really on them too heavily. It is that simple. The less you look at, the more appealing it is to theeye, and keeps you from overthinking.This is an example of how my charts look:I just have my zones plotted, a trendline and I just watch the overall trend and market structure(will highlight in next section). Look closely and see how it all reacted to my zones, you can see the candlesbeing exhausted at the zones and then it went the other way. I try keep my zones as fresh (new) as
possible. The fresher it is, the stronger it is, but since we are on the H4 timeframe, we only should changeit 1 or 2 times a week depending on the market structure.Have a close look at the trendline, it was well respected, and what I noticed, but does not happenevery time is that after the 3rd touch, the 4th would usually break. It broke on the 4th touch, came for aretest and formed a bullish pin bar. This usually signifies a higher low being created and price wouldcontinue higher. However, price dropped back down into the trendline. Usually what I do after is removethe trendline from my chart.Then this is how my chart would look like. I will explain later in the PDF about why even though wehad a retest of the broken trendline, price did not continue higher.Market StructureTo understand market structure is simple, and it is easier on the larger timeframes. You need toidentify, HHs, HLs, LHs, LLs. That’s it. Simple enough?
Here I plotted the way I see market structure.HH higher highHL higher lowLH lower highLL lower lowR respect of previous market structure.The area I highlighted shows a trend reversal. Why? Well firstly there was a Head & Shoulders formationthat formed, but ignore that for now. The highlighted area, showed that it created a HH (later High for bearrun), but then price broke lower vs the previous HL, which indicates it created a LL, and a bear run hasstarted. But would I have entered at the LL as a sell? No! Why? Well I want another confirmation and aconfirm for me would be to see a LH first (Right Shoulder), this would allow me to enter with a betterRiskvsReward ratio, and confirm to me it will continue my way.Then to get back to why the trendline retest was invalid, let me show you the chart again.Look at the highlighted areas. The first highlighted area was our previous LH, we created a LL, andprice went up to the same area where the previous LH resistance was. What happened was that werespected the same price area, we did not break and close higher than the previous LH. Even though webroke the trendline, it does not indicate that we have changed to a bullish market.It does not indicate that we are in a bullish market because the previous LH resistance wasrespected and for us to become bulls, we must break the previous LH. Since we didn’t the retest of thebroken trendline in a way was a fake out, as you see that we dropped right back to the LL support.Now what is next? We don’t know. We are at a critical zone and we need more candles to confirm ifwe are going to break out bounce. We need strong exhaustion to show that we want to bounce up, thiswill also create confluence with a double bottom chart formation. If we break, the only point I will takesells is if we come back for a retest of the broken support.That pretty much summarizes market structure, I tried to make it as simple as possible, so if you arestill confused just keep practicing in identifying the market structure on the larger timeframes. If you arereally struggling just contact me.
Psychological LevelsOkay, psychological levels. Some might know it as Institutional Levels. Have you ever noticed thatprice stops on a whole number at reverses? Well if not, try plot the levels and have a look for yourself.However, let me show you an example below:Look at how price reacts. It is beautiful, but it doesn’t always happen. All this gives, is extraCONFLUENCE. There is a reason for all this, banks and institutions use these price levels for their entriesand exits. Why? Well, I am not sure but using even numbers is just easier for them to place orders andenter their TPs on.Rank of the strength of the Psychological Levels:1.2.3.4.000s.500s.200s .800sThe rest of the round numbers.Think about it, the big players move the markets, there has been research about these levels,obviously not all will match, but plot your zones and try round it up. This will just add extra confluence toyour levels, making it that much stronger, and increasing your confidence in entering a trade. There areother price levels that might be of interest to you. They are called Natural Price Levels. But I won’t begoing into detail. If you are interested just Google It! I use them occasionally but tend not to think of them.Natural S&R Levels 12 Months Highs & Lows [12 Month Range]Quarterly Highs & Lows [January-March Range, etc.] 12 months / 4 3 months RangeMonthly Highs & Lows [4 Week Range]Weekly Highs & Lows [Trading Week Range]Daily Highs & Lows [24 hour Range]Session Highs & Lows [Asian, London and New York]Intraday Fractals [Short Term S&R Intraday]Trendline Analysis [Channels, Triangles, etc.]
My Favorite Set Ups Entries SLs TPsI have a few favourite set ups and I will show photo examples of them. My favourite set ups are: Double Top / Double BottomRanging Box BreakoutHead and ShouldersIf you don’t know any of these formations and how they are supposed to look like, Google, BabyPips, orNaked Forex it. I have a few other set ups I look for, but they are more advanced. These are my favourite and thesimplest.Double Top / BottomHighlighted areas clearly show double bottoms. Double tops are just the opposite. Double Top MDouble Bottom WYou want to find these only at your strong zones, if it happens in between the zone, I find the set up beinginvalid. You want to also have some empty space on the left. This is straight forward. Now I will show you how Iwould place my trades.
Okay. Here we go. Double Bottom peaks are highlighted. There are 2 possible necklines that I saw here,marked in Red 1 and 2. The entries are marked in Black A and B. “A” is entered because there was momentum andstrong bullish candle that closed above neckline. “B” is entered because on the 2nd neckline we had a retest andexhaustion. SL is place below the previous wick or you can place it under the peaks, but since there was a wick Iplaced it under there. For the Take Profits, it is marked in Green X, Y and Z. Why? Well look left. I plan my tradesbefore I enter them. I have a calculated SL and my Take Profit targets. Price usually moves from Zone to Zone,moving in waves. When I hit my 1st TP target, I close 1 position or 1/3 of my position and the move my SL into profitsof about 10 pips (100 micro pips). Then, when 2nd TP target is hit, close ½ of the positions and move the SL for theremaining position further into profits.Ranging Box BreakoutMy next favourite set is the Box breakout. This happens when price bounces between 2 price ranges (e.g.between S&R).
There are 2 boxes I drew in blue. As you can see, price ranged in a “box”. When this happens there isanyways a breakout. So at 1 we have our box breakout with a strong bearish candle. Do we enter as soon as itbreaks? Well, you can, but I don’t. I wait for a retest of the area. The highlighted area on the left, we have our retest.Why do I wait for a retest? To me a retest signifies that the break is confirmed and the trend will continue lower tothe next zone.The box on the right is another “box”. As you can see the range is larger and there are no limits to how smallor big a box should be, you just have to watch price action. At 2 we have a strong breakout, again, you can enter assoon as it breaks but be ready to hold a drawdown. Price always respects strucuture. The 2nd highlighted area, youcan see that we went back to retest the area, had clear exhaustion, and dropped. I entered as soon as the firstbearish candle formed and engulfed the exhausted bullish candle. Let me annotate my trade.I keep my SLs above previous wick and TP at the next zone or at exhaustion. You have the choice to eitherhold all positions, close all positions, or close some and leave some in SL profits and let them ride. I wouldrecommend closing 50%-75% of all positions at next positions, then leave the rest of your positions at SL profits andlet it ride to the next zone. This way you already take some profit but you have the chance to let your profits growgreatly with no risk, except the certainity of getting more profit. What is so bad with that? This will be the best RRyou will ever get in trading. Risk nothing, just more profits (maybe less) Reward Double or Triple the profit.
Head and ShouldersH&S from my experience does not happen too often, but I do enjoy this set up. Here is an example of 2 H&Sformations. One that was successful and one that wasn’t.H headS shoulderN necklineR retestAs you can see on the left, we formed a H&S formation, with this formation I always wait for abreak of neckline and then a retest. From my experience, H&S formations take time to form and don’talways complete. For the formation to complete, you want a break of the neckline and then a retest. Thisleaves you with the best RR and highest probability that it will go your way. So, as you can see, we brokeneckline with a strong bearish candle (most likely due to news), then we must wait for a retest andexhaustion at the neckline level. Once we find exhaustion, we can enter a trade.Where do you put the SL? You put the SL above the “shoulders” wick. The TP, well the next zone.Always be sure to keep a 1:1 RR ratio at least. It is that simple. You just enter, trust and most importantly,don’t overleverage.Now why do I wait for the H&S neckline to break? Look at the 2nd H&S formation on the right. TheHead and Shoulder was formed and there was a clear neckline, but it did not break Neckline and continuehigher! This happens very often with H&S formations, just back test it yourself.Always wait for the neckline break, then enter on the retest. Remember this, almost all the timemarkets retest broken structure, so wait patiently. Just look on the left and look how many candles formedbefore we got our confirm. 1 candle 4 hours, think about it, there is no need to stare at charts
Risk ManagementRisk management is the most important part to Forex. Without accepting the risk before you placea trade you will already be emotionally attached to the money . Forex is a game of probabilities andmarket structure and price action will help you to greatly increase your probability of having a successfultrade. What many traders go through, including me, is placing a trade that is overleveraged either for youraccount or your emotions. Meaning, that you are either using lot sizes too large for your account, whichrisks you blowing your account completely (has happened to me), or opening a lot size where when youare in profits you are feeling euphoria and when you are in a drawdown you panic or are stressed out. Thiscan easily be fixed by calculating how much you want to risk prior to entering a trade, and I will provide asimple formula for all of you.Emotions are a key part of Forex, and Forex is 90% psychological and 10% technical, and taking outthe emotion aspect is the hardest thing a trader will face. I personally still struggle with this. However, howI overcome this, is by simply using this formula.Risk Management Formula: Lot Size (Risk ) / (Micro pips SL)For Example:Account Size: 1,000Risk Tolerance per Trade: 2%Trade SL: 250 micro pips or 25 standard pipsLot Size: XX (2% of 1,000) / 250X 20 / 250X 0.08So, the lot size you should be using is 0.08. This means on your 1,000 account you are only risking 20 on the trade you are planning to enter with a 0.08 lot size.This does not mean you must risk 2% per trade, this completely depends on you. You should becomfortable with the loss, because when I place a trade in the market, I see it as money already lost. So, ifyou are comfortable with losing that money, this will allow you to trust in your analysis, instead of gettingemotionally attached to the money you will lose and cloud your judgement.In addition, the most important part for me is moving your SL into profits. This reduce your risk to0% of the account and allows you to enter another set up with your set designated risk. Plus, any suddenspikes in price against you prevents any loss on your account.Cabin, but what if it hits your SL in profits and goes your way? My reply usually is, well it hits your SLand goes your way. Did you lose money? No. Did you make money? Yes, a small amount. What matters isthat you didn’t lose money. Blues Reds. Plus, later you can just wait for
Naked Forex it. I have a few other set ups I look for, but they are more advanced. These are my favourite and the simplest. Double Top / Bottom Highlighted areas clearly show double bottoms. Double tops are just the opposite. Double Top M Double Bottom W