Transcription
2018 Maine Educational AssessmentsIndividual Score Reports(MEA ISR)Quick Overview forParents/GuardiansThe 2018 Maine Educational Assessments (MEA) were administered this past spring.Test results of the 2018 MEA are available to districts and schools for distribution tostudents and parents or guardians.This webinar will review the Individual Student Report or ISR. The ISRs are 4-pagereports: Page 1 cover page Page 2 Science results when applicable Page 3 Mathematics results Page 4 ELA/Literacy resultsI am Nancy Godfrey, the Assessment Coordinator at the Maine Department ofEducation, and I am going to walk you through a report for fictitious students so youmay better understand your child’s report.1
Maine Educational Assessments (MEA)All students in eligible grade levels must participate in the state-required MEAs – eitherthe General MEA or Alternate MEA.The first part of this webinar will cover the *General Assessments. Review for theAlternate Assessment reports begin on slide #24.2
MEA - GeneralThe General Assessments consist of: Mathematics and English Language Arts (ELA)/Literacy – for students in grades 3-8this is the eMPowerME. Students in 3rd year of high school are assessed with theSAT. Science – students in grades 5, 8 and 3rd year of high school are assessed with thegeneral MEA Science. English Learners are assessed with the ACCESS for ELLs. Remember that based onthe date an EL student came to the United States and enrolled in a school for thefirst time, some students are exempt from the ELA portion of MEA only, and for oneyear only.3
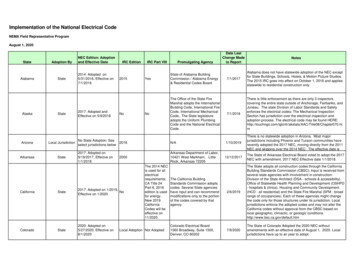
Individual Student Report (ISR) Cover PageThis is a view of the cover page of a general assessment Individual Student report.4
Individual Student Report (ISR) Cover PageThe top of the ISR cover page names the *Maine Educational Assessments IndividualStudent Report.The **9-digit number at the top left of the page is the student’s permanent K-12 StateStudent Identification (SSID) number.5
ISR Cover Page Cont.Under the title on the cover page is the *school year, MEA content areas, student’sname, grade, district and school.The *right side box includes a letter from the DOE Commissioner.6
ISR Cover Page Cont. (General)The bottom of the ISR general assessment cover page includes: *A description of the MEAs with a link to the Maine Learning Results standards; *A description of the Math and ELA/Literacy assessments and a link to the DOEassessment home page for more information; *A description of the Science assessments and a link to DOE assessment home page;and *A description of the scores and graphs on pages 2-4 of the ISR.7
MEA Scores and Achievement LevelsAll students receive an overall score on each contentarea: Math – ELA/Literacy – ScienceScores are specific to grade levels and testsFor each assessment, the overall score number thenplaces the student into one of four AchievementLevels:1. Above State Expectations2. At State Expectations3. Below State Expectations4. Well Below State ExpectationsAll students receive an overall score on each content area: Math – ELA/Literacy –ScienceScores are specific to grade levels and testsFor each assessment, the overall score number then places the student into one of fourAchievement Levels:1.Above State Expectations2.At State Expectations3.Below State Expectations4.Well Below State Expectations8
ISR Page 2 – MEA Science Results (general)This sample shows that student *Liese Codey is in 5th grade at Lennox Public Schools,Buford Elementary so this student was eligible for the general MEA Science in additionto Math and ELA/Literacy.Liese received a score of *542 of a possible 580 on the 5th grade Science.This score places Liese in the achievement level of *At State Expectations.For the 5th grade MEA Science, the *score ranges for the At State Expectationsachievement level are from 542 to 560, with a definition of the achievement level forScience describing the quality of a student’s answers on that test.The bar graph on the left shows *the corresponding color of At State Expectationsachievement level is shown for Liese’s 542 score next to the *thin bar distribution of all5th grade students state-wide in all achievement levels.The *small gray box, or bar, represents a probable range of scores *(in this case 538546) that the student could earn if he or she took the test multiple times.9
ISR Page 2 – MEA Science Results (general)The middle section of the general MEA Science ISR shows the student’s performancecompared to other 5th grade students in the school, district, and the state.The *left graph collapses the top 2 achievement levels (Above and At StateExpectations) into one category, and the lower 2 achievement levels (Below and WellBelow State Expectations) into one category.The information on this sample graph on the left shows that:1. *81.82% of 5th grade students in the Buford Elementary school scored At or Above2. *18.18% of 5th grade students in the Buford school scored Below or Well Below3. *54.66% of 5th grade students in the Lennox district scored At or Above4. *45.34% of 5th grade students in the Lennox district scored Below or Well Below5. *61.34% of 5th grade students in the state scored At or Above6. *38.66% of 5th grade students in the state scored Below or Well BelowThe *right graph shows the average 5th grade scores at the school, district and state.The information on this graph shows that:10
*The average 5th grade Science score in the Buford school was 550 *The average 5th grade Science score in the Lennox district was 542 *The average 5th grade Science score in the state was 545The blue arrows compares Liese’s score of 542 to the school, district and state averagescores.10
ISR Page 2 – MEA Science Results (general)General Science Released Items can be found at:https://www.maine.gov/doe/Testing Accountability/MECAS/supportsMEA ScienceThe bottom section of the general MEA Science ISR shows a closer look at the student’sperformance.*Released Items are on the left:Each year, the general MEA Science test has a number of actual test items that arereleased. These items can be found at the link on the left side under Released Items onthe ISR, and at the top of this slide.The table shows how the student answered each of these released items including*the question number,*the Maine Science standard it assesses, and*the student’s answer.A plus ( ) indicates that the student’s answer was correct. A letter indicates theincorrect multiple choice answer the student chose. A number indicates the pointsearned on a test item that was worth more than one point; for example not a multiplechoice question but one that required a written/constructed response.11
*Subscores on the right have more detailed information:This chart provides information about how the student performed on science standardscompared to other 5th grade students in the school, district and state.This chart shows: *Liese scored 14 of a possible 24 points on test items that were about the *physicalsetting standards *The Buford school scored an average of 16.5 of 24 points on physical setting testitems; *The Lennox district scored an average of 13.5 of 24 points on physical setting testitems; and *The state scored an average of 14.3 of 24 points physical setting test items *The same applies in the bottom row of student, school, district and state averagesregarding test items that were about the *living environment. Different Sciencestandards are assessed on different grade levels (5, 8 and high school).If there is an *astericks in any data boxes, that is because the number is less than 5 andrules state that data for small groups are suppressed to protect student privacy.11
ISR Page 3 – Math eMPowerME (general)Now we will review the ISR for the subject/content area of Mathematics, beginningwith the general Math assessment eMPowerME.Back to student *Liese Codey, who is in 5th grade at Lennox Public Schools BufordElementary. Liese received a score of *551 of a possible 590 on the 5th grade Math. Thisscore places Liese in the *achievement level of Below State Expectations.For the 5th grade eMPowerME Math, the score ranges for the *Below StateExpectations achievement level are from 544 to 559, with a definition of theachievement level for Math describing the quality of a student’s answers on that test.The bar graph on the left shows the corresponding color of Below State Expectationsachievement level is shown for Liese’s score of 551 next to the *thin bar distribution ofall 5th grade students state-wide in all achievement levels.Again, the *small gray bar, represents a probable range of scores that the student couldearn if he or she took the test multiple times.12
ISR Page 3 – Math eMPowerME (general)The middle section of the general eMPowerME Math ISR shows the student’sperformance compared to other 5th grade students in the school, district, and the state.As before, the *left graph collapses the top 2 achievement levels (Above and At StateExpectations) into one category, and the lower 2 achievement levels (Below and WellBelow State Expectations) into one category.The information on this sample graph shows the percentage of students in the At Above, and Well Below Below Expectations in the *school; *district; and *state.The *right graph shows average 5th grade scores in the *school, *district and *state.The blue arrow indicates Liese’s score of 551.13
ISR Page 3 – Math eMPowerME (general)https://www.maine.gov/doe/Testing Accountability/MECAS/supportsThe bottom section of the general eMPowerME Math ISR shows a closer look at thestudent’s performance.*The detailed 3 subscore categories for 5th grade mathematics are:*Numbers, Operations & Algebraic Thinking;*Geometry, Measurement & Data; and*Mathematical Processes. Subscore categories vary for each grade level. For moreinformation on subscores, please speak to your child’s school and teacher.This chart provides information about how the student performed on math subscorecategories compared to other 5th grade students in the school, district and state.This chart shows:Liese scored *11 of a possible 24 points on test items that were about numbers,operations & algebraic thinking; the Buford *school scored an average of 12.4;the Lennox *district scored an average of 9.4; andthe *state scored an average of 10.1*The same applies in the next 2 rows of student, school, district and state averages14
regarding test items that were about geometry, measurement and data; andmathematical processesComparisons should not be made across different subscores, and comparisons shouldnot be made for the same subscore across years.eMPowerME Released Items can be found at the link under the slide title, or on the ISRunder a closer look at your child’s performance.14
ISR Page 4 – ELA/Literacy eMPowerME (general)Page 4 of the report shows the results of the general English Language Arts(ELA)/Literacy assessment eMPowerME. Liese received a *score of 573 of a possible590 placing him in the *achievement level of At State Expectations.For the 5th grade eMPowerME ELA, the score *ranges for the At State Expectationsachievement level are from 560 to 575.*The bar graph on the left is corresponding color of At State Expectations achievementlevel next to the *distribution of all students in all achievement levels.15
ISR Page 4 – ELA/Literacy eMPowerME (general)The middle section of the general eMPowerME ELA ISR collapses the top 2achievement levels and the lower 2 levels and the student’s performance compared toother 5th grade students in the *school, *district, and the *state.The right graph shows average 5th grade scores in the *school, *district and *state.The blue arrow on the left indicates Liese’s score of 573. It is important to note in thissample that Liese’s *ELA score was above the school, district and state average.16
ISR Page 4 – ELA/Literacy eMPowerME (general)https://www.maine.gov/doe/Testing Accountability/MECAS/supportsThe bottom section of the general eMPowerME ELA ISR shows a closer look at thestudent’s performance.*The 3 reported subscore categories for 5th grade ELA are:*Reading,*Writing & Language, and the*Direct Writing or Essay.These 3 subscores for ELA are consistent for all grade levels 3-8. For more informationon subscores, please speak to your child’s school and teacher.This chart provides information about how the student performed on ELA subscorecategories compared to other 5th grade students in the school, district and state.This chart shows: Liese scored *27 of a possible 35 points on test items that were about reading; *the Buford school scored an average of 21.1; *the Lennox district scored an average of 16.0; and *the state scored an average of 17.7.17
Again this shows that Liese’s ELA subscores were higher than the school, district, andstate averages.The same applies in the next *2 rows of student, school, district and state averagesregarding test items that were about Writing & Language, and Essay.Comparisons should not be made across different subscores, and comparisons shouldnot be made for the same subscore across years.eMPowerME Released Items can be found at the link under the slide title, or on the ISRunder a closer look at your child’s performance.The *bottom of ELA general eMPowerME includes information regarding Lexilemeasures. The Lexile Framework for Reading evaluates reading ability and textcomplexity on the same developmental scale. For more information on Lexile measures,please speak to your child’s school and/or teacher.17
ISR Math SAT (high school general)High school students who participate in the general Math and ELA/Literacy test takethe SAT. Page 3 of the high school ISR shows the results of the SAT Math for *studentChau Babbel is in 3rd year high school at Lennox Public Schools Animo High.*Chau received a score of 430 of a possible 800 in Math, placing him in *achievementlevel of Below State Expectations. The score ranges for the Below State Expectationsachievement level are from *420 to 520.*The bar graph on the left corresponds to the color of the achievement level BelowState Expectations shown in the second bar; the *thin bar displays the stateperformance level of all students throughout the state in 3rd year high school andprovides a comparison of this student to state performance; and the *small gray bar,represents a probable range of scores that the student could earn if he or he took thetest multiple times.18
ISR Math SAT (high school general)The middle section of the general SAT Math ISR shows the student’s performancecompared to other high school students.*The four achievement levels are combined into 2 categories; shows the student’sperformance compared to other high school students in the *school, *district, and the*state.The right graph shows average high school math scores in the *school, *district and*state; and the *blue arrow on the left shows Chau’s score of 430.19
ISR Math SAT (high school general)*The 3 reported subscore categories for high school SAT math are:*Heart of Algebra,*Problem Solving and Data Analysis, and*Passport to Advanced Math.For more information on subscores, please speak to your child’s school and teacher.This chart provides information about how the student performed on math subscorecategories compared to other high school students in the school, district and state.This chart shows:Chau scored *8 of a possible 15 points on test items that were about algebra;*Animo high school scored an average of 7.5;*Lennox district scored an average of 7.5; and the*state scored an average of 7.7. This shows that Chau’s math subscores were higherthan the school, district, and state averages.The same applies in the next 2 rows of student, school, district and state averagesregarding test items that were about Problem Solving and Data Analysis, and Passportto Advanced Math.20
The SAT also provides *cross-test scores. These scores are based on selected questionsin the SAT Reading, Writing and Language, and Mathematics Tests and reflect theapplication of these skills in analysis of science, and history/social studies contexts.20
ISR ELA/Literacy SAT (high school general)Page 4 of the high school SAT ISR shows the results of the SAT ELA/Literacy. Chaureceived a score of *430 of a possible 800 in ELA placing him in the *achievement levelof Below State Expectations. The *score ranges for the Below State Expectationsachievement level are from 420 to 470.*The bar graph on the left corresponds to the color of the achievement level BelowState Expectations shown in the second bar; the thin bar displays the stateperformance level of all students throughout the state in 3rd year high school andprovides a comparison of this student to state performance; and the small gray bar,represents a probable range of scores that the student could earn if he or he took thetest multiple times.21
ISR ELA/Literacy SAT (high school general)The middle section of the general SAT Math ISR shows the student’s performancecompared to other high school students.*The four achievement levels are combined into 2 categories, and shows the student’sperformance compared to other high school students in the *school, *district, and the*state.The right graph shows average high school math scores in the *school, *district and*state; and the blue arrow on the left shows Chau’s score of 430.22
ISR ELA/Literacy SAT (high school general)*The 3 reported subscore categories for high school SAT ELA/Literacy are:*Reading,*Writing & Language, and*Essay.For more information on subscores, please speak to your child’s school and teacher.This chart provides information about how *Chau performed on ELA subscorecategories compared to averages of high school students in the *school, *district and*state.The SAT *cross-test scores chart on the right is a repeat of the same information fromthe high school ISR page 3.23
Maine Educational Assessments (MEA)We will now cover the ISR pages for a student who participated in *AlternateAssessments.24
MEA – Alternate AssessmentsIn order to be eligible for Alternate Assessments, students must have IEPs, meetalternate participation criteria, and must be flagged as alternate test takers in theirstudent enrollment: Mathematics and English Language Arts (ELA)/Literacy in grades 3-8 and 3rd year ofhigh school assessment is the Multi State Alternate Assessment or MSAA Science is tested in grades 5, 8, and 3rd year of high school with the PersonalizedAlternate Assessment Portfolio or PAAP English language learners with IEPs and alternate indicator must take the AlternateACCESS for ELLs25
Individual Student Report ISR (alternate)This is a full view of the cover page of an Alternate Assessment student report.26
Individual Student Report Cover Page (alternate)The top of the ISR cover page displays the Maine Educational Assessments IndividualStudent Report and indicates *Alternate ISR.The **9-digit number at the top left of the page is the student’s permanent K-12 StateStudent Identification (SSID) number.27
ISR Cover Page Cont. (alternate)Under the title on the cover page is the *school year, MEA content areas, student’sname, grade, district and school.The *right side box includes a letter from the DOE Commissioner.28
ISR Cover Page Cont. (alternate)The bottom of the ISR assessment cover page includes: *A description of the MEAs with a link to the Maine Learning Results standards; *A description of the Math and ELA/Literacy assessments and a reference to AAAAS, or Alternate Assessment based on Alternate Achievement Standards. *A description of the Science assessments and a reference to the AGLES or AlternateGrade Level Expectations *A description of the supports and features available with alternate assessments *A narrative on how these results help my child.29
MEA Scores and Achievement LevelsAll students receive an overall score on each contentarea: Math – ELA/Literacy – ScienceScores are specific to grade levels and testsFor each assessment, the overall score number thenplaces the student into one of four AchievementLevels:1. Above State Expectations2. At State Expectations3. Below State Expectations4. Well Below State ExpectationsJust as with general assessments, over all student scores in each content area : Math –ELA/Literacy – ScienceScores are specific to grade levels and testsFor each assessment, the overall score number then places the student into one of fourAchievement Levels:1.Above State Expectations2.At State Expectations3.Below State Expectations4.Well Below State Expectations30
ISR Page 2 – PAAP Science Results (alternate)This is page 2 of the student report for *5th grade student Flemming Vandewalle atLennox Public Schools, Felton Elementary. Flemming was assessed in science with thePAAP alternate science assessment.Flemming received a *score of 56 of a possible 69, with an achievement level of *AtState Expectations for 5th grade PAAP Science.For the 5th grade PAAP, the *score ranges for the At State Expectations achievementlevel are from 45 to 65.*The bar graph on the left corresponds to the color of the achievement level At StateExpectations shown in the second bar; the *thin bar displays the state performancelevel of all students throughout the state in 5th grade and provides a comparison of thisstudent to state performance.The *small gray bar, represents a probable range of scores *(in this case 48-64) that thestudent could earn if he or she took the test multiple times.31
ISR Page 2 – PAAP Science Results (alternate)The bottom section of the PAAP Science ISR shows a closer look at the student’sperformance.Each *Alternate Grade Level Expectation, or AGLE indicator, is the standard of theMaine Learning Results for science at a particular grade level and are listed across thetop bar.The *Level of Accuracy, *Level of Assistance, and the *Level of Complexity administeredare described for each AGLE. All three levels are used in a formula to calculate the finalstudent score.In this case, the student received a score between *20-60% of accuracy for AGLE D1 –the Universe and Solar System.The student received one or more of the bulleted *Levels of Assistance for a score of 2;and was administered items of *Level of Complexity 2.The bullets describe what a student was able to achieve at level of Complexity 2 withthe Level of Assistance 2.32
The Next two AGLES are also described; in this grade *D2-Earth, and *E2-Ecosystems.As depicted on the upper half of the report, this student achieved within the At StateExpectations achievement level, even though the student received more assistance atone AGLE. The more difficult items at Level of Complexity 4 brought this student’s scoreup to meet state expectation.32
ISR Page 3 – Math MSAA (alternate)This is page 3 of the ISR for a student who took the alternate math assessment, MSAA.Again, *Flemming is our 5th grade student at Lennox Public Schools, Felton Elementary.Flemming received a *score of 1246 of a possible 1290, with an achievement level of*At State Expectations for 5th grade math.The score ranges for the At State Expectations achievement level are from *1240 to1252, with a given definition of the achievement level.*The bar graph on the left corresponds to the color of the achievement level At StateExpectations shown in the second bar; the *thin bar displays the state performancelevel of all students throughout the state in 5th grade and provides a comparison of thisstudent to state performance.33
ISR Page 3 – Math MSAA (alternate)The middle section of the alternate MSAA Math ISR shows the student’s performancecompared to other 5th grade students in the school, district, and the state.*This graph collapses the top 2 achievement levels (Above and At State Expectations)into one category, and the lower 2 achievement levels (Below and Well Below StateExpectations) into one category. School and district comparisons are not shown as datafor small groups are suppressed to protect student privacy, *only the percentages atthe state level are shown.The blue arrow on the left indicates Flemming’s score of 1246.*The bottom section of page 3 shows a closer look at the student’s performance.The report shows a bulleted list of math skills students may be working on according tothe level of performance the student achieved. This example provides the performancelevel indicators specific for students performing At State Level Expectation in grade 5.34
ISR Page 4 – ELA/Literacy MSAA (alternate)This is page 4 of the ISR for our student who took the alternate ELA assessment, MSAA.*Again, Flemming is a 5th grade student at Lennox Public Schools, Felton Elementary.*He received a score of 1249 of a possible 1290, with an achievement level of *AtState Expectations for 5th grade ELA.*The score ranges for the At State Expectations achievement level are from 1240 to1255.*The bar graph on the left corresponds to the color of the achievement level At StateExpectations shown in the second bar; the *thin bar displays the state performancelevel of all students throughout the state in 5th grade and provides a comparison of thisstudent to state performance.35
ISR Page 4 – ELA/Literacy MSAA (alternate)The middle section of the alternate MSAA ELA ISR shows the student’s performancecompared to other 5th grade students in the state.*The four achievement levels are combined into 2 categories.School and district comparisons are not shown as data for small groups are suppressedto protect student privacy, *only the percentages at the state level are shown.The blue arrow on the left indicates Flemming’s score of 1249.*The bottom section of the alternate MSAA ELA ISR shows a closer look at thestudent’s performance. 5th grade students performing At State Level Expectation usebuilt-in supports to show what they know and can do. The report shows a bulleted listof ELA skills students may be working on according to the level of performance thestudent achieved. This example provides the performance level indicators specific forstudents performing At State Level Expectation in grade 5.*Below the Closer Look is a new section of the report. With the addition of the writingprompt incorporated in the ELA score, this chart breaks down the Reading and writing36
scores a student achieved. The student achieved *62% correct on reading items and*67% correct on the writing items of the ELA assessment.36
For more clarification, please contactyour student’s school/teacherORNancy Godfrey, Assessment Coordinator207-624-6775 nancy.godfrey@maine.govSue Nay, Alternate Assessment Coordinator207-624-6774 sue.nay@maine.govThis concludes the webinar on how to read and interpret Individual Student Reports.The MEA for reports for Science, Mathematics and ELA/literacy are only one source ofinformation about your child’s educational progress. Please speak with your child’steacher for additional information, or contact the DOE assessment coordinators listedon the slide.Thank you for your participation.37
*The average 5th grade Science score in the Lennox district was 542 . The bottom section of the general MEA Science ISR shows a closer look at the student’s performance. *Released Items are on the left: .