Transcription
HindawiBioMed Research InternationalVolume 2021, Article ID 4510423, 17 pageshttps://doi.org/10.1155/2021/4510423Research ArticlePrognostic Factors and a Nomogram Predicting OverallSurvival in Patients with Limb Chondrosarcomas: A PopulationBased StudyXinjie Wu ,1,2 Yanlei Wang ,2,3 Wei Sun ,1,2 and Mingsheng Tan21Peking University China-Japan Friendship School of Clinical Medicine, Beijing 100029, ChinaDepartment of Orthopedic Surgery, China-Japan Friendship Hospital, Beijing 100029, China3Beijing University of Chinese Medicine, Beijing 100029, China2Correspondence should be addressed to Wei Sun; drsunwei@126.com and Mingsheng Tan; doctortan 123@126.comReceived 12 April 2020; Accepted 3 May 2021; Published 17 May 2021Academic Editor: Khac-Minh ThaiCopyright 2021 Xinjie Wu et al. This is an open access article distributed under the Creative Commons Attribution License,which permits unrestricted use, distribution, and reproduction in any medium, provided the original work is properly cited.Introduction. We aimed to develop and validate a nomogram for predicting the overall survival of patients with limbchondrosarcomas. Methods. The Surveillance, Epidemiology, and End Results (SEER) program database was used to identifypatients diagnosed with chondrosarcomas, from which data was extracted from 18 registries in the United States between 1973and 2016. A total of 813 patients were selected from the database. Univariate and multivariate analyses were performed usingCox proportional hazards regression models on the training group to identify independent prognostic factors and construct anomogram to predict the 3- and 5-year survival probability of patients with limb chondrosarcomas. The predictive values werecompared using concordance indexes (C-indexes) and calibration plots. Results. All 813 patients were randomly divided into atraining group (n 572) and a validation group (n 241). After univariate and multivariate Cox regression, a nomogram wasconstructed based on a new model containing the predictive variables of age, site, grade, tumor size, histology, stage, and use ofsurgery, radiotherapy, or chemotherapy. The prediction model provided excellent C-indexes (0.86 and 0.77 in the training andvalidation groups, respectively). The good discrimination and calibration of the nomograms were demonstrated for both thetraining and validation groups. Conclusions. The nomograms precisely and individually predict the overall survival of patientswith limb chondrosarcomas and could assist personalized prognostic evaluation and individualized clinical decision-making.1. IntroductionChondrosarcoma is the most common bone sarcoma inaging populations and accounts for 30% of all malignantbone tumors [1, 2]. Central chondrosarcoma is the mostcommon type and accounts for 70% of all chondrosarcomasthat involve the proximal femur and proximal humerus [3].It is generally thought that, because of their extracellularmatrix, low percentage of dividing cells, and poor vascularity,chondrosarcomas are chemo- and radiotherapy-resistant.Surgical resection is the most widely accepted treatmentmodality for chondrosarcoma. For selected patients, however, surgery alone is clearly an inadequate treatment [4, 5].Rare histologic chondrosarcoma subtypes, many with characteristic clinicopathologic features, share the challenges forcare of the common subtypes. The disease demands concerted effort from researchers to undertake collaborativeresearch if outcomes are to improve.Survival is multifactorial; therefore, no single factor canaccurately predict survival outcomes for patients with limbchondrosarcoma. Thus, it would be desirable to establish astatistical prediction model that could integrate all individualprognostic factors to precisely predict the survival of limbchondrosarcoma patients. Nomograms are reliable and convenient statistical tools used to predict the overall probabilityof a specific outcome in various diseases by incorporatingnumerous prognostic factors [6, 7]. However, to the best ofour knowledge, no previous research has reported a comprehensive nomogram that predicts the overall survival ofpatients with limb chondrosarcoma. We therefore aim to
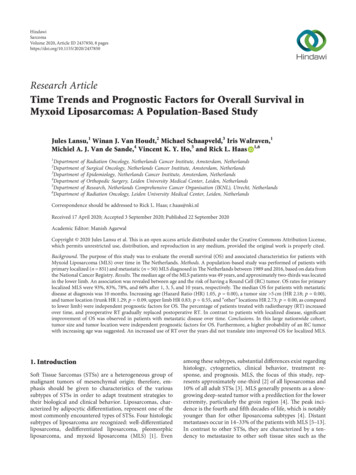
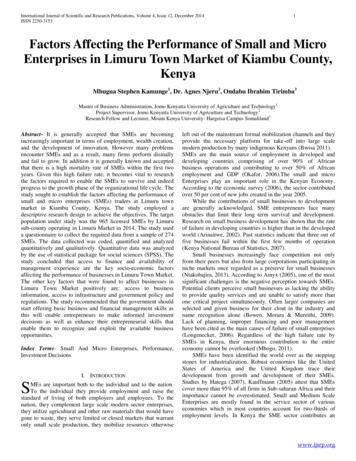
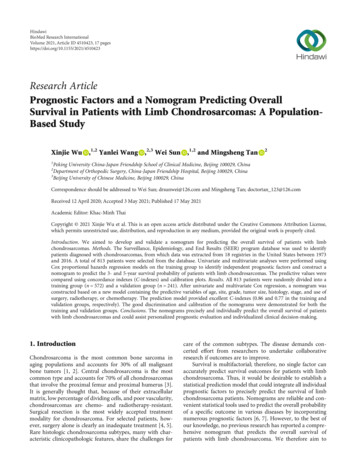
2BioMed Research InternationalChondrosarcoma(n 5196)Patients excluded that primarysite was not limbs(n 2552)n 2644Patients without positivehistologyexcluded (n 55)n 2589Patients excluded thatchondrosarcoma was not firsttumor (n 293)n 2296Patients excluded thatinformation wasnot clear (n 1483)Study population (n 813)Training group (n 572)Validation group (n 241)Figure 1: Flow diagram of the selection process in the Surveillance, Epidemiology, and End Results database.develop and validate a nomogram for predicting the overallsurvival of patients with limb chondrosarcomas.2. Methods2.1. Data Source and Inclusion Criteria. The present studyanalyzed the deidentified data obtained from the SEER 18registry via SEER Stat software (version 8.3.5; NCI,Bethesda, USA). The SEER Program is one of the largest registry sources of cancer information supported by theNational Cancer Institute of the United States and coversapproximately 30% of the U.S. population [8].Inclusion criteria were as follows: (1) diagnosis of chondrosarcoma as primary malignancy, (2) positive histologicalconfirmation of chondrosarcoma, (3) site limited to the limb,(4) known survival months after diagnosis and cause ofdeath, and (5) complete follow-up. Exclusion criteria wereas follows: (1) chondrosarcoma not the first cancer; (2) clearcell chondrosarcoma or mesenchymal chondrosarcoma; (3)unknown or blank information about tumor size, grade,stage, laterality, and total number of tumors; and (4)unknown use of surgery, radiotherapy, or chemotherapy.2.2. Prognostic Factors. Data on patient age, sex, race, year ofdiagnosis, primary site, tumor size, histology, grade, totalnumber of tumors, laterality, stage, use of surgery, use ofradiation, use of chemotherapy, and survival time untildeath or the time of the last follow-up were collected fromthe SEER database. The age at diagnosis was categorizedas younger than 40, 40-59, and 60 years and older [9].Race was categorized as White, Black, and others (American Indian/Alaskan Native, Asian/Pacific Islander). Histologic subtypes were categorized as conventional, myxoid,and dedifferentiated chondrosarcoma. The pathologicgrade was classified according to four categories: gradesI, II, III, and IV. Tumor size was classified into threegroups ( 8, 8-13, and 13 cm) [10, 11]. The total numberof tumors was categorized into two groups (n 1 and n 1). The tumor stage was categorized as localized,regional, and distant. As described in the 2018 version ofthe Summary Stage Manual provided by SEER (https://seer.cancer.gov/tools/ssm/), localized tumors were definedas a tumor confined to the periosteum. Regional tumorswere defined as a tumor that has extended beyond theperiosteum without distant metastasis.
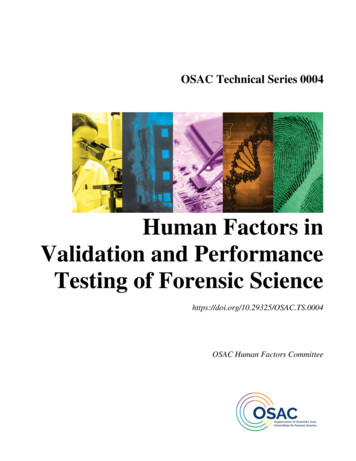
BioMed Research International3Table 1: Characteristics of patients with limb chondrosarcomas.VariableAge at diagnosis (years)Mean (SD)Median (Q1, Q3)Min, maxAge (years) 4040-59 ologyConventionalMyxoidDedifferentiatedGradeGrade IGrade IIGrade IIIGrade Surgery performedNoYesTotal number of tumorsn 1n 1RadiationNoYesChemotherapyNoYesTraining group (N 572)Validation group (N 241)Total (N 813)50.87 (16.99)51.5 (17.0, 102.5)10.0, 90.053.02 (17.24)45.0 (15.0, 95.0)8.0, 89.051.51 (17.08)51.0 (16.0, 100.0)8.0, 90.0145 (25.3%)247 (43.2%)180 (31.5%)55 (22.8%)88 (36.5%)98 (40.7%)200 (24.6%)335 (41.2%)278 (34.2%)488 (85.3%)51 (8.9%)33 (5.8%)214 (88.8%)15 (6.2%)12 (5.0%)702 (86.3%)66 (8.1%)45 (5.5%)319 (55.8%)253 (44.2%)133 (55.2%)108 (44.8%)452 (55.6%)361 (44.4%)190 (33.2%)20 (3.5%)335 (58.6%)27 (4.7%)91 (37.8%)10 (4.1%)124 (51.5%)16 (6.6%)281 (34.6%)30 (3.7%)459 (56.5%)43 (5.3%)470 (82.2%)24 (4.2%)78 (13.6%)198 (82.2%)15 (6.2%)28 (11.6%)668 (82.2%)39 (4.8%)106 (13.0%)202 (35.3%)223 (39.0%)76 (13.3%)71 (12.4%)91 (37.8%)95 (39.4%)33 (13.7%)22 (9.1%)293 (36.0%)318 (39.1%)109 (13.4%)93 (11.4%)p value0.100.070.380.880.270.370.590.52273 (47.7%)299 (52.3%)121 (50.2%)120 (49.8%)394 (48.5%)419 (51.5%)356 (62.2%)168 (29.4%)48 (8.4%)141 (58.5%)85 (35.3%)15 (6.2%)497 (61.1%)253 (31.1%)63 (7.7%)33 (5.8%)539 (94.2%)9 (3.7%)232 (96.3%)42 (5.2%)771 (94.8%)526 (92.0%)230 (95.4%)756 (93.0%)46 (8.0%)11 (4.6%)57 (7.0%)0.190.230.080.56540 (94.4%)32 (5.6%)225 (93.4%)16 (6.6%)765 (94.1%)48 (5.9%)522 (91.3%)50 (8.7%)221 (91.7%)20 (8.3%)743 (91.4%)70 (8.6%)0.84
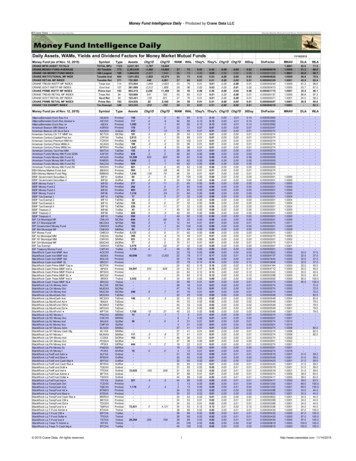
4BioMed Research InternationalTable 1: Continued.VariableTumor size 8 cm8-13 cm 13 cmSurvival time (months)Mean (SD)Median (Q1, Q3)Min, maxTraining group (N 572)Validation group (N 241)Total (N 813)337 (58.9%)127 (22.2%)108 (18.9%)134 (55.6%)66 (27.4%)41 (17.0%)471 (57.9%)193 (23.7%)149 (18.3%)61.01 (46.37)51.5 (17.0, 102.5)1.0, 154.056.06 (45.03)45.0 (15.0, 95.0)1.0, 155.059.54 (46.00)51.0 (16.0, 100.0)1.0, 155.0p value0.290.16Note: LU: long bones: upper limb, scapula, and associated joints; SU: short bones: upper limb, scapula, and associated joints; LL: long bones of lower limb andassociated joints; SL: short bones of lower limb and associated joints.2.3. Statistical Analysis. All statistical analyses were completed using R software (version 3.3.0; http://www.r-project.org/). Continuous variables that conformed to a normal distribution were expressed as the mean SD values and compared with Student’s t-test. Categorical variables wereexpressed as frequencies and proportions and compared withthe chi-squared and Fisher exact tests. The entire database ofpatients was randomly divided into a training group and avalidation group to construct and validate the nomogramsvia the R caret package (https://cran.r-project.org/package caret). Survival curves were created using Kaplan-Meiermethods for selected variables performed for overall survivaland compared with the log-rank test. Univariate and multivariate analyses were performed using Cox proportional hazards regression models to determine the factors associatedwith survival. Based on the predictive model with identifiedprognostic factors, a nomogram was constructed to predictthe 3- and 5-year survival rates of patients. The nomogramwas validated by a concordance index (C-index) and calibration curve both internally (training group) and externally(validation group). For all statistical analyses, a p value of 0.05 was considered significant.3. Results3.1. Patient Characteristics. A total of 5196 patients diagnosed with chondrosarcoma were registered in the SEERdatabase from 1973 to 2016, of whom 2644 (50.9%) had primary tumors in the limb. According to the inclusion andexclusion criteria, 813 patients were eligible for and wereeventually enrolled in the present study and randomlyassigned into the training group (n 572, for constructionand internal validation of the nomograms) or the validationgroup (n 241, for external validation of the nomograms)(Figure 1).Patients characteristics are shown in Table 1. Amongthese 813 patients, 452 (55.6%) were male and 361 (44.4%)were female. The mean age was 51.51 years (range, 8-90years), and the median survival time was 51 months (range,1-155 months). Of the whole population, the majority ofpatients were White (n 702 (86.3%)), and 668 (82.2%)had conventional chondrosarcoma. The major disease siteswere the long bones of the upper and lower limb and associ-ated joints (n 281 (34.6%) and n 459 (56.5%),respectively).Grade II was the most common of the pathologic gradesof chondrosarcoma (n 318 (39.1%)), followed by grade I(n 293 (36.0%)), grade III (n 109 (13.4%)), and grade IV(n 93 (11.4%)). The laterality of tumors was slightly moreright than left (n 419 (51.5%) and n 394 (48.5%), respectively). Localized and regional were the most common tumorstages, accounting for 61.1% and 31.1%, respectively. Thetumor size was less than 8 cm in 471 patients (57.9%),between 8 and 13 cm in 193 (23.7%), and more than 8 cmin 149 (18.3%). The total number of tumors equaling oneaccounts for 93% (n 756). Moreover, surgery was performed in most patients (n 771, (94.8%)). However, onlya small number of patients received chemotherapy andradiotherapy (n 70 (8.6%) and n 48 (5.9%), respectively).Among the patients who underwent surgery, 497 of them(61.1%) had localized disease, 253 of them (31.1%) hadregional disease, and 63 patients (7.7%) had distant disease.There were no significant differences for variables of patientcharacteristics between the training and validation groups.3.2. Prognostic Factors of Overall Survival. According to theunivariate analysis, overall survival was significantly relatedto age, site, histology, grade, stage, use of surgery, radiotherapy or chemotherapy, and tumor size (Table 2). Significantfactors identified by univariate analysis were further exploredin multivariate analysis, which demonstrated that age, grade,stage, and use of surgery were the independent prognosticfactors (Figure 2).3.3. Kaplan-Meier Curve Analyses. According to the KaplanMeier survival and log-rank tests, older age, long bones oflower limbs and associated joints, histologic subtype of dedifferentiated, higher grade, tumor stage of distant, no surgery,use of radiotherapy or chemotherapy, and larger tumor sizeresulted in worse rates of survival. However, gender, race,laterality, and total number of tumors were not significantfor survival (Figures 3 and 4). Notably, the curves werecrossed, suggesting that there might be multiple factors ofinterference.3.4. Nomogram. Based on the result of the Cox regression, webuilt and interpreted a nomogram for predicting the 3- and
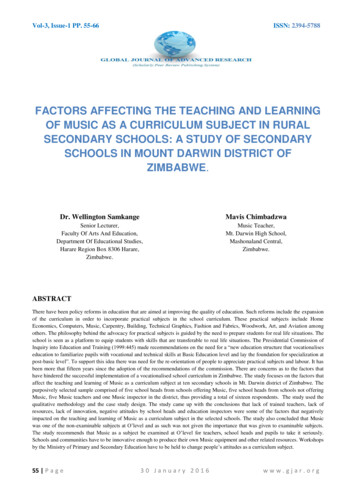
BioMed Research International5Table 2: Univariate Cox regression analysis in the training group.VariableAge 40 years40-59 years 60 yearsRaceHRUnivariate analysis95% CIp valueRef2.811.48-5.570.0037.233.72-14.05 0.001WhiteRefBla
Research Article Prognostic Factors and a Nomogram Predicting Overall Survival in Patients with Limb Chondrosarcomas: A Population-Based Study Xinjie Wu ,1,2 Yanlei Wang ,2,3 Wei Sun ,1,2 and Mingsheng Tan 2 1Peking University China-Japan Friendship School of Clinical Medicine, Beijing 100029, China 2Department of Orthopedic Surgery, China-Japan Friendship Hospital, Beijing 100029, China