Transcription
world trade report 2010B. Natural resources:Definitions, trade patternsand globalizationThis section provides a broad overview of therole that trade in natural resources plays in theglobal economy. It begins with a discussion ofdefinitions and terminology, focusing on keyfeatures that distinguish natural resources fromother types of traded goods. These featuresinclude the exhaustibility of natural resources,the uneven geographical distribution of resourceendowments, the presence of externalities in thespillover effects of extraction and use of naturalresources, the dominance of the naturalresources sector in many national economies,and the high degree of price volatility in thisclass of goods. A variety of statistical data relatedto natural resources are presented in order toillustrate the magnitude and direction of globaltrade flows.44
II – Trade in natural resources1. Definitions and key features of natural resources462. Natural resource trade flows and related indicators543. Modes of natural resources trade594. Natural resources: Globalization and the intellectual debate635. Conclusions70B. NATURAL RESOURCESContents45
world trade report 2010Since most natural resources trade is conductedthrough organized commodity exchanges, we examinethe role that financial markets play in determining pricesand quantities. This is followed by a historical accountof trade in natural resources since the industrialrevolution, touching on the recurring themes oftechnological change, trade liberalization and scarcity.This account also elaborates the evolution of thinkingabout how perceptions of natural resources haveevolved over time, including their role in determiningeconomic and political outcomes. Together, theseanalyses provide essential background information forthe theoretical and policy-related discussions insubsequent chapters.1.Definitions and key featuresof natural resourcesNatural resources are difficult to define precisely,particularly in the context of international trade. Mostpeople have an intuitive idea of what natural resourcesare, but “common sense” definitions cannot be reliedupon since they eventually run into problems whendealing with ambiguous cases. For example, crude oiland wood are clearly natural resources, but it is lessobvious how intermediate and final goods made fromthese products should be classified.All goods either embody natural resources (e.g.automobiles contain iron ore) or require resources fortheir production (e.g. food crops require land and waterto grow), so all goods could conceivably be classified asnatural resources. Such an approach would be logicallyconsistent but otherwise unenlightening. At anotherextreme, one could choose to focus strictly on resourcesin their natural state. However, even clear-cut examplesof natural resources would be difficult to classify assuch under this approach, since most resources requireat least some processing before they can be traded orconsumed. Regardless of the choice of definition, theline of demarcation between natural resources andother goods will always be somewhat arbitrary.For the purposes of this report we define naturalresources as “stocks of materials that exist in thenatural environment that are both scarce andeconomically useful in production or consumption,either in their raw state or after a minimal amount ofprocessing”.1 Note the qualifier “economically useful” inthis definition. For example, sea water is a naturalsubstance that covers much of the earth’s surface, butit is of limited intrinsic or direct value for consumption orproduction. Goods must also be scarce in the economicsense to qualify as natural resources; otherwise peoplecould consume as much as they wanted at no cost tothemselves or to others.46Air would not be considered a natural resource underthis definition because people can obtain it freely simplyby breathing. This is not to suggest that air (especiallyclean air) or for that matter sea water (e.g. as a carbonsink) are without value, but it does mean that they arenot commodities that can be traded in markets. In thisreport, the term “resources” is used interchangeablywith “natural resources”.A useful definition should not only identify the nature ofnatural resources but also distinguish what is and whatis not a natural resource. Under the above criteria, it isclear that manufactured goods such as automobilesand computers would not be considered resources,since both are subject to more than a minimal amount ofprocessing. However, this should not be taken to implythat all primary products are covered as naturalresources in the report. For example, while mostagricultural goods including food are primary products,we do not classify them as natural resources for anumber of reasons. To begin with, their productionrequires other natural resources as inputs, particularlyland and water but also various types of fertilizer. Moreimportantly, agricultural products are cultivated ratherthan extracted from the natural environment.Two important exceptions in this report relate to fish andforestry products, which are normally classified underagriculture in WTO trade statistics, but which are treatedhere as natural resources. Both fish and forestry productscan be cultivated, for example in aquaculture for fish orthrough forest management for wood. However,traditionally they have simply been taken from existingnatural stocks, and still are for the most part. Unfortunately,it is impossible to distinguish between cultivated and noncultivated varieties of these products in standarddatabases on international trade, but some effort hasbeen made to identify these in the case of fish.Natural resources can be thought of as natural capitalassets, distinct from physical and human capital in thatthey are not created by human activity. Natural capitalmay be a potentially important input in a country’s“production function” – that is, Y f (K, L, N), where “Y”is output, “K” is capital, “L” is labour and “N” is naturalresources. It is important to distinguish between naturalresources as factors of production and natural resourcesas goods that can be traded internationally. For instance,minerals, oil, and various other materials can beextracted and enter into trade. However, other resourcesmay form the economic basis for various sectors of thedomestic economy, and therefore are only involved intrade in an indirect way (Josling, 2009). For example,climate and scenery can be exported through tourism.Similarly, agricultural land, which is the archetypal “fixed,immobile” natural resource, can be exported throughagricultural commodities grown on that land. Hence, at afundamental level, natural resources are often a reasonfor trade rather than tradable goods in their own right.A more precise statistical definition that identifiesexactly which products are to be counted as naturalresources in trade data is provided in a StatisticalAppendix, but the main product groups covered in thisreport are fish, forestry products, fuels, ores and otherminerals, and non-ferrous metals. Taken together, theproduct groups ores and other minerals and non-ferrousmetals are referred to as mining products. Broaderconceptions of natural resources will also be employedfrom time to time, particularly as they relate to non-
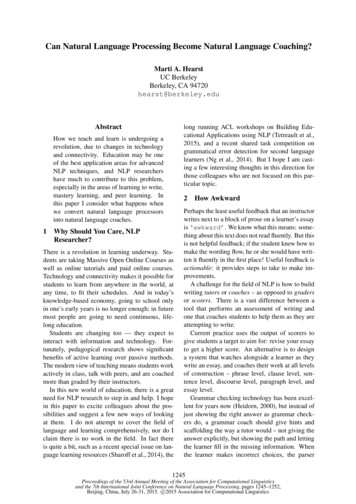
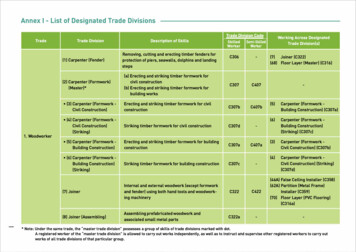
II – Trade in natural resourcestradable resources such as scenery, bio-diversity ornon-traded goods such as water or land.As noted earlier, natural resources falling under ourdefinition typically share a number of key features,including exhaustibility, uneven distribution acrosscountries, negative externalities consequences in otherareas, dominance within national economies and pricevolatility. We now examine each of these features andillustrate them with some concrete examples.(a) ExhaustibilityNon-renewable resources are defined as all resourcesthat do not grow or otherwise renew themselves overtime. Another way of putting this is that non-renewableresources exist in finite quantities, so every unitconsumed today reduces the amount available forfuture consumption. The most common examples ofnon-renewable resources are fossil fuels and mineraldeposits. The term exhaustible is sometimes used as asynonym for non-renewable, but it is worth noting thatrenewable resources may also be exhaustible if they areover-exploited.In general, the sustainable management of any resourcerests on a capacity to monitor the evolution of stocksand take corrective action in cases of significantdegradation or decline. In the case of man-madephysical assets, the cost of maintaining, renewing,expanding and improving the capital stock is an explicitpart of production costs (capital depreciation isaccounted for as an expense). For natural resources,however, this is not always the case. The value of naturalcapital is often not accounted for at the level of theindividual firm or in national accounts. This implies thatneither their contribution to growth nor the extent andimpact of their degradation are fully measured andrecognized by policy makers.Another type of cost that is related to exhaustibility butnot explicitly accounted for in natural resources use isthe effect of rent-seeking behaviour. The scarcity ofnatural resources generates economic rents (i.e. theTechnological change can effectively increase thesupply of resources by contributing to new discoveriesand allowing extraction of stocks that could not bereached before. According to the BP World EnergyReview (2009), proven world oil reserves 2 rose from998 billion barrels in 1988 to 1,069 billion barrels in1998 and 1,258 billion barrels in 2008, thanks largelyto new discoveries and advances in extractiontechnology. Changes in technology can also influencethe rate of depletion of a resource by either increasingits rate of use (e.g. electrical energy for increased useof electronics, computers, etc.) or decreasing it (e.g.improvements in the efficiency of automobiles).Technological developments like these would changethe rate at which a resource was used up, but it wouldnot alter the fact of its exhaustibility.B. NATURAL RESOURCESIn resource economics, a distinction is usually madebetween renewable and non-renewable resources. Arenewable resource is a resource that either increasesin quantity or otherwise renews itself over a short (i.e.economically relevant) period of time. Hence, if the rateof extraction takes account of limitations in thereproductive capacity of the resource, renewables canprovide yields over an infinite time horizon. Of course,the timeframe must be economically relevant, sincesome resources may be renewable in principle but notin practice. For example, it takes hundreds of millions ofyears for dead trees to be transformed into coal and oil(Blundell and Armstrong, 2007), and hundreds of yearsfor certain kinds of trees to grow to maturity (Conrad,1999), so old growth forests would not be consideredrenewable resources despite the fact that they dorenew themselves over time. Classic examples ofrenewable resources are fisheries and forests.premium that the resource owner receives aboveopportunity cost, or the cost of the next best alternativeuse of the relevant assets). Policies, including trademeasures, that alter the supply and demand and hencethe price of resources alter the distribution of rentsacross time and countries, sometimes lead tointernational tension.Many petroleum experts believe that world oil productionhas or soon will reach its maximum point, known as“peak oil” (Hackett, 2006) . Once oil production peaks,it is believed that future supplies will become more andmore difficult to obtain, causing the flow of oil to declineinexorably according to a logistic distribution known asthe Hubbert curve. This bell-shaped curve is namedafter M. King Hubbert, who accurately predicted in the1950s that United States oil production would peakaround 1970 and decline thereafter (see Figure 1).More pessimistic peak oil theorists predict enormouseconomic disruptions in the near future as a result ofrapidly dwindling supplies, while more optimisticobservers put the date of world peak oil productionmany years, if not decades, in the future. Peak oil theoryhas been less successful at predicting maximum oilproduction in countries other than the United States orat the world level, but few would dispute the notion thatoil production will begin to decline at some point in thefuture if current rates of consumption continue.Another example of a renewable resource that may be indecline is fish. According to statistics from the UnitedNations Food and Agriculture Organization (FAO), totalworld fisheries production rose from 98 million tonnes in1990 to 140 million tonnes in 2007, an increase of 42 percent. During the same period, total world exports of fishjumped 60 per cent from 33 million tonnes to 53 milliontonnes. The share of trade in world fish production alsoadvanced from 34 per cent in 1990 to 38 per cent in2007. Despite rising production and trade, annual catchesfrom oceans and fresh water fisheries have been mostlyflat during this period, at around 90 million tonnes, withnearly all growth in recent years accounted for byaquaculture, otherwise known as “fish farming” (seeFigure 2). This could indicate that the world’s oceans andfresh water fisheries have reached peak production andare in danger of over-exploitation in the face of growingdemand.47
world trade report 2010Figure 1: Monthly United States oil production, Jan. 1920-Jan. 2010 (Million n-1935Jan-1930Jan-1925Jan-19200Source: United States Department of Energy, Energy Information Adminstration.Figure 2: World fisheries production, 1990-2007 (Million tonnes)160Aquaculture productionCapture productionTotal fish Source: United Nations Food and Agriculture Organization, AQUASTAT database.(b) Uneven distribution across countriesMany natural resources are concentrated in a smallnumber of countries, while others have limited domesticsupplies. For example, Appendix Table 1 shows thatnearly 90 per cent of the world’s proved oil reservesare located in just 15 countries (out of slightly morethan 200 in the world today), and 99 per cent of oilreserves are found in 40 countries. 3 International tradecan help to alleviate these kinds of disparities in naturalendowments by allowing resources to move from areasof excess supply to areas of excess demand, whichmay also serve to promote the most efficient use ofthese products. However, since natural resources areindispensable inputs for production and are alsonecessary for maintaining a high quality of human life,the unequal distribution of resources can cause frictionamong nations.48The nature of the friction associated with naturalresources may be different from that observed in thecase of other types of goods. In most trade disputesinvolving agricultural or manufactured goods, a countryseeks to restrict imports. Many reasons may be givenfor this, including fiscal needs, support for an infant or a“strategic” industry, public considerations (health,environment, safety etc.), or as a response to tradepractices that the importing country perceives to beunfair. Conversely, most importing countries are eagerto obtain natural resources from foreign suppliers. Butexporting countries may be reluctant to allow theirresources to flow freely to other nations, also for avariety of reasons. These include fiscal needs, thedesire for economic diversification through additionalprocessing of raw materials, ensuring adequatedomestic supplies, and protecting the environment.The uneven geographical distribution of traded naturalresources is further illustrated by Maps 1 to 5 in the
II – Trade in natural resourcesWater is mostly non-traded but it is also very unevenlydistributed across countries. According to the UnitedNations, humanity is facing a drastic problem of waterscarcity (United Nations, 2009). The vast majority ofthe earth’s water resources are salt water, with only 2.5per cent being fresh water. Approximately 70 per centof the fresh water available is frozen in the icecaps ofAntarctica and Greenland, leaving just 0.7 per cent oftotal world water resources for consumption, and of this0.7 per cent, roughly 87 per cent is allocated toagricultural purposes. The world’s limited reserves ofclean, fresh water for human consumption are shrinkingfast, posing a serious threat to public health, politicalstability and the environment.Among the main factors aggravating water scarcity arepopulation growth, increasing urbanization, and highlevels of per capita consumption. Climate change is alsoexpected to contribute to greater water scarcity in thefuture, as rising temperatures lead to droughts,desertification and increasing demand for water. Theproblem of water scarcity is more acute in somecountries than in others, which is illustrated by Map 6 inthe Appendix. It shows that per capita water supplies aremany times greater in countries like Canada, Russia andBrazil than they are in the Middle East and large parts ofAfrica. For example, Canada’s supply of 87,000 m 3 perperson per year is roughly nine times greater than the9,800 m3 available to citizens of the United States everyyear. However, the US supply is nearly 14 times greaterthan that of Egypt, at 700 m3 per person per year.Moreover, Egypt’s water supply is roughly seven timesgreater than that of Saudi Arabia, with resources of just95 m3 per person per year (UN Food and AgricultureOrganization, AQUASTAT database).International trade could conceivably help to alleviatelocal problems of water scarcity by moving resources towhere they are most needed. However, countries areunable or unwilling to do so, as large-scale shipmentsare essentially non-existent. Reasons for this lack oftrade are largely technical, since water is bulky and istherefore difficult to transport. Water scarcity orabundance also tends to be shared by most countrieswithin a given region, so water would have to betransported long distances to make a difference to theproblem of scarcity.Although water itself may not be tradable, internationaltrade can have an indirect and beneficial effect ondomestic supplies of water. Exports of water-intensiveproducts (e.g. agricultural goods) from regions of waterabundance to regions where water is scarce cangenerate savings in importing countries by freeing upresources for other uses. For example, from 1997 to2001, Japan’s imports of water-intensive goods savedthe country 94 billion m 3 of water that would have beenrequired if Japan had produced the goods domestically(Hoekstra, 2008b).(c)ExternalitiesAn externality occurs when the actions of one economicagent affect other agents indirectly, in either a positiveor negative way (Nicholson, 2001). Another way ofexpressing this is that the outcomes of certain activitiesmay impose external costs on, or provide externalbenefits to, consumers or firms not involved in therelevant production or consumption decision. These“externalities” can be negative or positive. An exampleof a negative externality would be when a productionprocess results in pollution that adversely affects thehealth of people who live nearby, or that damages thenatural environment in a way that reduces the wellbeing of individuals indirectly. A positive externalitymight occur when homeowners make improvements totheir properties that raise the market value ofneighbouring houses as well.B. NATURAL RESOURCESAppendix, which show net exporters and net importersby product, based on merchandise trade data from theUN Comtrade database. The distribution of fuels andnon-ferrous metals is particularly noteworthy, since allof the world’s largest industrial economies are netimporters of these goods. With few exceptions,European countries are net importers of all types ofnatural resources, as are Japan and the Republic ofKorea. The United States is a net exporter of forestryproducts and mineral ores, but a net importer of allother tradable resources. India and China are only netexporters of fish, while they are net importers of theother resource products dealt with in this report. Russiais a net exporter, except of fish. Among major developedeconomies, only Canada is a net exporter of all types ofnatural resources discussed here.From a perspective of social well-being, externalitiescause goods to be over-produced or under-produced,depending on whether the externality is positive ornegative. This is because the market price of the goodin question does not reflect its true cost or benefit tosociety. A good whose production and use imposesexternal costs on other agents would tend to be overproduced because these additional costs are notincluded in the buyer’s calculations. On the other hand,goods that provide external benefits tend to be underproduced because their market price is too low. Thesolution to the problem of externalities, whether positiveor negative, is to internalize all costs and benefits intothe price of the good, but this is difficult to achieve inpractice without the intervention of an external agentsuch as a government.Natural resource economics is mostly concerned withnegative externalities arising from the extraction andconsumption of resources, but positive externalities inthis area are not inconceivable. For example, over-fishingof one species of fish may benefit another competingspecies and improve the welfare of other fishingenterprises. Another example would be when a miningcompany builds a road that enables nearby farmers toship their goods to market. Since this kind of unintendedconsequence is rare, the remaining discussion will focusexclusively on negative externalities. Externalities will bediscussed in greater detail in Section C, but the followingexamples illustrate the problem in the context of naturalresources.49
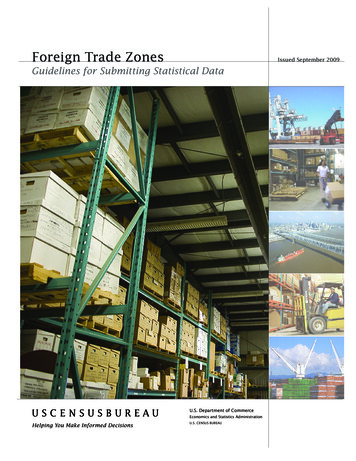
world trade report 2010account of rapid growth in some emerging economies(see Figure 4). Per capita CO 2 emissions of mostdeveloped economies rose through the 1970s, but havesince either stabilized or declined slightly.The burning of fossil fuels produces a variety ofpollutants that directly harm human health, while alsoemitting large quantities of greenhouse gases (mainlyCO 2) that contribute to global warming. Since globalwarming affects everyone on the planet, includingpeople who consume little fuel, the consumption offuels results in large externalities.The above figures are not adjusted for levels ofeconomic activity. The influence of this factor isobservable in terms of the carbon intensity of worldoutput, or the CO 2 /GDP ratio (see Figure 4). The ratiodeclined 33 per cent at the global level between 1971and 2007. To the extent that globalization raisesconsumption of fossil fuels through higher incomes andindustrialization, it can be seen as having a negativeimpact on the environment, but the increased efficiencyof production and the spread of technology associatedwith globalization may create some countervailingbenefits.According to statistics from the International EnergyAgency, annual world CO2 emissions from fuelcombustion more than doubled between 1971 and2007, rising from 14.1 billion tonnes to 28.9 billiontonnes (International Energy Agency (IEA), 2009a).During this period the share of developing countries inworld emissions increased from 34 per cent to 55 percent (see Figure 3). This increase can be attributed topopulation growth, rising GDP, and increasing percapita CO 2 emissions in a number of developingcountries. Global CO 2 emissions per person grew byaround 17 per cent between 1971 and 2007, withsharper increases towards the end of the period onAnother example of a negative externality is Hardin’swell known “tragedy of the commons” (Hardin, 1968) inwhich lack of ownership rights over a common poolFigure 3: Total world CO2 emissions by level of development, 1971-2007 (Million tonnes of CO2)30000Developed (OECD)Developing (rest of 7319710Source: International Energy Agency.Figure 4: World CO2 / GDP and CO2 per capita, 1971-2007(kg of CO2 per 2000 US dollars and tonnes of CO2 per capita)1.2World CO2 / GDP (left scale)4.5World CO2 per capita (right rce: International Energy 987198519831981197919771975197319710
II – Trade in natural resources(d) Dominance of natural resourcesAnother important feature of natural resources is thedominant position of this sector in many nationaleconomies. Many of these countries tend to rely on anarrow range of export products. Table 2 shows exportconcentration indices from the 2008 UNCTADStatistical Handbook, along with shares of naturalresources in total merchandise exports for selectedeconomies. Concentration indices are based on thenumber of products in the Standard International TradeClassification (SITC) at the 3-digit level that exceed 0.3per cent of a given countries exports, expressed as avalue between 0 and 1, with values closer to 1 indicatinggreater concentration. It is clear that with very fewexceptions, countries with the highest exportconcentration scores also have high shares of naturalresources in total exports.Appendix Tables 8 and 10 show leading traders of fuelsand mining products in 2008 and also illustrate theimportance of these products for exporting andimporting countries alike. For example, the share offuels in Saudi Arabia’s total merchandise exports wassome 90 per cent in 2008, while the equivalent sharefor Iran was 82 per cent. Export shares for Kuwait, theBolivarian Republic of Venezuela, Algeria, Nigeria andAngola were all in excess of 90 per cent. Although notas high as the shares for exports, fuels made up asignificant part of imports for the leading developedeconomies in 2008, including the United States (23 percent) and Japan (35 per cent).Shares of mining products in total exports are muchsmaller than the equivalent shares for fuels, but miningproducts still dominate exports in many countries,including Zambia (80 per cent), Chile (60 per cent),Niger (58 per cent), Jamaica (56 per cent) and Peru (43per cent).B. NATURAL RESOURCESresource leads to depletion of that resource. Thetragedy of the commons was first used to explainovergrazing on public land, but the concept can also beapplied to other common pool resources such asforests. Table 1 shows the countries with the largestdeclines in forest land between 1990 and 2005, basedon data from the World Bank’s World DevelopmentIndicators database. Countries in South America andAfrica experienced the biggest declines during thisperiod, while other regions recorded smaller drops, or insome cases small increases. Europe saw its forest arearise more than any other region, but there is considerableuncertainty surrounding increases in other areas,particularly in Russia. It should be noted that forestsdiffer significantly in the number of plant species theycontain and the number of animal species that inhabitthem, so that a given decline in forested land may havea greater impact on biodiversity in some regions than inothers. As of 2005, 11 per cent of the world’s forestswere designated for the protection of biodiversity (FAOGlobal Forest Resources Assessment, 2005).The dominance of natural resources in exports conformswith predictions from trade theory that countries willspecialize in the production of goods where they have acomparative advantage, and export them in exchangefor other goods. However, the fact that many countriesare both exporters and importers of natural resources isharder to explain. The Grubel-Lloyd (GL) index providesa useful measure of this kind of “intra-industry” trade.For a given country, the share of intra-industry trade insector i is defined as follows:GLi 1 - ( exporti – importi / (exporti importi) )If a country only exports or imports good i, then the GLindex for that sector would be equal to 0, whereas if acountry imports just as much as it exports it would havea GL score of 1 for that sector.Table 1: Countries with the largest declines in forested land, 1990-2005(1000 sq. km and percentage of land area)1000 sq. km% of land areaBrazil-423Honduras-24Indonesia-281Solomon Islands-21Sudan-88Korea, Rep of-17Myanmar-70Indonesia-15Congo, Dem. Leste-11Zimbabwe-47Myanmar-11Bolivarian Rep. of Source: World Bank World Development Indicators.51
world trade report 2010Table 2: Export concentration and share of natural resources in merchandise exports, 2006(Indices and percentage)UNCTAD Concentration Index(0-1)Share of natural resources in totalexports (per cent)World0.0824Angola0.96100Iraq0.95100Bolivarian Rep. of Venezuela0.9196Sudan0.8795Congo0.87.São Tomé and Príncipe0.8747Nigeria0.8692Yemen0.8591Libyan Arab Tajikistan0.7767Solomon Islands0.7781Maldives0.7799Saudi Mauritania0.7487Source: UNCTAD Handbook of Statistics 2008 and WTO Secretariat estimates.Table 3 shows GL indices for natural resources in majoreconomies at the 3-digit SITC level. Figures closer to 1indicate more trade in similar products, whereas smallerfigures indicate less intra-industry trade. Some productshave relatively high scores, including fuels and nonferrous metals. This could be explained by the fact thatthese products may be differentiated at lower levels ofaggregation, but it is also possible that large diverseeconomies contain some regions that export naturalresources and others th
For canexample, crude oil and wood are clearly natural resources, but it is less obvious how intermediate and final goods made from these products naturalshould be classified. All goods either embody natural resources (e.g. automobiles contain iron ore) or require resources for their p