Transcription
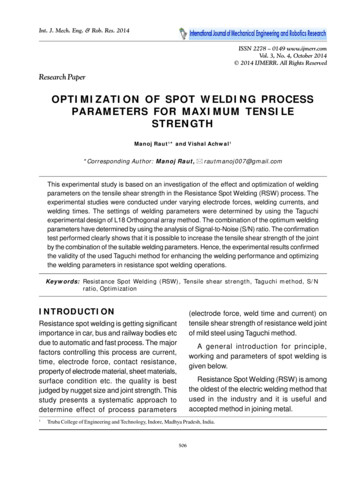
Int. J. Mech. Eng. & Rob. Res. 2014Manoj Raut and Vishal Achwal, 2014ISSN 2278 – 0149 www.ijmerr.comVol. 3, No. 4, October 2014 2014 IJMERR. All Rights ReservedResearch PaperOPTIMIZATION OF SPOT WELDING PROCESSPARAMETERS FOR MAXIMUM TENSILESTRENGTHManoj Raut1* and Vishal Achwal1*Corresponding Author: Manoj Raut, rautmanoj007@gmail.comThis experimental study is based on an investigation of the effect and optimization of weldingparameters on the tensile shear strength in the Resistance Spot Welding (RSW) process. Theexperimental studies were conducted under varying electrode forces, welding currents, andwelding times. The settings of welding parameters were determined by using the Taguchiexperimental design of L18 Orthogonal array method. The combination of the optimum weldingparameters have determined by using the analysis of Signal-to-Noise (S/N) ratio. The confirmationtest performed clearly shows that it is possible to increase the tensile shear strength of the jointby the combination of the suitable welding parameters. Hence, the experimental results confirmedthe validity of the used Taguchi method for enhancing the welding performance and optimizingthe welding parameters in resistance spot welding operations.Keywords: Resistance Spot Welding (RSW), Tensile shear strength, Taguchi method, S/Nratio, OptimizationINTRODUCTION(electrode force, weld time and current) ontensile shear strength of resistance weld jointof mild steel using Taguchi method.Resistance spot welding is getting significantimportance in car, bus and railway bodies etcdue to automatic and fast process. The majorfactors controlling this process are current,time, electrode force, contact resistance,property of electrode material, sheet materials,surface condition etc. the quality is bestjudged by nugget size and joint strength. Thisstudy presents a systematic approach todetermine effect of process parameters1A general introduction for principle,working and parameters of spot welding isgiven below.Resistance Spot Welding (RSW) is amongthe oldest of the electric welding method thatused in the industry and it is useful andaccepted method in joining metal.Truba College of Engineering and Technology, Indore, Madhya Pradesh, India.506
Int. J. Mech. Eng. & Rob. Res. 2014Manoj Raut and Vishal Achwal, 2014metal are joined together by applying electriccurrent and pressure in the zone to be weldand resistance welding is different From arcwelding because it’s not required filler metalor fluxes added to the weld area during thewelding process.Figure 1: Resistance Spot WeldingSpot welding operates based on fourfactors that are:1. Amount of current that passes through thework piece.2. Pressure that the electrodes applied on thework piece.3. The time the current flow through the workpiece.4. The area of the electrode tip contact withthe work piece.During the welding process the amount ofelectric current is flow from the electrodes tothe work pieces. The weld force is applied byleg pedal.Spot welding is widely used in weldingcarbon steel because they have higherelectrical resistance and lower thermalconductivity than the electrode that made fromcopper. The Spot welding is commonly beingused in automobile industry, where it is usedto weld the sheet metal forming a car.Squeezing the electrode to the work pieces,the right amount of pressure that applied onthe work pieces is very important in order toobtain the good quality of welds. During thewelding process, the electric current is flowSpot welders can also be completelyautomated, and many of the industrial robotsfound on assembly lines are spot welders.Spot welding also being used in the repairindustries.Figure 2: Resistance Welding MachineCircuitsPrinciple of Operation forResistance Spot WeldingResistance Spot Welding (RSW) is includedin the group of resistance welding processesthat heat is used in joining the work parts ofmetal. Heat is generated from electricalresistance across the two work parts InResistance Spot Welding two work part of507
Int. J. Mech. Eng. & Rob. Res. 2014Manoj Raut and Vishal Achwal, 2014R Resistance (in ohms)Figure 3: Time Sequence of the ResistanceSpot Welding Cycle: (1) Clamping Time,(2) Weld Time, (3) Hold Time, (4) Off Timet Time to current flow (in seconds)Resistance Spot WeldingParametersThe spot welding process parameters havetheir own importance. A small change of oneparameter will affect all the other parameters.These parameters will determine the qualityof the welds. The appropriate combination ofthe spot welding parameter will produce strongjoining and good quality of welding. Spotwelding parameters include.1. Electrode forcethrough electrode tips to the separate workpieces of metal to be joined.2. Diameter of the electrode contact surfaceThe resistance of the base metal toelectrical current flow causes heat, the heat islimited to the area which the tip of the electrodeand weld area contacts. While the welding forceis maintained, the heat is generating. In theholding stage (where the pressure is stillmaintained), the current is switched off and thenugget is cooled under the pressure. The heatthat generated in spot welding is basicallydepend on the electric current and the timebeing used and on the electrical resistance ofmaterial between electrodes.4. Weld time3. Squeeze time5. Hold time6. Weld currentElectrode ForceThe purpose of the electrode force is tosqueeze the parts to be weld and the primarypurpose is to hold the parts to ensure the partsin intimate contact at the joining interface.When the electrode force is increased the heatenergy will decrease, a high pressure thatexerted on the weld joint will decrease theresistance at the point of contact between theelectrode tips and the parts surface. Thismeans that the higher electrode force requiresa higher weld current. Weld spatter can behappen because the pressure on the tips istoo light or when weld current becomes toohigh. Too heavy pressure will cause small spotweld. In other words when the pressureincreases, the electrical current andsubsequent heat are transfer to a wider area,The amount of heat generated is a functionof current, time and resistance between theelectrode the heat that generates in resistancespot welding according to Joule’s law isexpressed by the Equation.H I2RtwhereH Heat is generated in joulesI Current (in amperes)508
Int. J. Mech. Eng. & Rob. Res. 2014Manoj Raut and Vishal Achwal, 2014the penetration and area of the weld willreduce.before releasing the welded parts, but it mustnot be to long as this may cause the heat inthe weld spot to spread to the electrode andheat it. The electrode will then get moreexposed to wear. Further, if the hold time istoo long and the carbon content of the materialis high (more than 0.1%), there is a risk theweld will become brittle. When weldinggalvanized carbon steel a longer hold time isrecommended.Diameter of the Electrode ContactSurfaceOne general criterion of resistance spotwelding is that the weld shall have a nuggetdiameter of 5 t1/2, “t” being the thickness ofthe steel sheet. Thus, a spot weld made in twosheets, each 1 mm in thickness, wouldgenerate a nugget 5 mm in diameteraccording to the 5 t½-rules. Diameter of theelectrode contact surface should be slightlylarger than the nugget diameter.Weld CurrentThe amount of weld current is controlled by twothings:Squeeze Time The setting of the transformer tap switchdetermines the maximum amount of weldcurrent available.Squeeze Time is the time interval between theinitial application of the electrode force on thework and the first application of current.Squeeze time is necessary to delay the weldcurrent until the electrode force has attainedthe desired level. The percent of current control determinesthe percent of the available current to beused for making the weld.Normally low percent current settings are notrecommended because it may harm the qualityof the weld. The weld current should be keptas low as possible. When determining thecurrent to be used, the current is steadilyincreased until weld spatter occurs betweenthe metal sheets. This indicates that thecorrect weld current has been reached. Thetemperature rises rapidly at the joined portionof the metal where the resistance is greatest ifthe current becomes too great internal spatterwill result.Weld TimeWeld time is the time during which weldingcurrent is applied to the metal sheets. The weldtime is measured and adjusted in cycles of linevoltage as are all timing functions. One cycleis 1/50 of a second in a 50 Hz power system.As the weld time is, more or less, related towhat is required for the weld spot, it is difficultto give an exact value of the optimum weldtime.Hold time (Cooling-Time)LITERATURE REVIEWHold time is the time, after the welding, whenthe electrodes are still applied to the sheet tochill the weld. Considered from a weldingtechnical point of view, the hold time is the mostinteresting welding parameter. Hold time isnecessary to allow the weld nugget to solidifyResistance Spot Welding (RSW) is gettingsignificant importance in manufacturing car,bus and railway bodies, etc., due to automaticand fast process. As the automobile joints aresubjected to higher loading condition hence509
Int. J. Mech. Eng. & Rob. Res. 2014Manoj Raut and Vishal Achwal, 2014to avoid the failure higher strength of spotwelded joint is required (Thakur andNandedkar, 2010). When the spot welded jointis subjected to pure opening condition then itfails in the direction of load applied and whenit subjected to combined opening and shearloading conditions it fails inclined from thesurface of weld nugget (Lin et al., 2003).Therefore the spot welded joint should bestrong in both in pure opening condition andin combined opening and shear loadingconditions. Though the process parameters ofthe spot welding also affect the mechanicalbehavior of welded joint in the loadingconditions so the parameters should also besuitable for the higher strength of joint (ChetanPatel, Dhaval Patel, 2012).joint. If one of the parameter changes, it mayaffect the strength of the joint so thecombination of suitable parameters are veryimportant to get a high strength welding joint.The process parameters affect as an increasein weld current, weld time and electrode forceresults in an increase in weld nugget diameterand width. An increase in weld current, weldtime and electrode force results in an increasein electrode indentation. So the parametersused should provide the high strength (Sahotaet al., 2013).In the optimization of welding parametersthe level of importance of the weldingparameters on the tensile shear strength isdetermined, the highly effective parametersMethod for the Optimization ofProcess ParametersTypes of Failure of the Welding JointThere are two fracture modes of the spotwelding joint have analyzed, they areOptimization of process parameters is the keystep in the Taguchi method to achieving highquality without increasing cost. This isbecause optimization of process parameterscan improve quality and the optimal processparameters obtained from the Taguchi methodare insensitive to the variation of environmentalconditions and other noise factors (UgurEsme, 2009). Interfacial mode (or nugget fracture):fracture of the weld nugget through the planeof the weld. The dominant failure mode forsmall diameter spot welds. Nugget pullout mode (or sheet fracture):fracture of the sheet around the weld; thenugget remains intact. Dominant for largediameter spot welds.An advantage of the Taguchi method is thatit emphasizes a mean performancecharacteristic value close to the target valuerather than a value within certain specificationlimits, thus improving the product quality.Additionally, Taguchi’s method f orSpot welds for automotive applicationsshould have a sufficiently large diameter, sothat nugget pullout mode is the dominant failuremode. Interfacial mode is unacceptable dueto its low load carrying and energy absorptioncapability (Stijn Donders et al., 2005).Table 1: Dimensions of SpecimenEffect of Process Parameters onStrengthThe spot welding process parameters play animportant role for the strength of the welding510Thickness(t) in mmWidth (w)in mmLength(L) in mmContactOverlap in mm0.8251502512515025
Int. J. Mech. Eng. & Rob. Res. 2014Manoj Raut and Vishal Achwal, 2014experimental design is straightforward andeasy to apply to many engineering situations,making it a powerful yet simple tool (Thakuret al., 2010). L27 Orthogonal Array can be usedto optimize the process parameters; a lossfunction is then defined to calculate thedeviation between the experimental value andthe desired value. The value of the overall lossfunction is further transformed into a Signalto-Noise (S/N) ratio. Regardless of thecategory of the quality characteristic, a largerS/N ratio corresponds to a better qualitycharacteristic. Therefore, the optimal level ofthe process parameters is the level with thehighest S/N ratio (Mohd Zaim Bin Din, 2008).Figure 5: RSW Specimenswidth and the contact overlap is 25 mm asshown if below figure.MATERIAL SELECTIONMETHODOLOGYMild steel sheets of thickness 0.8 mm and 1mm are used for the experiment. Mild steelcomprises of largest percentage of materialwelded with the resistance spot weldingprocess. The carbon present in the materialmay affect the properties of material after thewelding; the joint may become hard and brittle.Taguchi parametric design methodology wasadopted. The experiments were conductedusing L18 Orthogonal Array (OA) with threeparameters (electrode force, weld current,weld time) with three levels (level 1, level 2 andlevel 3).As the thickness of material increases thewelding current have to increase to producethe joint of sufficient strength.The process parameters, their symbols andtheir values at different levels are shown in thetable.Size and Dimensions of SpecimenOptimization of process parameters is thekey step in the Taguchi method to achievinghigh quality without increasing cost. This isbecause optimization of process parameterscan improve quality and the optimal processparameters obtained from the Taguchi methodare insensitive to the variation of environmentalconditions and other noise factors.The size of the specimens used for theexperiment is 150 mm in length and 25 mm inFigure 4: Configuration and Dimensionsof Specimen (All Dimensions are in mm)An advantage of the Taguchi method is thatit emphasizes a mean performancecharacteristic value close to the target valuerather than a value within certain specification511
Int. J. Mech. Eng. & Rob. Res. 2014Manoj Raut and Vishal Achwal, 2014Table 2: Process Parameters and Their Values at Different LevelsThickness(mm)0.8 mm1 mmSymbolProcessParameterUnitLevel 1Level 2AElectrode ForceN280.5269.2315BWelding CurrentKA6.98.410.3CWeld timeCycle51015AElectrode ForceN315334.5345.3BWelding CurrentKA8.410.311.8CWeld timeCycle51015limits, thus improving the product quality.Additionally, Taguchi’s method for experimentaldesign is straight and forward and easy toapply to many engineering situations, makingit a powerful yet simple tool.Level 3Table 3: Experimental Layout Using L18Orthogonal ArrayThe main disadvantage of the Taguchimethod is that the results obtained are onlyrelative and do not exactly indicate whatparameter has the highest effect on theperformance characteristic value. Also, sinceorthogonal arrays do not test all variablecombinations, this method should not beused with all relationships between allvariables.A large number of experiments have to becarried out when the number of the processparameters increases.To solve this task, the Taguchi method usesa special design of orthogonal arrays to studythe entire process parameter space with onlya small number of experiments. Using anorthogonal array to design the experimentcould help the designers to study the influenceof multiple controllable factors on the averageof quality characteristics and the variations ina fast and economic way.ExperimentElectrodeForce (N)WeldingCurrent (KA)Weld 131112112132132121422315231163131732118332RESULTS AND DISCUSSIONThe initial process parameters A2B1C2 hasselected and their tensile shear strength for0.8 mm and 1 mm specimens are found 2.3KN and 2.8 KN respectively.So all the specimens are welded using thedesign of experiment shown in the Table 3.512
Int. J. Mech. Eng. & Rob. Res. 2014Manoj Raut and Vishal Achwal, 2014better, the larger-the-better, and the morenominal-the-better. The S/N ratio for each levelof Process parameters is computed based onthe S/N analysis. Regardless of the categoryof the quality characteristic, a larger S/N ratiocorresponds to a better quality characteristic.Therefore, the optimal level of the processparameters is the level with the highest S/Nratio. The loss function of the larger the betterquality characteristics can be expressed as:Table 4: Experimental Results for theTensile Shear StrengthTensile Shear Strength (KN)Experiment No.0.8 mm1 982.32.591.92.3101.21.4112.42.8121.92.3Lj Overall loss function131.51.7n Number of tests142.83.1152.12.5161.41.6171.82.2181.51.6 1L j nn1 2 i yk 1 j –10logLjwhere,yi Experimental value of the ith quanlitycharacteristic j S/N RatioBy using the above equations jcorresponding to overall loss function for eachexperiment was calculated and given in Table 5.As we have seen before that all thespecimens are welded using the taguchimethod and now tensile shear testing of all thespecimens has performed using a Universaltesting machine. The tensile shear results ofall the specimens are shown in the Table 4.S/N Ratio AnalysisIn order to quantify influence of each level ofparameters, mean of S/N ratio for A werecomputed by averaging S/N ratio forexperiment Number 1, 2, 3, 10, 11, 12 for level1, 4, 5, 6, 13, 14, 15 for level 2 and 7, 8, 9, 16,17, 18 for level 3. Mean of S/N ratio for eachlevel of other welding parameters werecalculated in a similar way. Parameters withlarge difference indicate high influence to weldability as its level is changed. In this study,parameter B had largest difference followingits levels, whereas each level of parameter Ashowed less effect to output.A loss function is then defined to calculatethe deviation between the experimental valueand the desired value. Taguchi recommendsthe use of the loss function to measure thedeviation of the quality characteristic from thedesired value. The value of the overall lossfunction is further transformed into a Signalto-Noise (S/N) ratio. Usually, there are threecategories of the quality characteristic in theanalysis of the S/N ratio, i.e., the lower-the513
Int. J. Mech. Eng. & Rob. Res. 2014Manoj Raut and Vishal Achwal, 2014Variation in S/N Ratio with ProcessParametersTable 5: Overall Loss Functionand its S/N RatioThe graphs drawn below shows the variationin S/N ratio with the process parameters. Thegraphs shows the effect of the parameters.S/N Ratio (dB)ExperimentNumber0.8 mm1 24.08175.106.84183.524.08Graphs for 0.8 mm SheetFigure 6: Electrode Force (A) vs S/N RatioFigure 7: Welding Current (B) vs S/N RatioBased on S/N ratio, new operationparameters were obtained through maximumlevel of each parameter.Table 6: S/N Responses for the Tensile Shear StrengthThickness0.8 mm1 mmSymbolProcessParameterS/N Ratio (dB)Total MeanLevel 1Level 2Level 3MaximumMinimumAElectrode Force5.747.33*4.24BWelding de Force7.108.58*5.961.48BWelding Current4.918.94*7.78CTime7.226.947.49*Note: The * marked in the above table shows the optimum level of S/N Ratio.5143.095.897.214.151.160.27
Int. J. Mech. Eng. & Rob. Res. 2014Manoj Raut and Vishal Achwal, 2014Figure 8: Weld Time (C) vs S/N RatioFigure 10: Welding Current (B) vs S/NRatioGraphs for 1 mm SheetFigure 9: Electrode Force (A) vs S/N RatioFigure 11: Weld Current (C) vs S/N RatioThe response of the S/N ratio for the tensileshear strength is shown in Table 6. After the S/N ratio analysis it is found that the optimalparameters for the experiment are A2B2C3 forboth the sheets of 0.8 mm and 1 mm.Table 7: Results of the Confirmation onExperimentA2B1C2A2B2C3A2B2C3Tensile shear strength (KN)2.32.912.85S/N (dB)7.239.39.1A2B1C2A2B2C3A2B2C3Tensile shear strength (KN)2.83.383.42S/N (dB)8.9410.5910.68Level0.8 mmLevel1 mmOptimal Process Parameter515Improvementin S/N Ratio1.871.74
Int. J. Mech. Eng. & Rob. Res. 2014Manoj Raut and Vishal Achwal, 2014CONCLUSIONThen the prediction of S/N ratio and tensileshear strength is calculated by using thefollowing relationship * m ni 1This experiment was based on theoptimization of spot welding processparameters to find out the maximum tensileshear strength of the spot welded joint. Themild steel sheets of 0.8 mm and 1 mm ofdimensions 25 mm 150 mm have used asthe work piece. The Taguchi Method of L18orthogonal array has used to perform theexperiment. All the specimens are spot weldedusing the taguchi design of experiment. Thenthe tensile shear strength of work pieces isfound out using a tensile testing machine. Anoptimum parameter combination for themaximum tensile shear strength was obtainedby using the analysis of Signal-to-Noise (S/N)ratio. The confirmation tests indicated that itis possible to increase tensile shear strengthsignificantly by using the suitable parameters.The experimental results confirmed the validityof the used Taguchi method for enhancing thewelding performance and optimizing thewelding parameters in resistance spot weldingoperations. a m where, * Predicted S/N ratio m Total mean of S/N ratioa Mean of S/N ratio at the optimal leveln The number of main welding parameters,That significantly affects the performanceThe results of experimental confirmation areshown in the Table 7. Using optimal weldingparameters and comparison of the predictedtensile shear strength with the actual tensileshear strength using the optimal weldingparameters are shown in Table. Theimprovement in S/N ratio from the startingwelding parameters to the level of optimalwelding parameters is 1.87 dB and 1.74 dBfor 0.8 mm and 1 mm sheets respectively. Thetensile shear strength is increased by 0.63 and0.82 times for 0.8 mm and 1 mm sheetsrespectively. Therefore, the tensile shearstrength is greatly improved by using theTaguchi method.The experimental results show that thewelding parameters are the important factorsfor the strength of the welded joint. which mayincrease or decrease the strength of thewelding joint so we can say that thecombination of the suitable parameters isnecessary for the maximum strength of thespot welded joint.From the experiment it is found that theparameters of the spot welding are veryimportant factors for the tensile shear strengthof the welding joint. In this experiment it is foundthat the welding current is the main parameter,which may affect more to the strength of awelding joint.REFERENCES1. Chetan R Patel and Dhaval A Patel (2012),“Effect of Process Parameters on theStrength of Aluminium Alloy A5052 SheetsJoint Welded by Resistance SpotWelding with Cover Plates”, August.The change in process parameters from theinitial parameters results an increase in thestrength of the welding joint.516
Int. J. Mech. Eng. & Rob. Res. 2014Manoj Raut and Vishal Achwal, 20148. Sahota D S, Ramandeep Singh, RajeshSharma and Harpreet Singh (2013),“Study of Effect of Parameters onResistance Spot Weld of ASS316Material”, March.2. Khanna O P (2008), A Text Book ofWelding Technology, pp. 184-198,Dhanpat Rai Publication.3. Khanna O P and Lal M (2011), A Text Bookof Production Technology, Dhanpat RaiPublication, pp. 2.28, 11.78-11.82.9. Stijn Donders, Marc Brughmans, LucHermans and Nick Tzannetakis (2005),“The Effect of Spot Weld Failure onDynamic Vehicle Performance”.4. Lin S-H, Pan J, Tyan T and Prasad P(2003), “A General Failure Criterion forSpot Welds Under Combined LoadingConditions”, June.10. Thakur A G and Nandedkar V M (2010),“Application of Taguchi Method toDetermine Resistance Spot WeldingCondition of Austenitic Stainless Steel AISI304”, September.5. Lin S H, Pan J, Wu S R, Tyan T and WungP (2001), “Failure Loads of Spot WeldsUnder Combined Opening and ShearStatic Loading Conditions”, InternationalJournal of Solids and Structures, July,pp. 19-39.6. Mohd Zaim Bin Din (2008), “ExperimentalStudy on Strength of Spot Welded Joint”,November.11. Thakur A G, Rao T E, Mukhedkar M S andNandedkar V M (2010), “Application ofTaguchi Method for Resistance SpotWelding of Galvanized Steel”, November,ARPN Journal of Engineering andApplied Sciences.7. NachimaniCharde(2012),“Characterization of Spot Weld Growth onDissimilar Joints with DifferentThicknesses”, June.12. Ugur Esme (2009), “Application ofTaguchi Method for the Optimization ofResistance Spot Welding Process”,October.517
Resistance Spot Welding two work part of metal are joined together by applying electric current and pressure in the zone to be weld and resistance welding is different From arc welding because it’s not required filler metal or fluxes added to the weld area during the welding process. Spot wel