Transcription
Evaluating Minnesota HomesFinal ReportPrepared for:The Minnesota Department of CommerceBy:Sheltersource, Inc.June 30, 2002This report was prepared as part of an account of work sponsored underU.S. Department of Energy grant number DE-FG45-96R530335 to theMinnesota Department of Commerce, Energy Division. However, anyopinions, findings, conclusions, or recommendations are those of theauthors and do not necessarily reflect the views of the U.S. Departmentof Energy.
Table of ContentsEXECUTIVE SUMMARY. 4INTRODUCTION. 5STUDY OBJECTIVES . 5SAMPLING CRITERIA . 5VARIABLES BEING M EASURED. 6EFFECTIVENESS OF THE BUILDING ENVELOPE. 7AIRTIGHTNESS OF SAMPLE SET . 7INFRARED SCANNING. 9VENTILATION SYSTEM PERFORMANCE . 17VENTILATION AIR DELIVERY. 18VENTILATION S YSTEM DESIGN . 22INDOOR AIR QUALITY. 33PROTECTION AGAINST DEPRESSURIZATION . 33TEMPERATURE AND RELATIVE HUMIDITY MONITORING . 38AIR LEAKAGE FROM ATTACHED GARAGES . 41HOMEOWNER P ERCEPTIONS . 45ENERGY USE ANALYSIS. 46HOMEOWNER INTERVIEWS. 52COST ANALYSIS. 57CONCLUSIONS . 64EFFECTIVENESS OF BUILDING ENVELOPE. 64VENTILATION AND MECHANICAL S YSTEM EFFECTIVENESS . 64INDOOR AIR QUALITY. 65HOMEOWNER EDUCATION . 65COSTS AND BENEFITS. 65RECOMMENDATIONS FOR FURTHER RESEARCH. 66GLOSSARY. 67WORKS CITED. 69APPENDIX A . 70VENTILATION STRATEGY DIAGRAMS. 70APPENDIX B . 75APPLIANCES BROKEN DOWN BY YEAR . 75APPENDIX C . 762
PRISM TABULATED DATA . 763
Executive SummaryThis report summarizes an examination of specific building performance issues inMinnesota homes built during a time of transition in building practices and energy codechanges. It intends to evaluate the role these transitions play in improving housing to bemore durable, safer, and energy efficient. This project was undertaken to evaluate andcompare homeowner perceptions and the effectiveness of building envelope changes,combustion safety upgrades, and mechanical ventilation systems in homes built in 1994,1998, and 2000.A sample of 43 homes received performance testing and visual inspections. Thehomeowners were interviewed regarding energy use, comfort issues, indoor air quality,and mechanical system operation and maintenance. Utility usage was monitored andanalyzed to quantify energy savings resulting from efficiency upgrades.This study found that: Homes built under the Chapter 7672 and Category 1 codes are more tightlyconstructed than those built to Category 2 requirements by an average of 29%.The average 1998 home in this sample uses 21% less energy to heat than theaverage 1994 home.The average 2000 home in this sample uses 25% less energy to heat than theaverage 1994 home and 5% less than the average 1998 home.Mechanical ventilation systems of this sample set are meeting or exceeding theminimum airflow requirements of the new energy codes.Despite being less airtight, Category 2 homes in this sample are more susceptibleto combustion safety issues than Category 1 and Chapter 7672 homes.Homeowners want and need more information and guidance regarding theoperation and maintenance of their mechanical ventilation systems and how theyaffect the performance of their home.Incremental increased costs associated with energy code compliance amount toapproximately 1-2% of the cost of the home.Savings in heating and cooling costs offset the additional expense for energyupgrades to comply with the energy code in most homes reviewed.While this sample set is small and of limited use as a statistical predictor, the informationcollected provides valuable insight as to how some new homes are performing and as towhat issues need further attention. Energy code requirements alone do not guaranteehome performance, ensure indoor air quality, or improve attention to detail by buildersand subcontractors. The building industry has a goal of providing homes that are safer,healthier, more energy efficient and offer better durability while providing affordabilityin owning, operating, and maintaining homes. With this in mind, builders and consumersare learning to understand the complexity of improving building performance. Thiscreates a need for ongoing training for all facets of the homebuilding industry includingbuilding officials, subcontractors, manufacturers, and consumers.4
IntroductionMinnesota’s challenging climate dictates a systems approach to building which integratesenergy conservation, management of combustion gases against the effects ofdepressurization from exhaust appliances, ventilation for indoor air quality, andprevention of water intrusion. Energy code requirements in response to these challengeshave come under scrutiny, and little data exists as to actual performance of both newhomes and existing housing stock. The purpose of this study was to examine anddocument how key construction details, operation, and maintenance variables affect theenergy and indoor air quality performance of occupied homes, and to examine cost issuesrelated to implementation of energy code requirements.Study Objectives To examine the effectiveness of features installed in new homes to provide energyefficiency, protection against depressurization, improved indoor air quality, andincreased building durability. To identify less costly methods that could have been used to achieve similarlevels of energy efficiency, improved indoor air quality, and improved buildingdurability. To determine the typical operation and maintenance behavior of homeowners andhow operation and maintenance impact the energy use and air quality of homes. To prepare a report that can be used for future information and education projects.Sampling CriteriaThe sample size was limited to 40-45 homes due to the available project budget.An independent data research firm was retained to obtain lists of building permits forhomes issued in 14 Twin Cities metro area municipalities during periods in 1994, 1998,and 2000. A letter of solicitation was sent to 403 addresses inviting homeowners toparticipate in the study. 77 responses were received and all respondents were contactedby telephone. The study objectives, the nature of the field-testing, and the commitmentinvolved were explained to them in further detail.Because their participation was needed for the duration of the project, they were askedwhether they planned to move in the next year and a half. We also asked whether theywere currently involved in any litigation or dispute with their builder, which none were.Finally, they were asked whether they were available for house testing during daytimehours, including an initial visit of 4-5 hours. 43 homeowners agreed to participate.5
The homeowners agreed to allow Shelter Source to conduct thorough performance testingof their residence in the winter of 2000/2001 and also to two subsequent visits, one toexamine summer performance and one during the winter of 2001/2002. They also agreedto complete a homeowner survey during these visits, and they agreed to the release ofenergy usage data from their respective electric and gas utilities.The sample was intended to include a cross-section of homes built to Category 2,Category 1, and Chapter 7672 energy code requirements. Of the 43 homes, 23 were builtto Category 2 design, 15 to Category 1 design and 5 to the Chapter 7672 requirements.Six of the homes were built in 1994, 16 were built in 1998, and 21 were built in 2000.Code Distribution by Year BuiltCategory 2 Category 1767219946001998142020003135The homes in the sample reflect a variety of sizes and styles, as well as both custom andproduction builders. Each grouping of homes by year contained 1 or 2 person households,families with children, and retirees. All but two of the participant homeowners were theoriginal owners of their homes. Thirty were custom design/build homes, while 11 hadpurchased model homes.Variables Being MeasuredThe following variables were measured and used to compare homes in the study: Effectiveness of Building Envelopeo Air, vapor and thermal barrier continuityo Comparison of intentional and unintentional breaks in these barrierso Presence or absence of moisture problemso Presence or absence of comfort issuesVentilation and Mechanical System Effectivenesso Central ventilation system flowso Exhaust fan flowso Installation detailso Homeowner maintenance issueso Occupant comfort and satisfactionIndoor air qualityo Protection against depressurizationo Relative humidityEnergy Use Datao Comparison of total energy used for heating and coolingo Occupant satisfaction6
Effectiveness of the Building EnvelopeAirtightness of Sample SetThe airtightness of a building’s envelope directly affects the comfort, energy efficiency,durability, indoor air quality, and combustion safety of the structure. Recent codechanges have intentionally increased the airtightness of residential structures inMinnesota, but builders have been tightening their building envelopes, both intentionallyand unintentionally for years. Reasons vary from homeowner demands for increasedcomfort and energy efficiency to reducing their liability exposure caused by moistureissues related to uncontrolled air leakage. With these changes comes a greateropportunity for depressurization in combustion appliance zones due to various types ofexhaust fan operation. Despite the issues, information regarding the airtightness of newhomes in Minnesota is relatively sporadic. One goal of this study was to gather data inthis area.Test MethodsA calibrated Minneapolis Blower Door and the Automated Performance Testing (APT)system from The Energy Conservatory were used to conduct the airtightness testing.Multi-point blower door tests were conducted according to procedures outlined in the“Minneapolis Blower Door Operation Manual for Model 3 and Model 4 Systems” and“Automated Performance Testing System Software User’s Guide” from The EnergyConservatory. Multi-point tests were utilized to ensure accuracy and repeatability.Multiple multi-point blower door tests were conducted under windy conditions.All of the “intentional openings” in the building envelope were sealed for the test. ClassB flues were sealed in the mechanical room. The bottom of the vent was removed and thehole, or holes, where the furnace and water heater flues joined the class B flue weresealed on the inside of the class B flue. The bottom of the class B was than sealed in asimilar fashion. Combustion air hoods, ventilation system intake and exhaust hoods, andPVC flues were sealed on the exterior. Dryer vents, exhaust fan hoods and other devicesequipped with integral back-draft dampers were left in their normal operating state.Test ResultsThe average year 2000 home in our study was 40% tighter than one built in 1994, and28% tighter than one built in 1998 when the CFM per square foot of floor area iscompared. The average Category 1 and 7672 home is 29% tighter than the averageCategory 2 home. This tends to indicate that recent changes in code language requiringincreased air sealing have resulted in tighter buildings.7
Airtightness Distribution by YearCubic Feet Per Minute @ 50 PascalsCFM501994199820001000 or Less0051001 to 13003381301 to 16002471601 to 1900171Over s Distribution by YearAir Changes per Hour @ 50 PascalsACH501994199820001.0 or Less0001.1 to 2.001102.1 to 3.02793.1 to 4.0182Over 4.1300Total61621Average3.712.972.14Airtightness Distribution by YearCFM per Square Foot of Floor Area @ 50 PascalsCFM/Sq.Ft.1994199820000.24 or Less0030.25 to 0.301180.31 to 0.401680.41 to 0.500610.51 and Over431Total61621Average0.520.430.31The leakiest structure was a 1994 Category 2 home that tested at 0.75 CFM per squarefoot and 5.1 air changes per hour at 50 pascals (ACH50). The tightest home was a year2000 Category 1 home. Blower door tests indicated that this structure was 0.20 CFM persquare foot and 1.41 ACH50.8
Infrared ScanningQuantifying a building’s air leakage is an important exercise because air leakage directlyaffects building performance. Determining the origin of the air leakage is equallyimportant because the infiltration cannot be controlled until its origin is found. Partialdepth insulation, improperly installed insulation, or missing insulation also affectsbuilding performance in Minnesota’s climate. The performance testing of this sample setwas conducted during cold weather, with large temperature differences between indoorand outdoor conditions. This allowed for the integrated use of a blower door and infraredcamera in an effort to identify both insulation voids and the origin of infiltration.The infrared camera provides visual indication of temperature differences on buildingsurfaces. For example, the framing members within a wall are clearly spotted during ascan because of the difference in the insulation value of the wood stud vs. the stud cavity.Wood studs conduct heat at a faster rate than the adjacent insulated cavities when there isa sufficient temperature difference.Test MethodsThe infrared scanning was completed with an Agema Model 510 infrared camera. Theimages from the camera were recorded with a Sony Videoman 8 mm video recorder forlater review. The tapes were played back through digital imaging software to capture thestill pictures presented below.Two infrared scans were conducted on each home. One was conducted before theairtightness testing process began, with the house in its normal state, in order to find anyvoids or compression of insulation within wall cavities. The second scan was conductedwith the blower door depressurizing the house and drawing cold air from the outside.Initial Scanning For Insulation VoidsLarge dark spots in between framing members during the initial scanning indicate thesettling or improper installation of insulating material. There were few obvious insulationvoids found during the study. Areas that were expected to have problems, such as kneewalls and ceiling height transitions, were not found to contain serious voids or otherinstallation issues. Those that were found are presented below.9
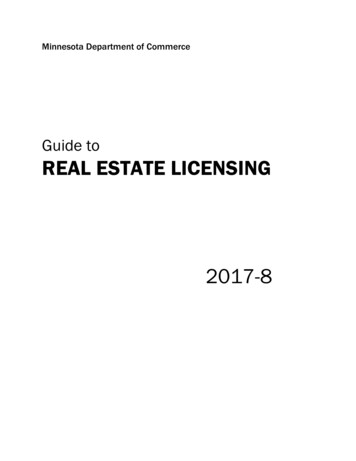
The above images illustrate an obvious void and serve as a good example of what can befound with infrared imaging. The dark areas in the infrared image correspond to the coldsurfaces caused by the missing insulation. This was in a 1998 home where a ventilationsystem was retrofit. The insulation was not put back in place properly after the exteriorhood and flex duct for the ventilation system were installed.This infrared image shows an insulation void in thecorner of the arched window in this 1998 home. Thisis a typical scenario for this detail due to the amountof framing members necessary to support thiswindow and the small amount of space left toprovide insulation, but this image would indicate thatthere is no insulation placed in that cavity.Careful installation of the insulation material, adequate air barriers, and wind-washprotection where applicable help to eliminate insulation voids and ensure theeffectiveness of insulation. Insulation voids do occur in Minnesota homes and attention todetail during the framing and insulation process is necessary to avoid them.Scanning Air LeakageAfter the initial scanning of the inside surfaces of exterior walls and ceilings, the blowerdoor was used to depressurize the home and draw cold air from the outside. The infraredcamera can than identify temperature differences on interior surfaces caused by the coldoutside air being drawn into framing cavities. The majority of the air leakage came frompredictable areas. Those areas were: bottom plates, attic bypasses, exterior outlets, doorsand windows, rim joists, cantilevered floor spaces, plumbing cavities, and framingcavities.10
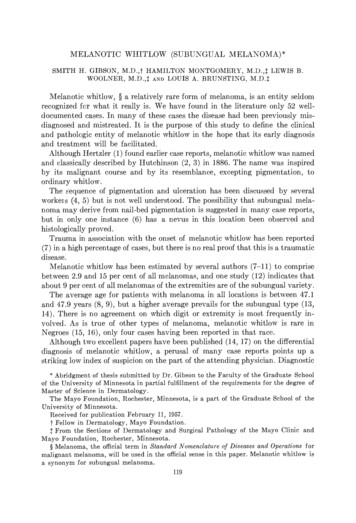
Bottom Plate LeakageThese pictures show air leakage from the crack between a sub-floor and bottom plate.Typically the leakage is greater in exterior corners of the floor due to the complexconnection of the adjoining walls and the physical properties of wood to expand andcontract with slight changes in moisture and temperatures. Using a plate gasket inbetween the sub-floor and the bottom plate or caulking the bottom plate to the sub-floorare two common ways of preventing this air leakage pathway.Attic bypassesAttic bypasses can contribute to the formation of ice dams during winter months and aretypically a large fraction of a home’s total air leakage rate.Air-leakage through recessed lights has a directconnection to the attic space. This picture showscold air being drawn in from an unconditioned atticabove the recessed light fixture. Most Category 1and 7672 homes demonstrated better air sealing atthis location.Increased availability of sealedrecessed lights and careful installation are essentialto the success of reducing air leakage at this detail.11
Light fixtures and other fixtures such as speakerswere also noted to have considerable leakagecharacteristics. This leakage was noted in 1994,1998 and year 2000 construction.The pictures above show cold air (the dark plumes) from the attic leaking into interiorwall cavities from the top plates. The cold air could be coming through unsealed wiringpenetrations or through unsealed cracks between the sheetrock and top plates. Observenot only the darkened corners and edges of the top plate, but also the dark spots formingbetween the stud cavities. This migration of cold air is caused by an air path present inthe wall cavity that is connected to the inside of the home. There was evidence of topplate leakage from all of the code types, but seemed to be less prevalent in year 2000homes. The potential for this leakage is variable depending on the outside perimeter andthe complexity of design. Homes with larger perimeters and complex features have morepotential for leakage than more compact homes.Sealing all the holes in the top plate with caulk or expanding foam and completelysealing the union of the sheetrock and the top plate will reduce the amount of air leakagebetween the attic and interior wall cavities. When the top plate is properly sealed the airpath will be eliminated and thus reduce the overall air leakage rate.12
Exterior outletsLeakage from exterior electrical penetrations wasexpected to be more of a problem in the 1994 and1998 homes than the year 2000 stock due to theincreased use of sealed exterior outlet boxes. Thiswas the case, but not to the degree expected. Someof the installations were well sealed; others leakedas much as regular boxes. Attention to detail isessential to the success of airsealing at thisassembly.Doors and windowsLeakage around doors and windows can occur when the interior poly or sheetrock is notsealed to the rough openings. The leakage may go unnoticed by the homeowner becauseof the nature of the leak. Many occupants may simply think that the leak is from animproper seal at the door or window, not the installation. Sealing the vapor barrier orsheetrock to the rough opening of the door or window, insulating the cavity between therough opening and the door or window, and properly sealing the exterior of the door orwindow frame to the exterior air barrier greatly reduces the potential for drafts at thedoors and windows.13
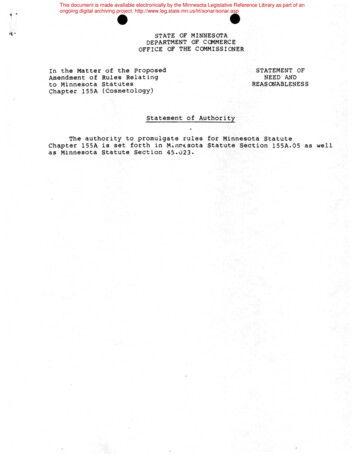
Rim joists and cantilevered floor spacesThese are shots of air leakage from floor cavities situated over attached garages. Both ofthe pictures are observed from adjacent kitchens. Note that the floor trusses are whitebecause they retain heat longer than the un-insulated cavities around them that are gettingwashed with cold air. This was noticed in homes of all code types.None of the homeowners in our study mentioned comfort issues that could be traced tothis situation, but many homeowners believe that the cold feeling from this room in thewinter is natural and to be expected because the room is over the garage. Sealed blockingabove the garage common wall would reduce the amount of air drawn into the wall andfloor cavities and isolate leakage from the cantilevered floor if it occurred.The leakage shown here was observed from anunsealed rim joist in a Category 2 home. There arealso air leaks noticeable above the patio door.14
This staining is a common visual indication of rimleakage in a main floor rim of a 1994 home. Thebatt of insulation has been filtering infiltration forsome time. Again, the proper sealing of the rim joistwould prevent the air leakage from spilling into thebasement.This is a main floor rim joist in a year 2000 home.Notice the light coming in around the PVC pipe.The majority of the rim is well sealed with rigidfoam and integrated with the polyethylene air/vaporbarrier below it, but this penetration is a weak point.Plumbing cavitiesThis is a second floor shower stall that is adjacent toan exterior wall and below an unconditioned attic.The object on the left of the picture is ashowerhead. The white lines are warm studs, whichare highlighted in black because of cold air fillingthe cavity.As easily as the air can enter the wall cavity under test conditions, warm moist air cantravel in the opposite direction during the winter. When this happens, accumulation ofwater in the wall cavity may occur due to condensation, challenging the systemsdurability.Because of homeowner demand for windows in bathrooms, and the common layouts ofbathroom floor plans, showers stalls on exterior walls are very common. The propersealing of the vapor behind the shower stall is crucial and steps should be taken earlyduring construction to ensure it happens.15
Framing cavities and dropped soffitsFramed cavities on exterior walls are also problematic from an air sealing perspective.Framed cavities in this study included cantilevered fireplaces, cantilevered entertainmentcenters and dropped soffits.Both of these pictures are framed fireplace cavities on exterior walls. Just as with theplumbing wall, the interior studs of these cavities appear warm when compared to theadjacent sheetrock. Had the cavity been sealed from exterior leakage, there would not beas significant a temperature difference and the dark areas would not be as evident.This is a dropped soffit in the basement of a 1998home with an air leakage signature similar to thoseof the framing cavities above.In a general sense, noticeable leakage seemed to diminish from year to year, with the year2000 homes having less obvious areas than the 1994/1998 homes. This is to be expectedconsidering the increase in airtightness found via blower door testing. However, there arestill some penetrations in the envelopes of new homes that will benefit from continuedattention to detail during the framing, insulation, and sheetrock stages of construction.16
Ventilation System PerformanceOne of the main goals of this study was to evaluate ventilation system performancewithin our sample set. Performance was based on the system’s ability to deliver outdoorair to the indoor environment. The distribution of fresh air within the homes was notquantified, but this factor does affect performance and the potential for properdistribution was evaluated.There are many factors that influence the performance of a mechanical ventilationsystem. The design of a system, its installation, its commissioning and homeownereducation are factors that have the most affect on ventilation air delivery from the builderand mechanical contractor perspective. Homeowners affect the performance of theirventilation systems through proper maintenance and operation. All of the above factorswere evaluated for this study.One of the 1994 homes, nine of the 1998 homes and all but three of the 2000 homes hadwhole house ventilation systems. The 1994 house had a heat recovery ventilator that wasinstalled at the time of construction. All of the nine 1998 homes had heat recoveryventilators. Six of the units were installed at the time of construction and three were laterretrofit, with the homeowners citing window condensation as the main purpose for theretrofit. The year 2000 ventilation systems varied in design and installation. There weretwo decentralized exhaust-only systems, two energy recovery ventilation systems (ERVs)and 13 heat recovery ventilation systems (HRVs). All of the systems were installed at thetime of construction. Balanced ventilation systems without heat recovery, centralizedexhaust only systems or fully ducted balanced ventilation systems were not found in thissample set. By definition, all of the Category 1 and 7672 homes had mechanicalventilation systems and one had been installed in 6 of the 21 Category 2 homes.Breakdown of Ventilation Types (# of Homes)*HRVERV1994101998902000132HRV/ERV Installation Types (# of Homes)*Install TypeSource PointGeneralVolume, Return/SupplyVolume, Return/ReturnExhaust Only0031994/19984330No Ventilation57320004533* Detailed descriptions of each particular ventilation type can be found in appendix A.17
Ventilation Air DeliveryThe ideal ventilation flow rate is a compromise between providing acceptable indoor airquality, which tends to maximize airflow from the outside, and energy efficiency, whichrequires a minimized ventilation flow rate (IAQ Handbook, 2.9). For the purpose of thisstudy, a “properly sized ventilation system” is defined as a system having a flow rate thatwould meet the requirements of chapter 7672.1000 of the Minnesota energy code. Thischapter of the energy code is based on the American Society of Heating, Refrigeratingand Air-Conditioning Engineers (ASHRAE) Standard 62-1989, “Ventilation forAcceptable Indoor Air Quality” and the 1993 Ontario Ventilation Code. It incorporates ascomprehensive an approach to calculating effective ventilation capacity as possibleconsidering the thousands of pollutants, pollutant interactions and human physiologicalinteractions that influence “acceptable indoor air quality”. It is comprehensive in that it“considers chemical, physical, and biological contaminants that can affect air quality.”(ASHRAE Standard 62-2001, 2.2)Chapter 7672.1000 requires a total ventilation rate (TVR), in cfm, of 0.05 times the totalconditioned floor area of the house. The total conditioned floor area includes thebasement. For example, a system in a house of 3,000 square feet would be sized to becapable of providing 3,000 x 0.05 150 cfm of outdoor air. Code language recommendsdividing the TVR into a people ventilation rate (PVR) and supplemental ventilation rate(SVR). The PVR is a minimum ventilation rate sized at 15 cfm per bedroom plus anadditional 15 cfm and is usually designed to operate on a continuous basis. A threebedroom house would have a PVR of (3 x 15) 15 60 cfm. The SVR is simply thedifference between the TVR and PVR, 150 cfm – 60 cfm 90 cfm.Calculation of PVR, TVR and SVRHouse total conditioned floor area:3,000# of Bedrooms:T otal Ventilation Rate (Total conditioned floor area X 0.05) (3,000 X 0.05) People Ventilation Rate (15 cfm per bedroom 15) (3 X 15) 15 Supplemental Ventilation Rate TVR - PVR 150 cfm - 60 cfm 3150 cfm60 cfm90 cfmVentilation systems installed in Category 1 and chapter 7672 homes are
A calibrated Minneapolis Blower Door and the Automated Performance Testing (APT) system from The Energy Conservatory were used to conduct the airtightness testing. Multi-point blower door tests were conducted according to procedures outlined in the “Minneapolis Blower Door Operation